
Pershing Square Inc. Leverages Permanent Capital and Corporate Conversion to Enhance Fee Scalability
The company’s 2026 quarterly filings reveal a strategic shift anchored by its corporate conversion and strengthened permanent capital base, underpinning scalable fee revenue.
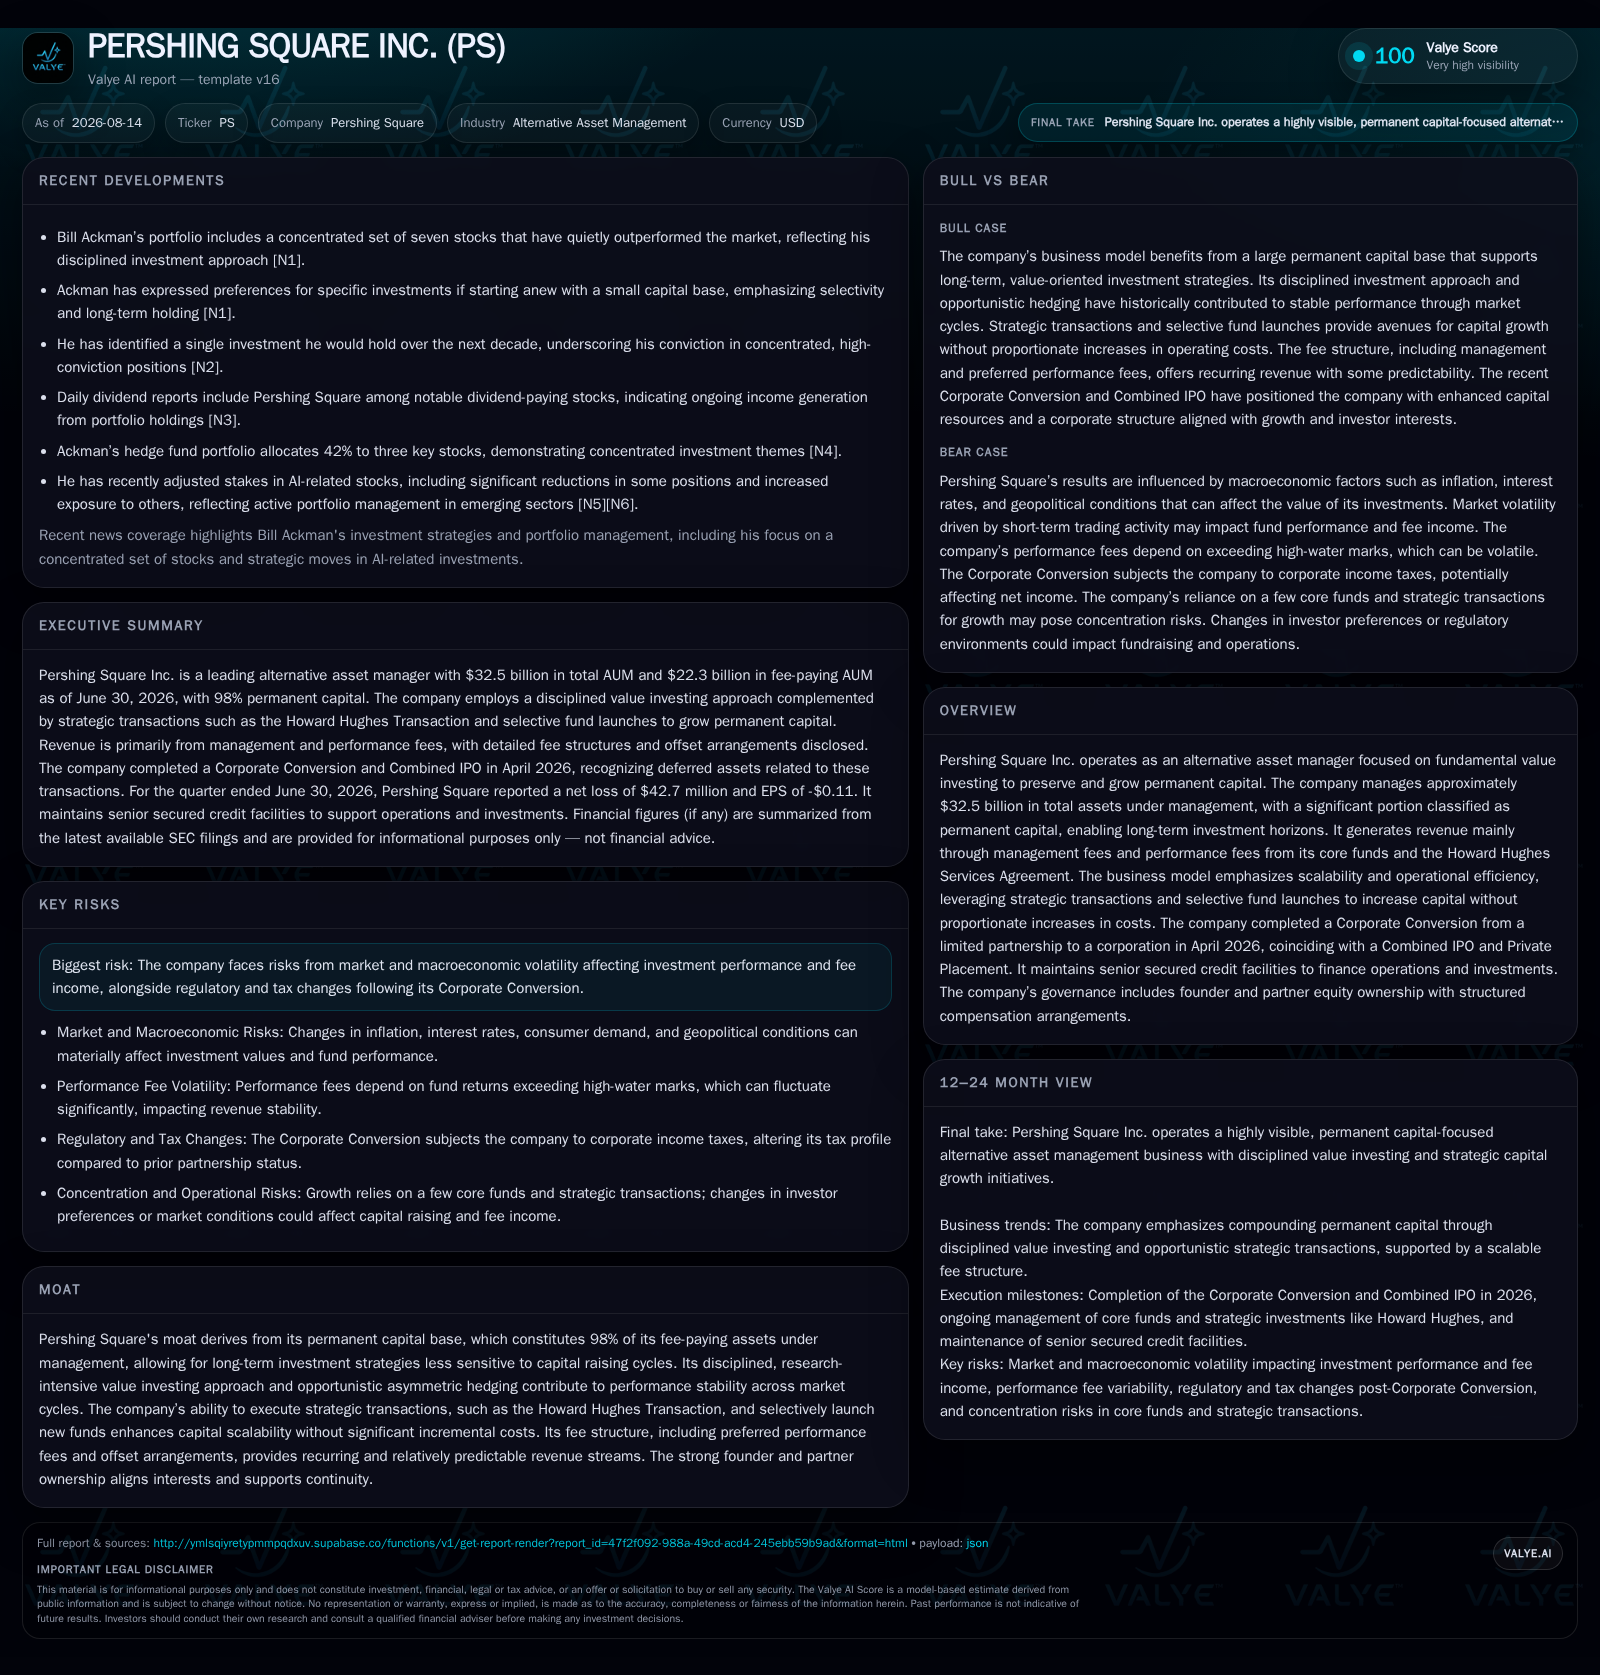
Pershing Square Inc.’s latest quarterly report highlights its transition from a limited partnership to a corporation in April 2026, unlocking new capital-raising avenues and operational efficiencies. With $32.5 billion in AUM, predominantly permanent capital, the company sustains a long-duration value investing approach complemented by opportunistic hedging. The firm’s fee revenue benefits from this stable capital base and strategic transactions that expand assets without proportional cost increases. Liquidity remains supported through senior secured credit facilities, while risks include market volatility and regulatory shifts post-conversion.
Recent Operating Update
Pershing Square Inc.'s most recent quarterly filing for the period ended June 30, 2026 marks a pivotal chapter following its Corporate Conversion on April 28, 2026, transitioning from a Delaware limited partnership to a Nevada corporation [S2]. This structural transformation coincided with a Combined Initial Public Offering (IPO) and Private Placement that expanded its permanent capital base materially without triggering substantial recurring operational cost increases [S2]. At quarter end, total assets under management stood at approximately $32.5 billion with fee-paying assets of $22.3 billion — remarkably, 98% of which constituted permanent capital, affirming the firm's long-term investment horizon and stability in fee generation [S2].
Liquidity-wise, the company replaced its legacy lines of credit with new senior secured credit facilities totaling $350 million — including a $250 million revolving facility and a $100 million term loan — entered into effective April 30, 2026 and maturing in April 2029 [S4,S5,S9]. As of June 30, it carried an outstanding balance of $134.8 million under the revolving facility, which increased post-quarter to $164.8 million in financing preparation for a new fund launch [S9]. Cash and equivalents totaled around $8.9 million against total debt of roughly $232 million by the same date [F1], establishing net debt near $223 million.
Operationally, despite reporting a GAAP net loss of approximately $42.7 million for the quarter primarily owing to unrealized mark-to-market losses on investments held at fair value — such as equity stakes in Pershing Square USA Ltd. (PSUS) and the Howard Hughes Corporation (HHH) — the firm generated positive net cash from operating activities amounting to $113.3 million over the first half of 2026 [F1,S15]. This divergence underscores non-cash valuation impacts relative to underlying cash profitability associated with core fee incomes.
Business Model Overview
Pershing Square differentiates itself within alternative asset management through an emphasis on fundamental value investing combined with asymmetrical hedging strategies aimed at preserving permanent capital while generating high returns over extended horizons [S2]. Revenue originates mainly via management fees based on fee-paying AUM and preferred performance fees keyed to realized investment gains within its flagship funds [S2,S14]. The permanence of capital (98% as reported) substantially reduces reliance on cyclical capital raising activities common among hedge funds or private equity firms reliant on redeemable fund structures.
A distinctive feature of the firm's model is leveraging strategic corporate transactions — exemplified by the Combined IPO/private placement and earlier the Howard Hughes Transaction — which enlarge the capital base ('overnight' increments) without commensurate increases in personnel or infrastructure costs [S2]. This highlights an operational leverage mechanism whereby marginal costs scale sublinearly relative to expanding AUM.
As an entity conducting almost exclusively U.S.-based operations through a consolidated single segment adhering to a "one-firm approach," Pershing Square maintains tight resource alignment across its investment advisory business [S2]. Management uses non-GAAP measures like Fee-Related Earnings (FRE) excluding volatile performance fees recalibrations regarding affiliates' rebates to gauge core fee profitability underpinnings [S13]. The firm also deploys profits toward dividends reflecting distributable earnings with an intention to pay nearly all post-tax distributable amounts quarterly while preserving board discretion for strategic adjustments [S16,S21].
Industry Structure and Competitive Position
Within the alternative asset management sector characterized by active alpha generation across public/private markets, Pershing Square occupies a nuanced niche combining elements found across hedge funds focused on long/short equity strategies and firms managing perpetual vehicles akin to Berkshire Hathaway's approach. Unlike traditional hedge funds that often face redemption pressures leading to forced asset sales in downturns or fundraising cyclicality, Pershing's near-total reliance on permanent capital diminishes liquidity-driven risk and affords more patient investment timelines.
Peers like Blackstone Group and Apollo Global Management exhibit diversified multi-strategy approaches incorporating credit and private equity alongside alternatives but typically depend on both permanent vehicles and redeemable fund formats subject to market cycles. Pershing's advantage lies in disciplined value investing powered by founder-led decision-making with aligned economic interests — Bill Ackman holding founder status further secures continuity and investor confidence.
Moreover, sustainable revenue scaling derives from relatively predictable management fee streams insulated by high permanent capital proportions adsorbed organically or via strategic transactions rather than traditional fundraising-dependent fee models vulnerable to competitive compression or cyclical downturns.
Growth Drivers
The principal growth driver remains organic compounding of permanent capital invested according to rigorous value principles complemented by opportunistic asymmetric hedging that cushions risk case while seeking upside participation [S2]. Performance excellence can attract incremental capital commitments when selectively launching funds or executing corporate transactions that expand the pool of fee-generating assets without proportionate fixed-cost addition.
The successful Combined IPO/private placement illustrates this dynamic: through issuing common stock combined with preferred share placements into PSUS affiliated vehicles, Pershing augmented its invested capital base significantly while maintaining control of operational costs [S10,S23]. Capital deployed into PSUS alongside partnerships like Howard Hughes diversified sources enable cross-leverage synergies benefiting performance fees indirectly.
Extension into new funds or geographies remains optional but feasible given existing infrastructure strength.
Analysts should also track insider trading activity related to Rule 10b5-1 plans as proxies for executive sentiment though no recent arrangements were initiated in Q2 2026 per disclosures [S22]
Financial Profile Discussion
As of June 30, 2026, Pershing Square Inc.’s balance sheet reflects cash & equivalents amounting to approximately $8.9 million against total recorded debt of roughly $232 million, yielding an estimated net debt position close to $223 million dominated by senior secured borrowings entered upon its corporate formation earlier that year [F1]
Operating income swung negative at about -$90 million for Q2 driven largely by mark-to-market effects rather than core operating loss indicating transient unrealized valuation charges rather than operating weakness per se; net income mirrored this pattern albeit less severely at -$42.7 million reflecting non-cash fair value write-downs on key investments including PSUS holdings acquired during the Combined IPO transaction [F1,S14]. Despite this GAAP loss profile, operating cash flows were strongly positive ($113.3 million over six months), reflective of underlying recurring fee revenue less compensation and expense deductions tied directly to operational scale rather than portfolio pricing fluctuations
The firm’s dividend policy adopts prudence allowing distributions approximating near-total distributable earnings post-tax while retaining board oversight enabling retention flexibility responding dynamically to market/tax conditions without jeopardizing investor expectations [S16,S21]. Going forward, attention should center on sustaining robust fee-related earnings amid potential macro challenges balanced against manageable leverage profiles backed by high-quality collateral pools embedded within portfolio assets.
This analysis synthesizes publicly available SEC filings along with established industry knowledge specific to alternative asset management emphasizing value investing with permanent capital vehicles. Any financial figures referenced conform strictly only to latest disclosures without extrapolation or speculative assumptions. This report intends solely as an informational perspective without offering investment advice or endorsements regarding securities mentioned herein.
Disclaimer: This is research-only, informational analysis and not investment advice. It may include AI-generated interpretation and general industry context. Always verify important details using primary sources.

Comments