
PTC Therapeutics’ 2025 Rebound Driven by Rare Disease Portfolio Expansion and Licensing Milestones
PTC Therapeutics posted a strong 2025 turnaround fueled by key product launches, milestone payments, and collaboration revenues despite ongoing contingent payment obligations.
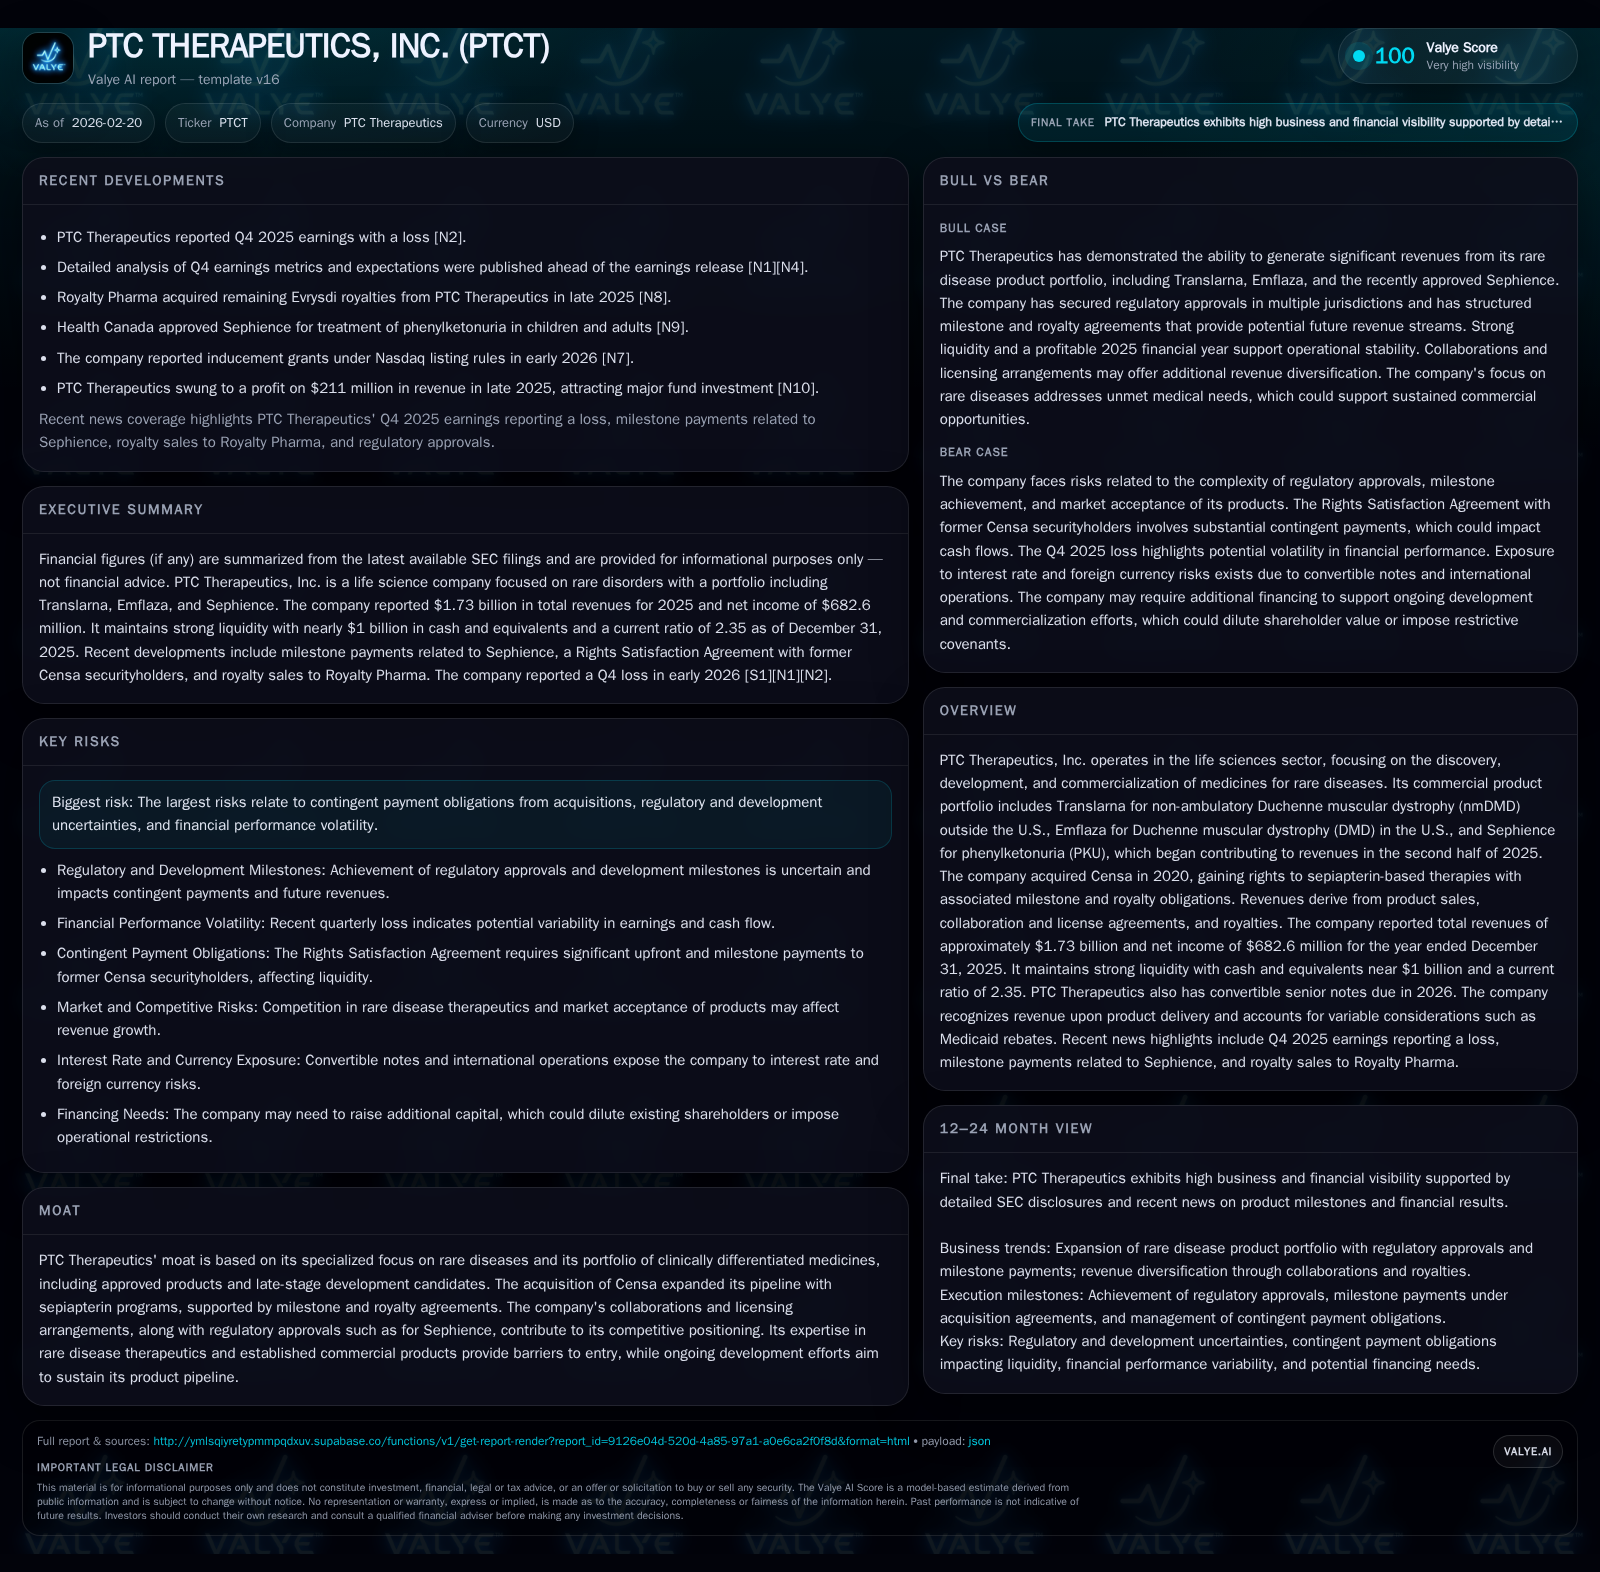
PTC Therapeutics reversed multi-year losses in 2025 with $1.73 billion in total revenues and net income of $683 million, primarily driven by growth in its Duchenne muscular dystrophy therapies and the recent commercial launch of Sephience for PKU. The company’s acquisition of Censa and milestone-triggered payments under license agreements contributed to expanded pipeline assets but entail significant contingent liabilities. Robust operating cash flow and near $1 billion in cash support ongoing R&D investments and commercial expansion, while future growth hinges on further development progress and regulatory approvals.
Overview
PTC Therapeutics is a global biopharmaceutical company focused on discovering, developing, and commercializing clinically differentiated medicines for rare disorders. Key marketed products include Translarna (for non-ambulatory Duchenne muscular dystrophy outside the U.S.), Emflaza (Duchenne muscular dystrophy in the U.S.), and more recently Sephience for phenylketonuria (PKU), which began contributing revenues starting in the second half of 2025 following regulatory approvals.
The strategic acquisition of Censa in May 2020 expanded PTC's pipeline with sepiapterin-based therapies but introduced substantial contingent milestone and royalty payment obligations potentially reaching hundreds of millions of dollars based on development progress and sales thresholds [S1][S14].
Historical Performance and Revenue Drivers
PTC showed a marked financial turnaround in FY2025 after several years of losses. Total revenue increased by approximately 115% from $807 million in 2024 to about $1.73 billion in 2025. This growth was driven by rising product sales—including Sephience's launch—and licensing and collaboration revenues largely attributable to the Novartis agreement signed late in 2024 [F1][S9].
Historical performance (annual)
| FY | Net ($mm) | CFO ($mm) | OpInc ($mm) | Capex ($mm) | Net YoY |
|---|---|---|---|---|---|
| 2025 | 683 | 711 | 867 | 9 | +287.9% |
| 2024 | -363 | -108 | -303 | 7 | +42.0% |
| 2023 | -627 | -158 | -440 | 28 | -12.1% |
| 2022 | -559 | -357 | -447 | 32 |
Note: Omitted columns lack sufficient annual XBRL coverage in the provided tags (need ≥2 annual points): Rev, Div, Buybacks. Source: SEC companyfacts cache [F1].
Capital returns and efficiency (annual)
| FY | FCF ($mm) | ROE% |
|---|---|---|
| 2025 | 702 | -332.5 |
| 2024 | -114 | 33.1 |
| 2023 | -187 | 76.6 |
| 2022 | -389 | 161.1 |
Source: SEC companyfacts cache [F1].
Note: Revenue data only available for last two years; Capex represents purchases of property, plant, and equipment.
Key growth drivers included:
- Market penetration of Sephience following European Commission marketing authorization (June '25) and FDA approval (July '25).
- Continued growth of Duchenne muscular dystrophy treatments Translarna and Emflaza.
- Upfront payment ($1 billion) plus milestones from Novartis related to the votoplam HD program.
- Recognition of regulatory milestone payments exceeding $150 million related to Censa-acquired sepiapterin programs [S19].
Financials Deep Dive
The shift from operating losses exceeding $300 million annually before FY2025 to an operating profit near $867 million reflects strong operational leverage tied to higher-margin collaborations and scaling product sales. Net income turned positive by nearly $1 billion year-over-year.
Operating cash flow rebounded strongly to over $700 million after multiple years of negative cash generation, supporting capital expenditures that remained modest at under $10 million annually.
Liquidity remains solid with nearly $1 billion held in cash and equivalents alongside a current ratio above the healthy threshold at approximately 2.35x. This liquidity provides financial flexibility amid contingent payment obligations arising from acquisitions [F1][S4][S24].
Segment and Geographic Insights
PTC operates within a single life sciences segment focused on rare disease therapeutics but maintains geographically diverse revenue streams. The United States accounted for roughly $252 million net product revenue in FY2025, with notable contributions from Russia ($100 million) and Brazil ($66 million). Distributor concentration risk exists as four distributors each accounted for over ten percent of product sales during the year [S9][S11].
Pipeline & Growth Prospects
Beyond marketed products supporting current cash flows, PTC advances pipeline candidates including sepiapterin-based therapies acquired via Censa targeting expanded indications for PKU treatment. Central nervous system-focused candidates such as vatiquinone represent promising opportunities given unmet medical needs but carry clinical development risk [S14].
Collaborations such as the Novartis agreement provide upfront capital injections alongside potential development milestones, regulatory milestones, sales milestones, profit/loss sharing arrangements, and tiered royalties tied to global commercialization success across multiple compounds including votoplam for Huntington’s disease.
Commercialization ramp-up for Sephience globally offers near-term growth potential while label expansions or additional indications across its portfolio could provide incremental upside.
Capital Allocation & Returns
No dividends or share repurchases were reported during the period indicating reinvestment into operations remains the primary use of capital currently. Stockholders’ equity remains negative due mainly to accumulated prior losses but improved substantially by approximately $804 million year-over-year entering FY2026 reflecting recent profitability trends [F1].
Return on equity is distorted by negative book value; however, the strong profitability improvement underscores foundational progress toward shareholder value creation if sustained.
Risks & Challenges
Material contingent payment obligations linked to acquisitions — notably Censa — represent significant future cash outflows subject to achievement of development milestones and sales thresholds totaling several hundred million dollars which could impact future earnings if realized [S10][S14]. Regulatory uncertainty around pipeline assets combined with competitive dynamics inherent in rare disease markets adds variability.
Concentration risk among distributors coupled with reliance on government pricing programs like Medicaid introduces complexity around accounts receivable management requiring sophisticated estimation processes [S10]. Cybersecurity vulnerabilities also pose operational risks given sensitive data environments.
What To Watch Going Forward
Investors should monitor quarterly updates on Sephience market penetration post-launch across geographies as well as clinical progress or regulatory filings related to CNS programs which may act as catalysts.
Further developments under Novartis collaboration including milestone receipts or adjustments to profit/loss sharing will significantly influence near-term financial performance. Updates on contingent payment schedules impacting liquidity or margin profiles warrant attention.
R&D expenditure trends balancing pipeline advancement against commercialization scale-up will be important indicators of sustainable profitability trajectories.
Conclusion
PTC Therapeutics emerged from multi-year losses into profitability in FY2025 driven principally by expanded product commercialization efforts combined with lucrative licensing arrangements supported by strategic acquisitions such as Censa. Strong liquidity alongside accelerating operating cash flow positions the company well to sustain investments into innovative rare disease therapeutics—a complex yet high-value niche.
Nonetheless, contingent liabilities triggered upon milestone achievements impose constraints requiring diligent execution paired with careful regulatory navigation. While uncertainties remain inherent in this dynamic sector, opportunities for clinical innovation underpin positive prospects.
This report is based solely on publicly available information up to February 20, 2026 including company filings and news reports without offering investment advice or recommendations.
Disclaimer: This is research-only, informational analysis and not investment advice. It may include AI-generated interpretation and general industry context. Always verify important details using primary sources.
Comments