
RadNet Accelerates Revenue Growth and Expands Digital Health Footprint in Q1 2026
Strong first-quarter performance reinforces RadNet’s leadership in outsourced outpatient diagnostic imaging services and AI-enabled radiology solutions.
RadNet reported notable revenue growth in Q1 2026 driven by higher volumes across commercial insurance and government payors, supported by its large network of 418 outpatient imaging centers. The company’s multi-modality service offering and expanding Digital Health segment, including AI-powered workflow tools, underpin its competitive moat. Challenges remain from reimbursement risks and capital intensity, but RadNet’s dense geographic presence and integrated service model position it well to capitalize on structural industry demand. Key upcoming milestones include continued deployment of AI products and monitored regulatory developments affecting Digital Health.
Latest Operating Update Highlights Expansion and Innovation
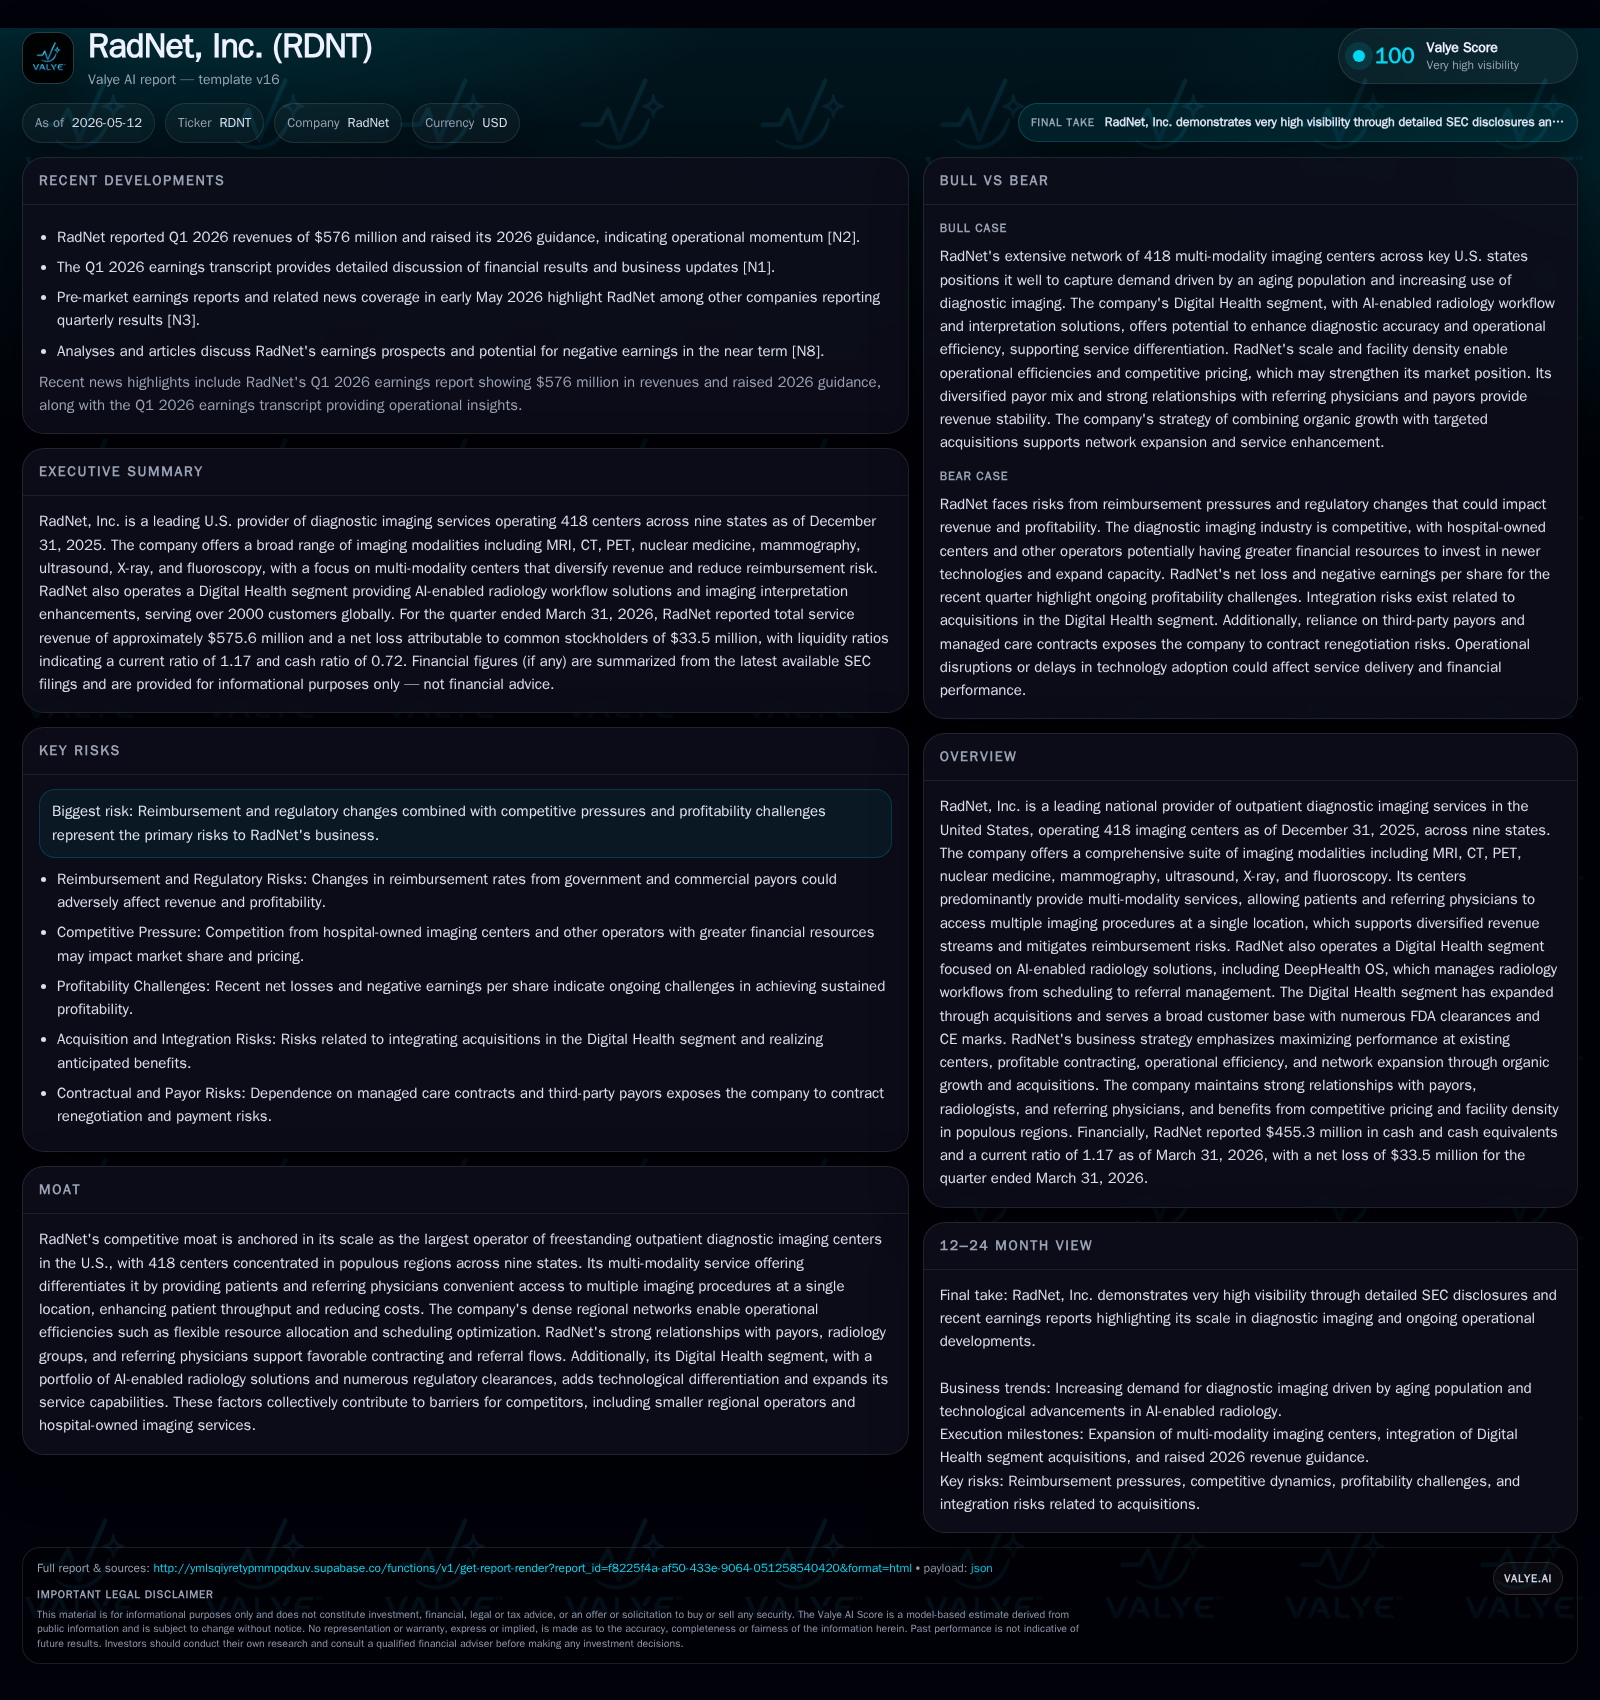
RadNet’s Q1 2026 earnings disclosure (filed May 11) reveals brisk revenue growth to $576 million, up 22% from Q1 2025 levels [S2]. This top-line acceleration was underpinned primarily by higher utilization from commercial insurance (+20% increase in collections) and Medicare (+27%), reflecting a favorable mix shift toward government payors alongside steady Medicaid growth. The company also saw gains in workers’ compensation/personal injury revenue streams. Revenue under capitation arrangements held relatively steady at around $30 million despite a slight decline year-over-year [S2].
A key operational highlight from the quarter is RadNet’s management fee structure arrangement whereby it provides full facility access—including advanced imaging equipment—to contracted medical groups responsible for professional services at the centers. This long-term contracting approach stabilizes capacity utilization and supports integrated care delivery across its outpatient locations [S2].
Additionally, RadNet updated that contingent consideration payments related to recent acquisitions are being managed carefully using Monte Carlo simulation valuation techniques accounting for revenue risk premiums and operational leverage—a sophisticated embedded derivative approach reflecting anticipated milestone achievements through FY2026 [S2][S25]. This shows management's forecast confidence combined with prudent financial oversight.
Business Model: Multi-Modality Imaging Network Anchored by Digital Innovation
RadNet’s business revolves around owning and operating an extensive network of freestanding outpatient diagnostic imaging centers—a leader based on location count and annual imaging revenue in the U.S. With 418 centers across nine populous states as of end-2025, RadNet leverages density to maximize patient throughput across multiple imaging technologies including magnetic resonance imaging (MRI), computed tomography (CT), positron emission tomography (PET), mammography, ultrasound, fluoroscopy, X-ray, nuclear medicine, among others [S1].
The multi-modality model is a core differentiator as it consolidates diverse diagnostic procedures at single sites, enhancing convenience for patients and efficiency for referring physicians. This helps diversify revenue streams while insulating the company from reimbursement pressure affecting any particular modality.
Integrated closely with its Imaging Centers segment is RadNet’s Digital Health segment—an innovation engine supplying AI-enhanced radiology solutions. Products like DeepHealth OS support radiology workflows from scheduling through interpretation and referrals, delivering a cloud-native orchestration layer for outpatient diagnostic lines. Strategic acquisitions including Aidence and Quantib have expanded the AI portfolio, which now holds various FDA clearances and CE marks primarily in breast, lung and prostate cancer screening support applications [S1].
This combination of physical infrastructure plus proprietary digital workflows creates synergies that sharpen RadNet’s competitive positioning against standalone centers or hospital-based providers limited by scope or scale.
Industry Structure and Competitive Positioning
The diagnostic imaging services industry has evolved into a mix of hospital-based inpatient offerings alongside growing freestanding outpatient providers like RadNet catering to ambulatory care demand shifts. Outpatient services benefit from rising preference due to cost-effectiveness and patient convenience.
RadNet’s leadership status derives largely from its scale—the largest national outpatient operator—and concentrated regional penetration which facilitates efficient capital deployment and operational flexibility. Their networks allow dynamic allocation of equipment usage hours and technologist staffing to meet fluctuating patient volumes without necessitating proportionate increases in fixed costs.
Additionally, RadNet maintains collaborative contracts with local radiology medical groups for professional supervision services rather than employing radiologists directly at most centers. This partnership approach reduces overhead complexity while ensuring clinical quality control aligned with regulatory requirements.
From a technology perspective, the integration of AI-powered decision support via the Digital Health segment differentiates RadNet further amid an increasingly data-driven industry landscape focused on reducing interpretive errors, workflow bottlenecks, and enabling scalable service line expansions.
Growth Drivers
RadNet’s growth path is built on several structural pillars:
- Increasing Utilization: Non-invasive imaging procedures continue gaining favor as cost-effective alternatives to invasive diagnostics or surgeries, driving secular volume growth across MRI, CT scans etc.
- Multi-Modality Conversion: Offering multiple imaging modalities per center boosts referrals within existing patient populations while enhancing convenience-driven market share gains.
- Payor Mix Optimization: Expanding enrollment coverage under commercial plans coupled with favorable reimbursements supports margin expansion potential.
- Digital Health Expansion: Scaling AI tool adoption beyond current markets into new regional geographies and healthcare systems broadens recurring SaaS-like revenue streams.
- Acquisitions & Network Growth: Selective additions of new centers deepen presence particularly in high-demand states maintaining disciplined capital deployment criteria per management commentary [S1][N2].
These factors together position RadNet well to harness ongoing healthcare delivery shifts emphasizing outpatient diagnostics integrated with digital health enablement.
Risks and Constraints
Notwithstanding its strategic strengths, RadNet faces several critical risks:
- Reimbursement Pressure: Changes in government payor policies (e.g., Medicare/Medicaid cuts) or private payer negotiations could compress pricing power threatening profitability.
- Regulatory Complexity: The evolving regulation over AI-enabled software as medical devices (SaMD) imposes compliance challenges; failure could trigger costly delays or product withdrawals [S7][S17].
- Capital Intensity: Equipment upgrades require significant capital investment; inability to efficiently finance capex could constrain growth or impair service quality.
- Legal/Litigation Exposure: Healthcare audit initiatives targeting fraud/abuse pose potential contingent liabilities impacting future earnings volatility.
- Economic Cyclicality: Broader macroeconomic downturns may lead patients to defer elective diagnostic tests reducing volume in economically sensitive segments [S1].
Careful navigation of these factors remains essential for sustainable value creation in RadNet’s capital-intensive domain.
What To Watch Next
Investors should monitor:
- Execution progress against contingent acquisition milestones tied to AI technology implementations scheduled through mid-2026 [S25].
- Volume trends segmented by modality and payor class updating shifts in demand patterns or price realizations disclosed quarterly.
- Regulatory guidance updates from FDA regarding compliance framework evolution for AI/ML-enabled radiology tools impacting product roadmap adjustments.
- Capital expenditure cadence aligned with new center openings or significant system refreshes providing insight into capacity expansion plans.
- Maintenance of favorable contracting terms with major insurance payors preserving stable reimbursement geometry amidst industry-wide pressure.
Continued quarterly disclosures will clarify how RadNet balances traditional diagnostic services expansion alongside disruptive digital health innovation.
Brief Financial Profile Contextualizing Operations
Latest financial snapshot
| Metric | Value | Period |
|---|---|---|
| Cash & equivalents | $455mm | |
| 2026-03-31 | ||
| Total debt | $1102mm | |
| 2025-12-31 | ||
| Net debt | $647mm | |
| 2025-12-31 | ||
| Current assets | $741mm | |
| 2026-03-31 | ||
| Current liabilities | $636mm | |
| 2026-03-31 | ||
| Current ratio | 1.17x | |
| 2026-03-31 |
Source: SEC companyfacts cache [F1].
As of March 31, 2026, RadNet held $455 million in cash against roughly $1.1 billion total debt positioning net debt near $647 million—indicative of moderate leverage consistent with its capital-intensive model. Current assets at $741 million versus current liabilities at $636 million translate to a current ratio of about 1.17 supporting near-term liquidity 3[F1][S2][S23]3.
First quarter operating results reflected robust income before taxation propelled by improving operating margins tied to higher volumes while expense discipline continues focusing on cost containment across centers. The ongoing sizable investments in digital health R&D are funded through this balanced cash flow profile although monitoring capex requirements remains germane given rapid equipment obsolescence cycles.[F1][S15]
This analysis is based exclusively on publicly available SEC filings dated through May 11, 2026, supplemented by reputable market news sources cited subsequently. It does not contain investment advice or forward-looking price assessments but provides an informed view into RadNet’s strategic positioning amid evolving outpatient diagnostic imaging dynamics.
Disclaimer: This is research-only, informational analysis and not investment advice. It may include AI-generated interpretation and general industry context. Always verify important details using primary sources.
Comments