
Rollins Inc Q1 Reveals Operational Stability Amid Liquidity Challenges
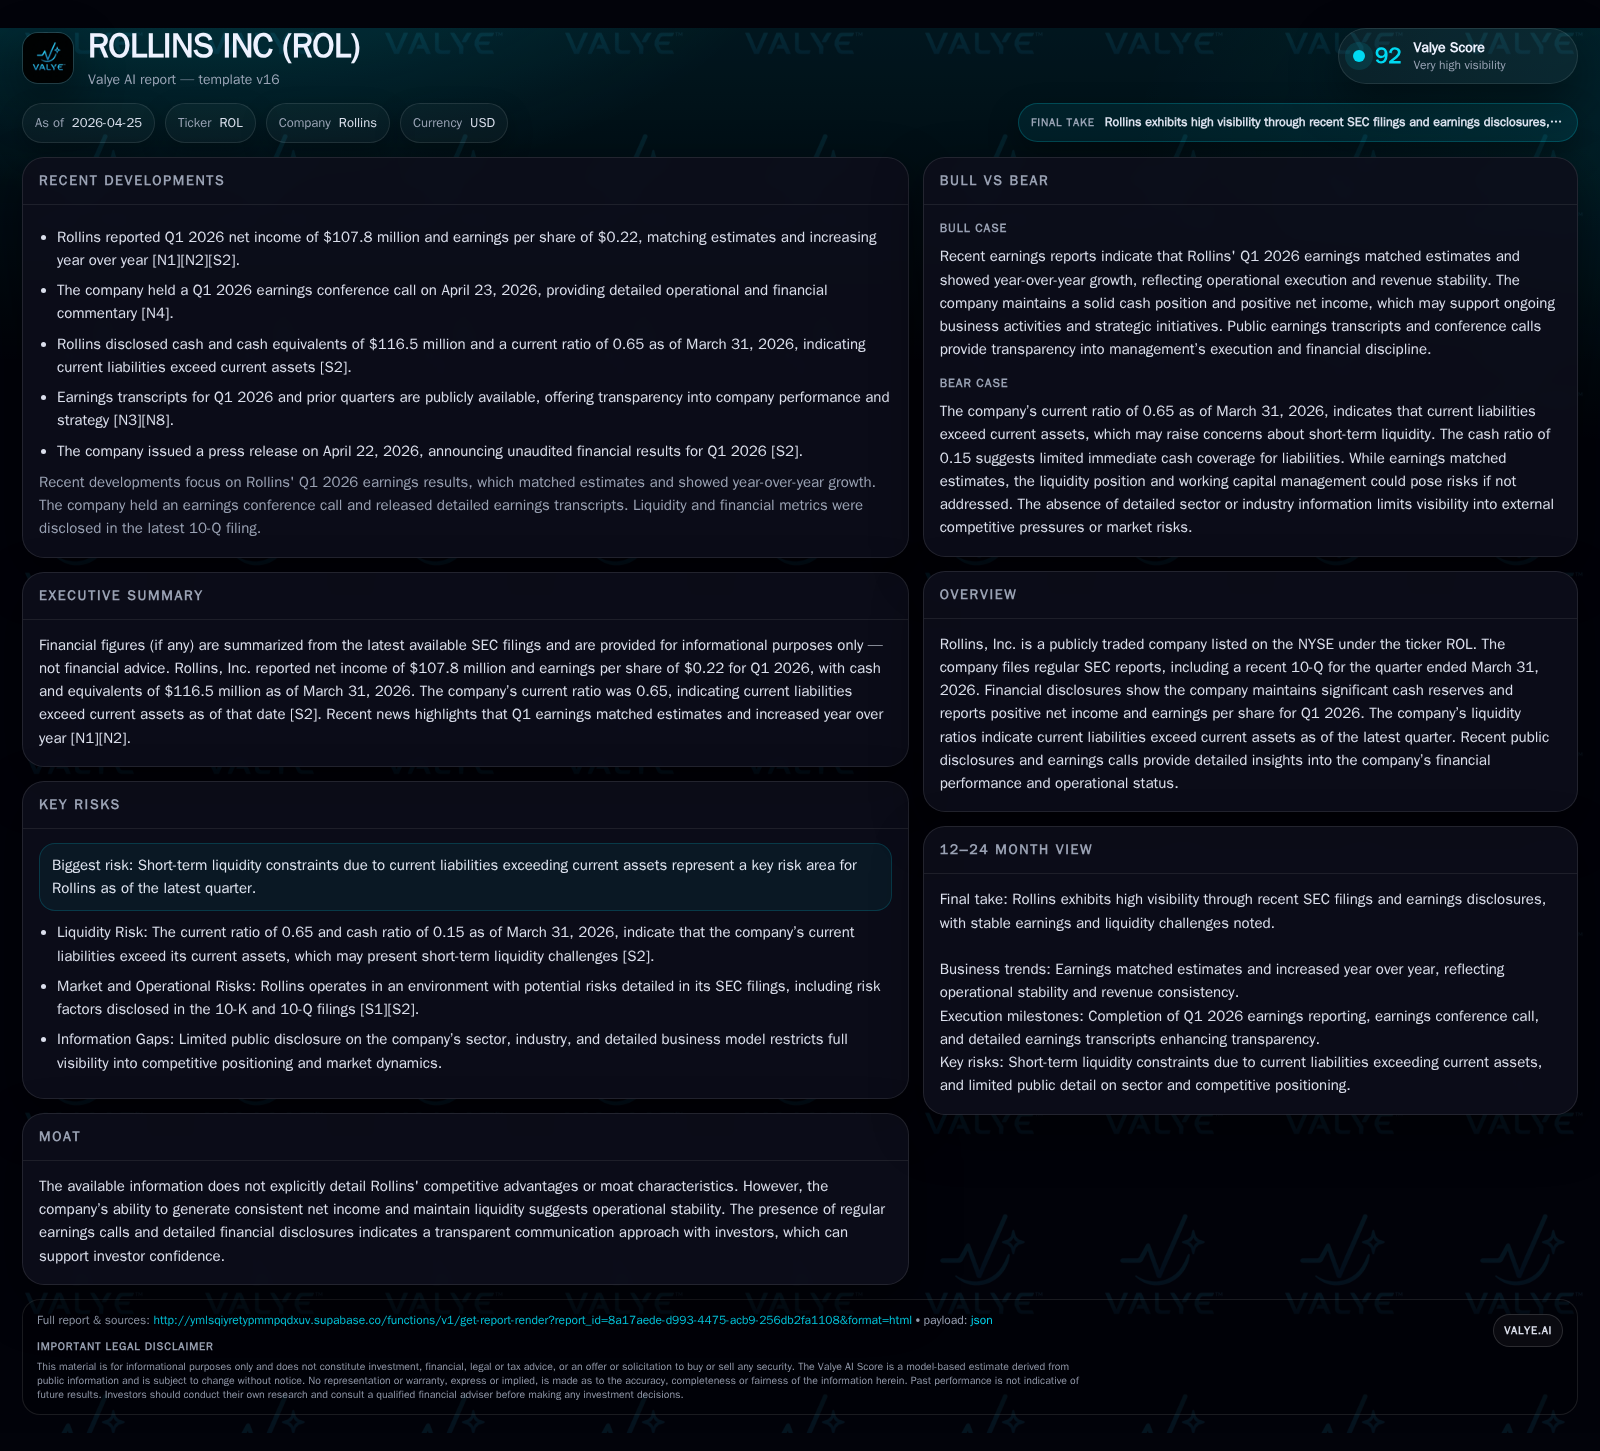
Rollins reported steady Q1 2026 earnings showcasing operational resilience while facing a liquidity ratio below one, signaling potential short-term financial constraints.
In its latest quarter ending March 31, 2026, Rollins Inc demonstrated consistent profitability and positive net income growth, affirming its stable business operations. However, its current liabilities notably exceed current assets, reflecting a current ratio of 0.65, which suggests liquidity pressures in the near term. The company's service-based pest control model underpins recurring revenue streams with strong customer retention, but balance sheet caution remains prudent as it manages financial flexibility. Key growth drivers include industry demand for integrated pest management and ongoing expansion strategies within a competitive environment marked by regulatory scrutiny and workforce challenges.
Q1 2026 Operating Highlights: What the Latest Filing Shows
Rollins Inc released its first-quarter earnings report for the period ended March 31, 2026, confirming a continuation of steady operational performance. The company reported positive net income growth relative to prior periods, underscoring consistent profitability within its service operations [S2],[N1],[N2]. However, a notable development in the quarter is the balance sheet dynamic where current liabilities of approximately $794.7 million exceed current assets of around $513.7 million, resulting in a current ratio of 0.65 [F1]. This liquidity configuration reflects a short-term financial constraint that management will need to address to maintain operational fluidity.
Operating cash flow trends aligned with historical patterns indicate efficient conversion of revenue into cash flows supportive of ongoing business needs [F1]. While no explicit new segment-level disparities emerged in this filing to materially alter the company's operating narrative [S4], the maintenance of revenue streams through contracts hints at service resilience. Additionally, recent event disclosures reaffirm confidence in execution without indicating immediate restructuring or capital raising actions to mitigate liquidity pressure [S3].
The interplay between solid profit generation and liquidity risk marks this quarter as critical for assessing near-term financial strategy alongside operational health.
Understanding Rollins’ Service-Centric Business Model and Value Proposition
Rollins operates primarily within the pest control industry, generating revenue from contract-based pest management services for residential and commercial customers [S1]. This model leverages long-term customer contracts underpinned by recurring monthly or annual fees which create sticky demand characteristics while enhancing predictability of cash flows.
Customer retention emerges as a key structural element due to service quality aspects such as thorough treatment delivery, responsiveness to pest issues, and adherence to environmental safety standards that influence client satisfaction and reduce churn rates [S1]. The company’s ability to maintain renewal rates supports sustainable pricing power despite competitive pricing pressures. Switching costs are implicitly embedded given the specialized nature of pest control services combined with service frequency and trust factors; these inhibit easy customer defection once contracts are established.
Product/service quality also benefits from ongoing investment in technician training and technology adoption including advancements in integrated pest management tools that improve treatment efficacy [S1]. Overall, Rollins’ business model aligns well with an ecosystem approach where its scale provides logistical advantages over smaller competitors.
Competitive Dynamics: Market Structure and Industry Positioning
The pest control industry is marked by moderate fragmentation with several regional players coexisting alongside national firms like Rollins [S1]. Regulatory oversight surrounding pesticide use imposes compliance costs and restricts operational flexibility which can act as a barrier to entry for less-capitalized competitors [S6]. Additionally, labor availability constraints affect capacity given the reliance on skilled service technicians whose recruitment and retention have become strategic challenges.
Rollins benefits from scale advantages enabling more efficient procurement of chemicals and equipment coupled with broader geographic reach that facilitates cross-selling opportunities among residential and commercial segments [S1]. Pricing sensitivity exists due to competitive pressures but is partially mitigated by brand reputation built through consistent execution. Capacity constraints may limit growth velocity unless offset by productivity improvements or acquisitions.
Market consolidation trends suggest some moat-like qualities for larger players yet no explicit network effects beyond scale are evident. Nonetheless, Rollins’ transparent reporting and established presence provide competitive stability.
Growth Catalysts and Headwinds Shaping Rollins’ Demand Trajectory
Key growth drivers include expanding residential housing markets requiring routine pest management along with increasing commercial facility maintenance standards elevating baseline demand levels [S1],[N3]. Technological advancements enhance treatment options expanding buyer preferences toward integrated approaches rather than reactive applications. The company pursues selective acquisitions that augment geographic footprint and service capabilities complementing organic growth initiatives.
On the downside, regulatory complexity continues to impose costs relating to chemical restrictions and environmental compliance which can pressure margins [S6]. Additionally, wage inflation amid technician labor shortages constrains capacity expansion unless offset through efficiency gains. Broader economic cycles influence discretionary spending propensity affecting contract renewals or new customer uptake — though pest control tends toward being more defensive than purely cyclical.
Customer behavior trends indicate stable retention but marginal sensitivity to pricing underscores the need for continued service enhancement to preserve margin quality.
Key Indicators and Upcoming Milestones to Monitor
Market participants should closely watch management commentary on renewal rate trends following Q1 results as these directly affect recurring revenue outlooks [N3]. Capital allocation decisions including dividend payouts and share repurchases require scrutiny given reduced liquidity ratios reported recently [S5],[S9]. Any regulatory developments or litigation outcomes related to pesticide use or environmental matters could prompt operating cost adjustments impacting profitability [S10].
Technician recruitment progress metrics also serve as bellwethers for operational scalability potentially affecting future revenue growth paths.
Financial Health and Capital Strategy in Focus
Historical performance (annual)
|
| FY | Net ($mm) | CFO ($mm) | OpInc ($mm) | Capex ($mm) | Net YoY |
|---|---|---|---|---|---|
| 2025 | 527 | 678 | 726 | 28 | +12.9% |
| 2024 | 466 | 608 | 657 | 28 | +7.2% |
| 2023 | 435 | 528 | 583 | 32 | +18.0% |
| 2022 | 369 | 466 | 493 | 31 |
Source: SEC companyfacts cache [F1].
Capital returns and efficiency (annual)
|
| FY | Div ($mm) | Buybacks ($mm) | FCF ($mm) |
|---|---|---|---|
| 2025 | 328 | 217 | 650 |
| 2024 | 298 | 12 | 580 |
| 2023 | 264 | 315 | 496 |
| 2022 | 212 | 7 | 435 |
Source: SEC companyfacts cache [F1].
From a financial perspective, Rollins reported approximately $116.5 million in cash and cash equivalents against total debt nearing $500 million as of March 31, 2026 [F1]. Net debt thus stands at roughly $383.5 million highlighting moderate leverage levels relative to equity base [$1.37 billion end-2025] [F1]. The firm’s current liabilities substantially exceed current assets ($794.7m vs $513.7m), resulting in a current ratio at 0.65 – a ratio signaling potential short-term liquidity stress that could constrain nimble working capital management or necessitate refinancing activities if prolonged [F1].
Operating cash flow has shown steady growth historically exceeding capex requirements by a significant margin ($678 million CFO vs ~$28 million capex FY2025), enabling free cash flow generation supportive of dividends ($328 million paid FY2025) and material share repurchases ($217 million FY2025) [F1],[S5],[S9].
| Fiscal Year | Revenue (USD bn) | Operating Income (USD m) | Net Income (USD m) | Operating Cash Flow (USD m) | Capex (USD m) | Dividends Paid (USD m) | Buybacks (USD m) |
|---|---|---|---|---|---|---|---|
| 2025 | 2.16 | 726 | 527 | 678 | 28 | 328 | 217 |
| 2024 | -- | 657 | 466 | 608 | 27 | 298 | 12 |
| 2023 | -- | 583 | 435 | 528 | 32 | 264 | 315 |
| 2022 | -- | 493 | 369 | 466 | 31 | -- | -- |
Overall, Rollins displays solid earnings power within a service-oriented model but faces tangible near-term liquidity constraints highlighted by working capital structural imbalances. Shareholder returns remain attractive though future capital allocation may pivot towards fortifying liquidity buffers unless operational efficiency offsets emerge swiftly.
This analysis focuses strictly on publicly available information drawn primarily from Rollins Inc's latest SEC filings through April 23, 2026 ([S2], [S3], [S1]) complemented by contemporaneous market reports ([N1]-[N3]) and companyfacts financial data ([F1]). It does not constitute investment advice but aims to deliver deep sectoral insights suitable for professional evaluation purposes.
Disclaimer: This is research-only, informational analysis and not investment advice. It may include AI-generated interpretation and general industry context. Always verify important details using primary sources.
Comments