
Ross Stores Capitalizes on Robust Q1 Growth to Accelerate Expansion
Strong Q1 sales and margin expansion underscore Ross Stores' leadership in off-price retail, driven by strategic store growth and merchandising excellence.
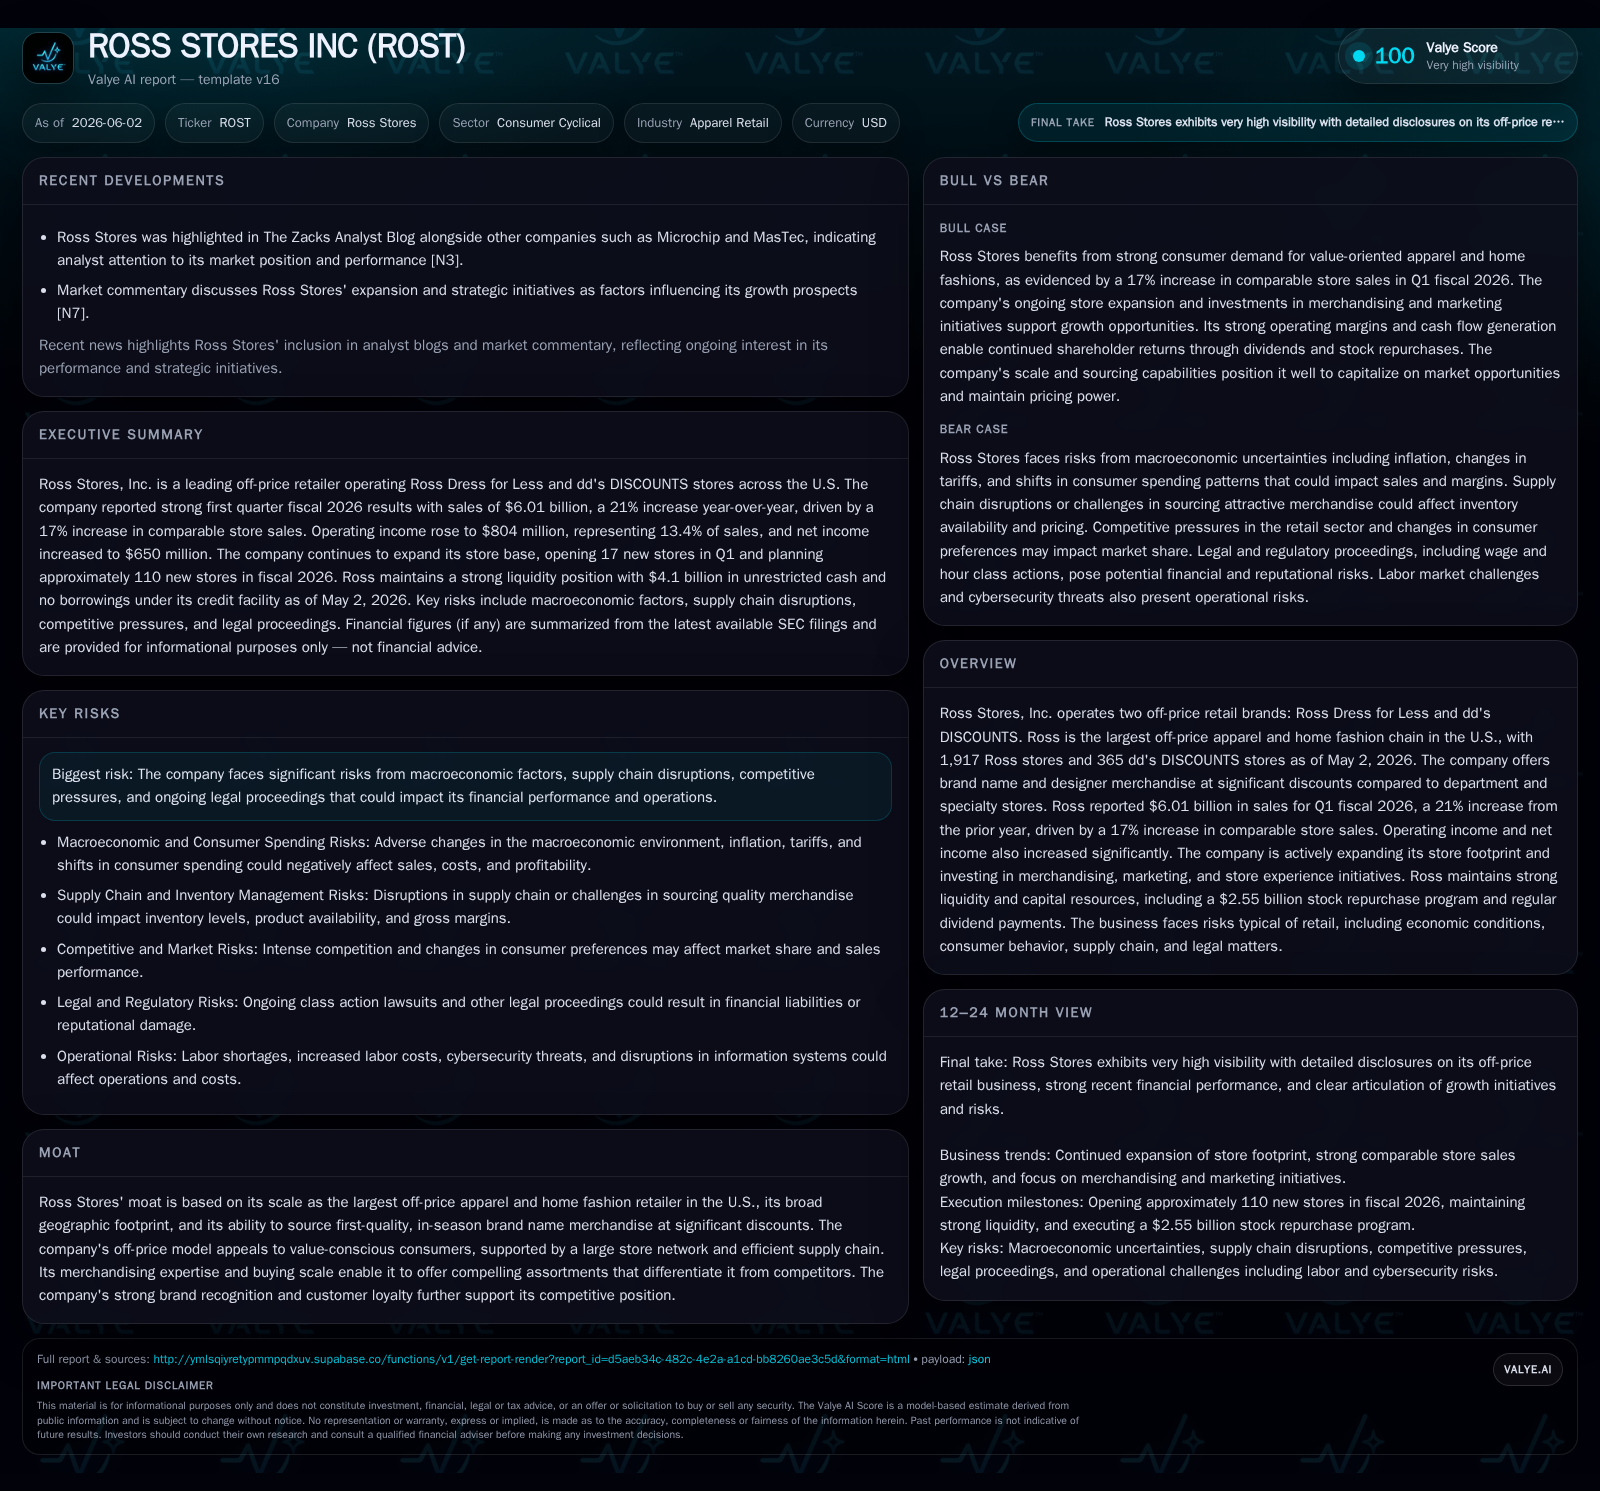
In Q1 fiscal 2026, Ross Stores reported a significant 21% sales increase propelled by a 17% comparable store sales gain and expanding operating margin from 12.2% to 13.4%. The dual-brand off-price model, including Ross Dress for Less and dd's DISCOUNTS, continues to attract value-seeking consumers through broad assortments and competitive pricing. Strategic initiatives focusing on merchandising, marketing, and store experience improvements alongside an aggressive store expansion plan support a positive growth trajectory. While structural economic uncertainties and ongoing legal exposures remain as watchpoints, strong liquidity and a robust $2.55 billion stock repurchase program buttress shareholder returns and financial flexibility.
Q1 FY26 Results Highlight Robust Top-Line and Operating Margin Expansion
Ross Stores delivered a standout first quarter performance for fiscal year 2026 with total sales reaching $6.01 billion—a material 21% improvement over the prior-year period [S2]. This growth was powered chiefly by an impressive 17% lift in comparable store sales (comps), itself underpinned by an approximate 11% increase in shopper traffic combined with a 6% rise in average basket size [S14]. Operating income rose sharply to $804 million (up from $606 million), driving operating margin to an expanded 13.4% from 12.2% the previous year [S2]. This margin gain reflects enhanced merchandise gross margins due to product mix optimization plus efficiency gains in occupancy and distribution costs [S14]. Net income climbed to $650 million, fueling a robust diluted EPS advance to $2.02 from $1.47 year-over-year aided further by sustained stock repurchases reducing share count [S2],[S14]. These results confirm both the health of the company's value-oriented off-price proposition amid evolving macro conditions and the early payoff from recent strategic investments.
Dual-Brand Off-Price Retail Model: Value Proposition and Merchandising Advantage
Ross operates two complementary off-price retail brands: Ross Dress for Less® (the larger format) with nearly 1,917 stores across 44 states plus territories; and dd’s DISCOUNTS® with 365 stores focused on slightly lower price points primarily in southern states [S2]. Both brands feature first-quality, in-season branded apparel, footwear, accessories, and home fashions sold at discounts ranging generally from 20% to as much as 70% relative to department or specialty retailers [S1],[S2]. This dual-brand approach enables Ross Stores to capture broader customer segments within the value-conscious consumer market—from mainstream bargain hunters via Ross Dress for Less to more price-sensitive shoppers served by dd’s DISCOUNTS.
Merchandising strength derives from the company’s extensive scale buying power and sophisticated vendor relationships that allow it to source compelling national brands typically still in season at substantial cost savings [S1]. This unique sourcing capability combined with high inventory turnover levels supports consistent fresh assortments that drive repeat visits while maintaining competitive price points versus traditional discount or department stores. The strategy aligns well with growing consumer preference shifts favoring value-price points amid economic uncertainty.
Competitive Landscape: Ross’s Position as Largest U.S. Off-Price Apparel Chain
Within the highly fragmented off-price apparel retail sector, Ross Stores stands out as the largest U.S.-based operator by store count and geographic coverage—operating nearly twice as many off-price locations as key peer TJX Companies [N10] while outpacing other discount general merchandisers like Dollar General or Burlington who focus less exclusively on branded apparel assortments [N1][N3]. This scale confers advantages in vendor leverage enabling superior buying terms and broader assortment diversity.
Ross also benefits from a largely brick-and-mortar format optimized for treasure-hunt shopping experiences favored by its core customers but complemented increasingly by digital marketing efforts aimed at stimulating store traffic—notably without reliance on costly e-commerce fulfillment channels that often weigh on margins industry-wide.
Key Growth Drivers: Store Expansion, Merchandising Enhancements, and Marketing Initiatives
Ross remains committed to expanding its physical footprint as a principal growth engine; during Q1 FY26 it opened 17 new stores (13 Ross Dress for Less locations plus four dd’s DISCOUNTS), with plans confirmed for approximately 110 new openings in FY26 [S2][S17]. Notable is its focus on rigorous market analysis evaluating local demographics, competition level, expected profitability potential, and overhead leverage opportunities prior to each site addition—balancing aggressive rollout ambitions against maintaining strong ROI profiles.
Parallel growth initiatives strengthen merchandising breadth—delivering more brands timely with broader assortments—and elevation of marketing capabilities focused on increasing new customer acquisition rates alongside deeper engagement of existing shoppers through targeted campaigns [S2][N8]. Moreover, incremental improvements to the in-store shopping environment aim to enhance customer convenience and experience which could underpin improved retention metrics.
Risks to Monitor: Macroeconomic Sensitivity, Supply Chain, and Litigation Exposure
Despite strong near-term performance drivers, Ross is not immune to common retail risks highlighted in its filings including macroeconomic uncertainties such as inflationary pressures impacting both consumer discretionary spending behavior and input costs [S10][S18]. Its heavy reliance on Chinese-origin merchandise (over half of all goods sourced) subjects it especially to tariff volatility or supply chain disruptions stemming from geopolitical tensions or regulatory changes [S25][S26].
Human capital factors including wage inflation or labor shortages could raise operational costs given retail selling expense sensitivity.
Class action wage-and-hour litigations primarily in California pose legal risks; although management currently assesses these as non-material financially they remain ongoing matters warranting attention [S1][S10]. Cybersecurity threats also represent latent operational risks given dependence on IT infrastructure.
Looking Ahead: Strategic Milestones and Execution Watchpoints for FY26
Investors should track quarterly comp sales trends closely as continued positive trajectory will validate execution of merchandising refreshes and marketing acceleration efforts outlined [S5]. Successful integration of approximately 110 planned new stores this fiscal year represents a meaningful lever supporting incremental revenue gains given proven unit economics.
Inventory management effectiveness during seasonal peaks remains crucial given the off-price model’s reliance on fresh assortment allure balanced against markdown discipline.
Capital allocation priorities highlight the freshly approved $2.55 billion stock repurchase authorization active through January 2028 which supports EPS accretion synergy alongside dividend payments elevated recently to $0.4450 per share quarterly—reflecting confidence in cash flow generation capacity [S6][S1]. Meanwhile management will continue to monitor broader macro headwinds with agility.
Financial Profile Snapshot
This analysis is based solely on publicly filed regulatory documents and relevant market context. It does not constitute investment advice or research views. Readers should interpret findings within current economic frameworks recognizing inherent risks detailed herein.
Disclaimer: This is research-only, informational analysis and not investment advice. It may include AI-generated interpretation and general industry context. Always verify important details using primary sources.

Comments