
Rapid7’s 2025 Turn to Profitability Highlights Tradeoffs in Growth and Platform Consolidation
After years of losses, Rapid7 reported net income in 2025 but faces margin pressures amid strategic investments in integrated SecOps platforms.
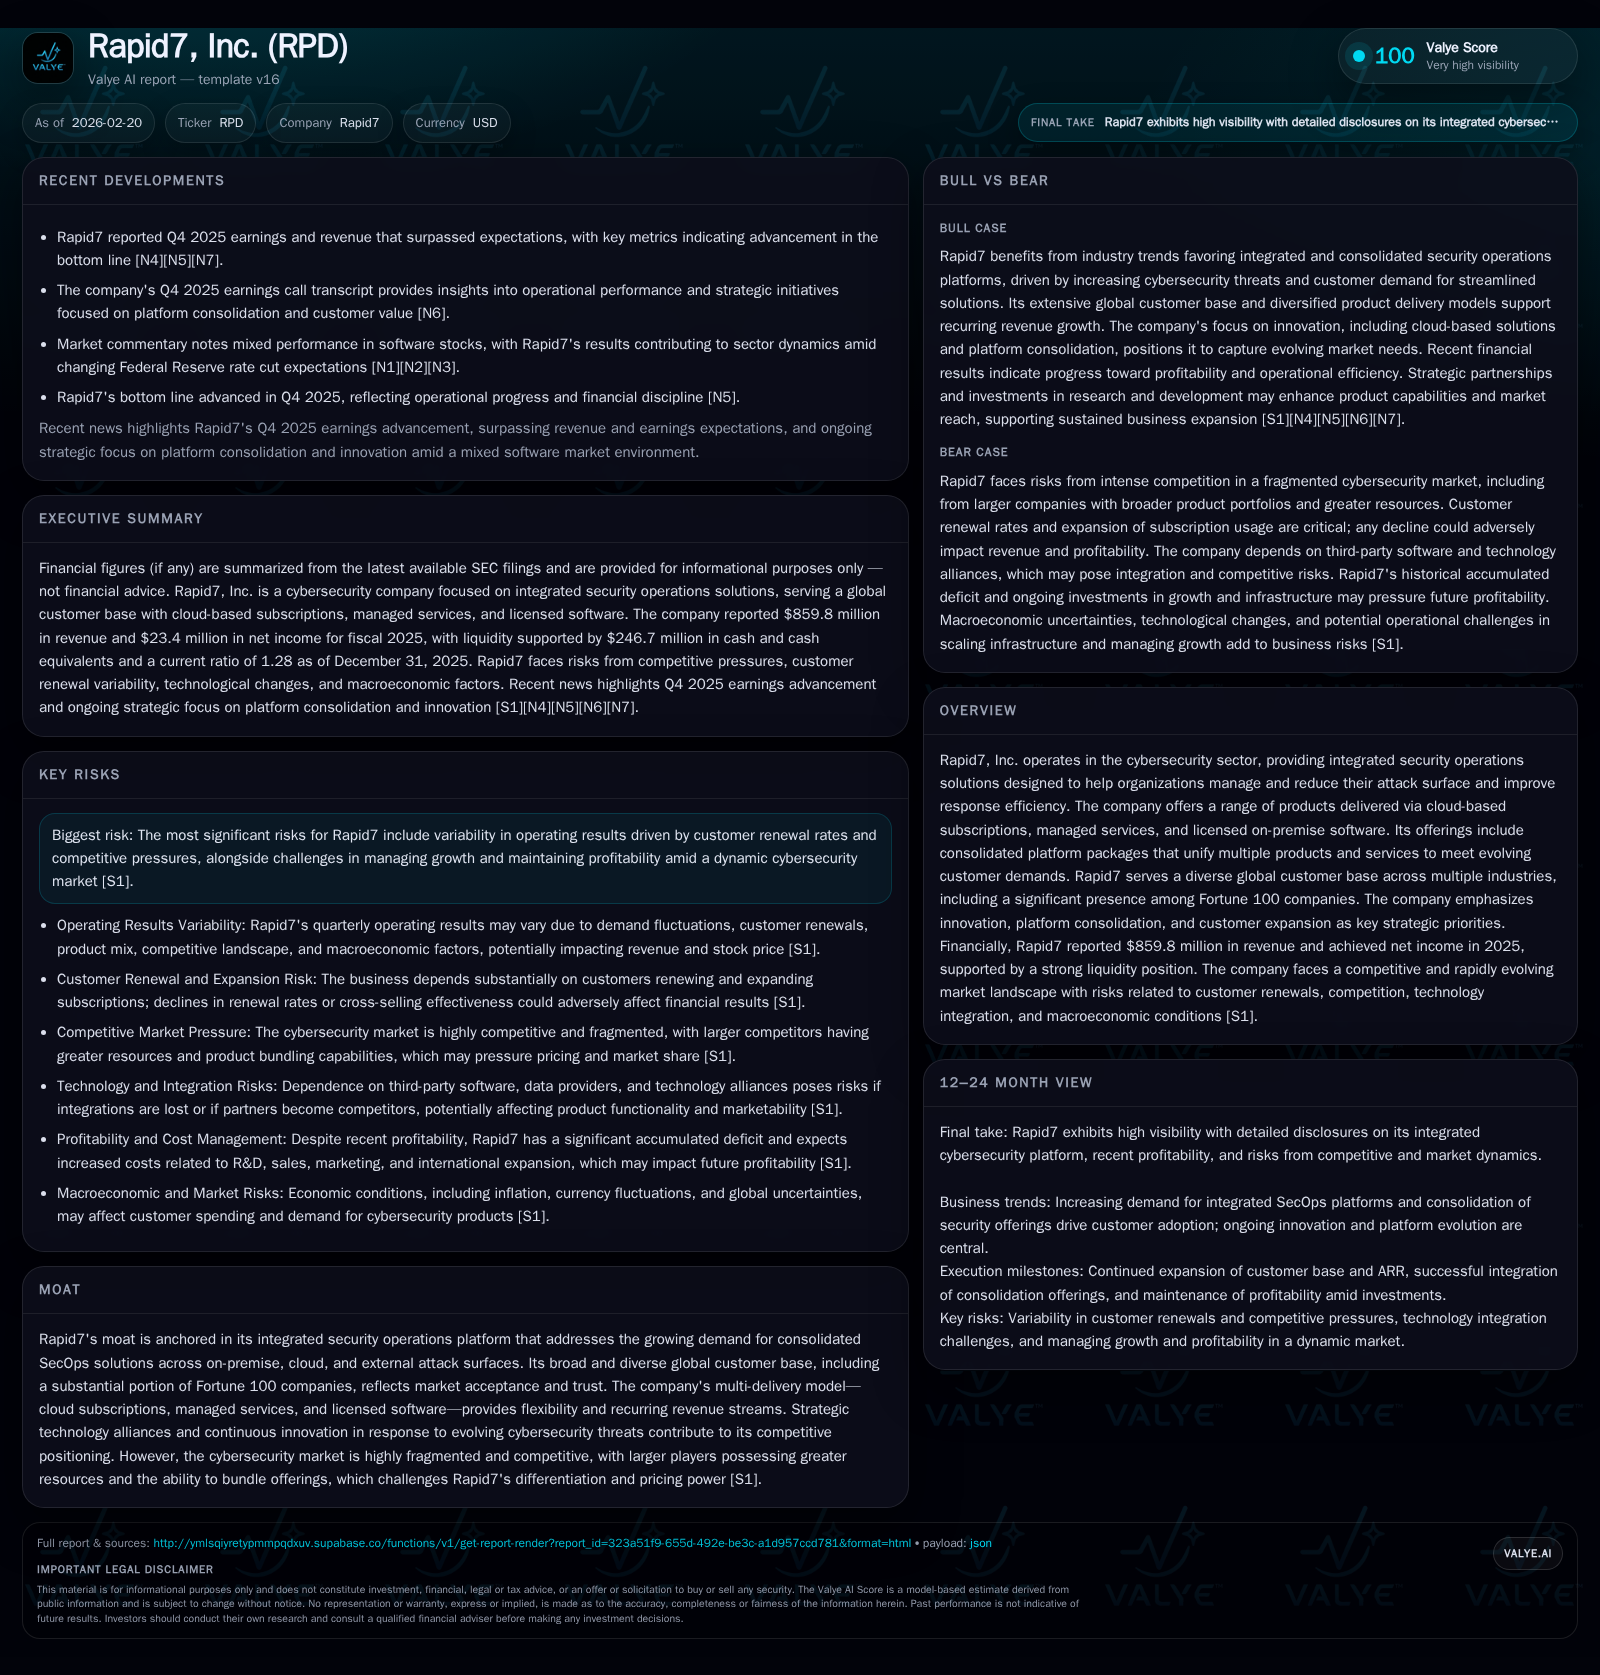
Rapid7, Inc. marked a critical inflection in 2025 by turning profitable with a net income of $23.4 million on $860 million revenue, driven by customer expansion and a shift towards consolidated cloud security platforms. The company’s growth trajectory is influenced by the ongoing industry move towards integrated SecOps tools covering on-premise, cloud, and external attack surfaces. While recurring revenues remain high at 96%, margin compression and operating expense increases reflect investments in R&D and sales to strengthen product innovation and market positioning. Rapid7’s liquidity remains solid with over $650 million in cash and investments, supporting continued capital deployment amidst competitive market dynamics.
Company Overview and Historical Performance
Rapid7 operates in the cybersecurity sector focused on delivering integrated security operations (SecOps) solutions that help organizations reduce their attack surface and improve response efficiency. Its portfolio spans cloud-based subscriptions, managed services, and licensed on-premise software products. The company has strategically moved toward consolidating disparate security tools into comprehensive SecOps platforms addressing on-premise, cloud, and external threats — a transition fueled by customer demand for simpler, integrated security environments [S8][S11].
Financially, Rapid7 demonstrated substantial growth over recent years with revenues expanding from approximately $326.9 million in 2019 to nearly $859.8 million in 2025 (see Table below). This represents an aggregate CAGR near mid-teens over the six-year period.
Historical performance (annual)
| FY | Net ($mm) | CFO ($mm) | OpInc ($mm) | Capex ($mm) | Net YoY |
|---|---|---|---|---|---|
| 2025 | 23 | 154 | 12 | 8 | -8.4% |
| 2024 | 26 | 172 | 35 | 3 | +117.1% |
| 2023 | -149 | 104 | -81 | 4 | -19.7% |
| 2022 | -125 | 78 | -112 | 20 |
Note: Omitted columns lack sufficient annual XBRL coverage in the provided tags (need ≥2 annual points): Rev, Div, Buybacks. Source: SEC companyfacts cache [F1].
Capital returns and efficiency (annual)
| FY | FCF ($mm) | ROE% |
|---|---|---|
| 2025 | 146 | 15.1 |
| 2024 | 168 | 144.1 |
| 2023 | 100 | 126.3 |
| 2022 | 58 | 103.9 |
Source: SEC companyfacts cache [F1].
*Note: Operating income (OpInc) turned positive only recently after sustained losses; CFO = net cash provided by operating activities; Capex = capital expenditures.
This growth leveraged rapid adoption of cloud subscriptions alongside complementary managed services and licensed software solutions providing recurring revenue streams consistently representing about 96% of total revenues since at least FY2023 [S18][S21]. Despite top-line expansion, profitability remained elusive until a breakthrough year in FY2025 when Rapid7 reported positive net income for the first time.
Drivers Behind Past Performance
Customer Expansion: Rapid7’s penetration into diverse sectors including technology, energy, financial services, healthcare, manufacturing, media/entertainment, government, and education contributed to steady ARR growth (~$840M as of Dec '25) [S21]. The inclusion of over one-third of Fortune 100 companies reflects strong enterprise acceptance.
Platform Consolidation Trend: The industry-wide push toward consolidating multiple cybersecurity functions into integrated platforms helped accelerate demand for Rapid7’s unified SecOps offerings such as Threat Complete and Cloud Risk Complete packages [S8][S18].
Recurring Revenue Model: By emphasizing subscription-based cloud products supplemented with managed offerings and content subscriptions alongside term licenses, Rapid7 maintained high-quality predictable revenue streams enhancing financial visibility.
Operational Investments: Increased R&D spending—up by roughly +10% year-over-year—aimed at continuous innovation to address emerging threat landscapes while sales & marketing investments fueled customer acquisition efforts globally [S23].
Future Growth Prospects: Opportunities & Constraints
Growth Catalysts:
Integrated SecOps Demand: As customers seek seamless security across hybrid environments (on-prem/cloud/external), Rapid7’s strategy to lead with an extensible platform positions it well to capture increasing wallet share [S8].
Expanding Managed Services: Managed detection & response along with application security services offer higher-margin upsell potential helping deepen client relationships.
Technology Innovation: Continued investment in AI-enabled threat intelligence and automation aligns with evolving enterprise needs to handle complex attacks efficiently.
Geographic Expansion: International markets represent significant runway given increasing global cybersecurity budgets coupled with evolving regulatory landscapes requiring enhanced protections.
Constraints:
Competitive Intensity: Large incumbents with broader product suites can exert pricing pressure; market fragmentation complicates differentiation [S1][S25].
Customer Renewal Variability: Dependence on high renewal rates (~annual contracts) makes results sensitive to macroeconomic or customer-specific budget constraints [S1].
Integration Complexity: Platform consolidation requires maintaining high service quality; any disruption could impair reputation or renewals [S25].
Capex Commitments: Multi-year commitments notably include a cloud-services agreement totaling $660 million over five years necessitating disciplined capital allocation [S15].
Financial Expectations & Milestones To Monitor
Explicit guidance was not disclosed; however analysts focus on key metrics such as ARR growth rate stability around or above current levels (~$840M), operating margin improvement potential following prior cost investments, and free cash flow trends reflecting operational leverage [N1][N2][F1]. Achieving sustained profitability beyond one-off gains is critical given past volatility.
Watch for:
- Trajectory of annual recurring revenue amid economic cycles;
- Gross margin fluctuations tied to product mix shifts between cloud/managed/on-prem offerings;
- Operating expense control balancing R&D innovation vs sales expansion needs;
- Customer churn rates impacting deferred revenue recognition patterns;
- Impact from AI-driven competitive innovations introduced by peers.
Returns & Capital Allocation Profile
Rapid7 turned a corner reporting net income of $23.4 million in FY2025 compared to losses previously despite modest operating income ($11.6M). Calculated ROE based on year-end equity is approximately 15%, indicating improving capital efficiency post-turnaround [F1].
Free cash flow generation remains robust at around $146 million (CFO minus capex), bolstered by healthy operating cash conversion though capex increased notably (+122%) primarily reflecting investments in computer equipment/software supporting scaled cloud infrastructure [F1][S14][S26]. Dividend payments are currently unavailable indicating retained earnings are reinvested for growth initiatives; no recent buybacks were reported.
Liquidity is ample with close to $660 million in combined cash and short-term investments absent debt draws from the revolving credit facility offering financial flexibility while managing maturity risks surrounding convertible notes due within next few years [S4][S6][S9].
Sector-Native Context: SecOps Platform Consolidation Dynamics
The cybersecurity sector is seeing accelerated consolidation within Security Operations Centers as enterprises seek simplified governance over increasingly hybrid environments spanning assets on-premises but also distributed clouds plus external internet-facing exposures such as SaaS ecosystems or third-party integrations . This trend pressures vendors like Rapid7 to innovate beyond standalone vulnerability management or threat detection into holistic platforms delivering correlation across risk vectors coupled with managed expertise.
Additionally important is underlying cost efficiency metrics such as declining IT overhead per secured asset unit due to scale effects — an emerging battleground between competitors involving not just software capabilities but also service delivery excellence ensuring frictionless user experience under tight SLAs.
Conclusion
Rapid7's financial inflection from losses to profitability underscores its progress executing a vision centered on integrated SecOps platform leadership amid disruptive industry shifts toward consolidated cybersecurity tooling delivered as SaaS or managed services globally.[F1][N2][S1] While growth prospects remain attractive driven by diversification across customer types and geographies alongside high recurring revenue ratios (~96%), challenges persist including competitive intensity from larger rivals capable of bundling offerings at scale plus need for continued investments balancing innovation against margin improvement. Close monitoring of ARR trends, gross margins amid product mix changes, churn rates, renewal dynamics alongside free cash flow health will provide meaningful direction for assessing the sustainability of this newfound profit trajectory.
Disclaimer: This analysis is for informational purposes only based on publicly available data through February 20, 2026; it does not constitute investment advice or recommendations.
Disclaimer: This is research-only, informational analysis and not investment advice. It may include AI-generated interpretation and general industry context. Always verify important details using primary sources.
Comments