
Rush Enterprises Strengthens Aftermarket Focus Amid New Vehicle Sales Pressure
Q2 2026 highlights reinforce Rush Enterprises’ reliance on aftermarket services to offset new vehicle sales margin compression.
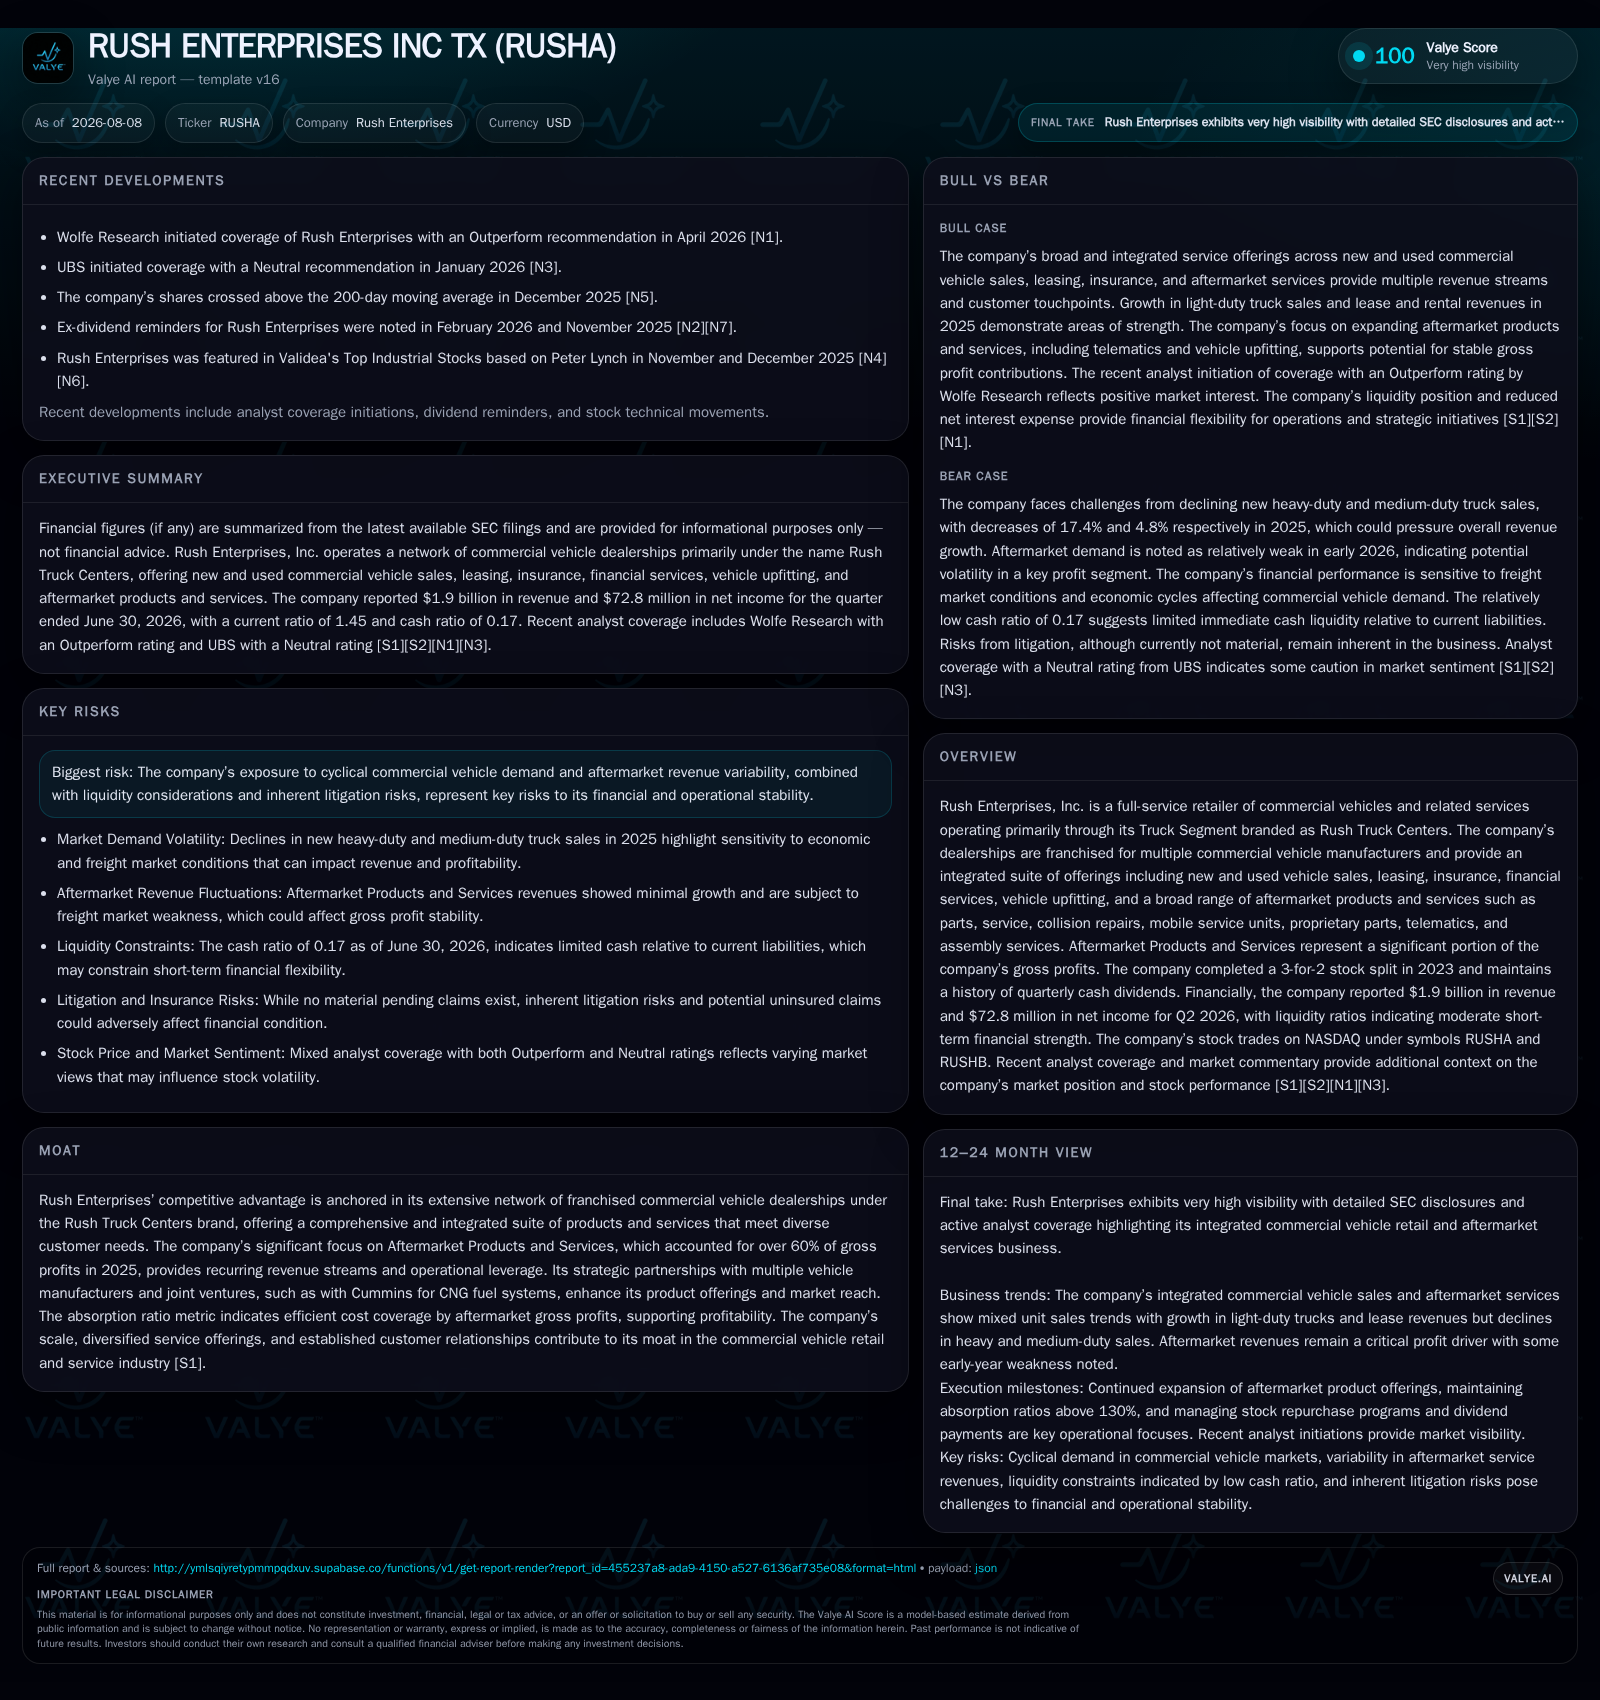
Rush Enterprises reported $1.9 billion in revenue and $72.8 million in net income for Q2 2026, maintaining a sizable aftermarket business that contributes majority of gross profits. The company faces margin headwinds from softer used vehicle sales and leasing segments due to shifts in customer mix and lower rental utilization, but its broad franchised dealership network and integrated service offerings under Rush Truck Centers support operational resilience. Key risks remain around OEM dependency, commercial vehicle cyclicality, and inventory management, while growth opportunities include fleet replacement cycles and regulatory-driven upfitting demand.
Recent Operating Update
Rush Enterprises reported second-quarter 2026 revenues totaling approximately $1.9 billion with net income of $72.8 million [S2]. These figures confirm continued scale in its core Truck Segment branded as Rush Truck Centers, which operates franchised dealerships for major commercial vehicle manufacturers such as Peterbilt (a PACCAR division) and International Motors. While top-line revenue remained relatively stable quarter-over-quarter, the company faced margin pressures particularly in used commercial vehicle sales and lease/rental operations due to changes in customer mix favoring lower-margin wholesale transactions and diminished rental utilization rates [S2],[S1]. This dynamic points to the structural challenge of balancing volume with profitable customer segments in cyclical markets.
An event filing dated August 6, 2026 detailed contractual amendments related to lease and rental credit facilities supporting the lease fleet operations, underscoring ongoing management attention on optimizing financing flexibility for these capital-intensive services [S3]. There was no material change to previously disclosed risk factors as per the Q2 filing, implying continuity in operational risks such as OEM supply dependencies and commercial freight demand variability [S2].
Business Model Overview
Rush Enterprises operates primarily as a full-service franchised commercial vehicle retailer with expansive service integration across its Rush Truck Centers network. Revenue is generated through multiple streams: new and used truck sales; leasing and rental offerings; aftermarket products including parts supply, collision repair, maintenance services; vehicle upfitting; as well as insurance and financial services tailored to fleet customers [S1]. This integrated approach mitigates typical volatility associated with new truck sales cycles by leveraging recurring aftermarket parts and service margins which historically contribute over 60% of the company’s gross profits — a critical buffer smoothing earnings across economic cycles.
The company's strong dependence on marquee OEM partnerships is central to its commercial viability. Franchise agreements with Peterbilt (PACCAR) trucks and parts supply dominate revenues alongside significant contributions from International trucks and IC Bus by International Motors. These relationships provide non-exclusive access to high-quality product lines but expose Rush Enterprises to risks around OEM production volume fluctuations, pricing policies, product innovation cycles, emissions compliance mandates, and potential dealership agreement terminations especially tied to ownership or control changes at PACCAR or International Motors [S1]
Revenue recognition connects directly to unit volumes sold or leased; price realizations depend heavily on OEM pricing strategies plus negotiated discounts or incentives linked to fleet size customers. Used vehicles cater both wholesale buyers (with lower margins) and retail customers (higher margins), making mix changes impactful on profitability. Leasing revenue continuity is sensitive to rental utilization rates—a falloff here depresses the already thin margin structure typical in these offerings.
Operationally, Rush Enterprises invests significantly in service bay capacity utilization via mobile repair units and telematics solutions aimed at maximizing fleet uptime for clients—a value proposition aligned with increasing truck technology complexity. Complementary insurance and financing products deepen client engagement while enabling more predictable cash flows.
Industry Structure and Competitive Position
The commercial vehicle retail sector comprises franchised dealerships that serve as vital intermediaries between OEM manufacturers—who produce trucks subject to stringent emissions regulations—and end-user fleets primarily consisting of logistics companies, over-the-road carriers, municipal agencies, and construction firms. Competitors range from other large publicly traded dealership groups coupled with independent service providers offering aftermarket parts or specialized upfitting solutions.
Rush Enterprises competes through scale—operating a broad geographic footprint covering multiple U.S. regions—which supports substantial inventory holdings of new vehicles consistent with dealer agreements as well as a robust installed base for parts distribution and maintenance work. Its integrated suite of offerings including collision repair centers and comprehensive finance/insurance capabilities distinguishes it from smaller independent shops focused solely on one service line.
Peer groups such as PACCAR-owned dealerships or Penske Automotive Group’s truck divisions similarly emphasize high-margin aftermarket contributions combined with trading economies across new vehicle inventory. Success hinges on managing inventory turnover efficiently without excessive aging of trucks or parts stock that tie up working capital while facing demand cyclicality tied closely to freight demand trends.
Growth Drivers
Several secular trends support steady growth for Rush Enterprises’ platform:
- Fleet Replacement Cycles: Aging trucking fleets mandate periodic renewal driven by total cost-of-ownership considerations like fuel efficiency improvements and maintenance cost containment.
- Regulatory Compliance: Ongoing emission standards necessitate retrofitting or replacing older models; regulatory mandates also stimulate demand for specialized upfitting services designed to meet safety or environmental protocols.
- Aftermarket Expansion: Increasing sophistication of commercial vehicles featuring telematics requires expert servicing increasing parts consumption especially for connected systems.
- Leasing & Rental Demand: Growing preference among fleets for flexible lease arrangements rather than outright purchases stabilizes revenue streams despite economic swings.
- OEM Partnerships: Strategic agreements like joint ventures with Cummins on CNG fuel systems enhance product breadth aligning with eco-conscious fleet operators.
These drivers translate into key performance indicators such as absorption ratio improvements reflecting better coverage of fixed costs via strengthened aftermarket margins; higher service bay utilization rates signaling effective resource deployment; stable or growing lease utilization revealing efficient capital use; plus expanding parts gross profit shares bolstering overall margins.
Risks / Watchpoints
Rush Enterprises faces inherent business risks reflective of its industry position:
- Cyclical Commercial Vehicle Demand: Freight activity closely tracks macroeconomic conditions; downturns reduce new truck orders causing pressure on dealers' top line.
- OEM Dependency: Reliance on Peterbilt (PACCAR) and International Motors limits pricing power while exposing company to supplier production constraints or shifts in franchise relationship terms.
- Margin Compression: Shifts toward lower-margin wholesale used vehicles or softening rental utilization rates threaten profitability.
- Inventory Management: Holding substantial inventories increases exposure to aging stock losses amid changing model specifications or technological obsolescence.
- Financial Exposure: Capital-intensive nature requires careful liquidity management given large dealership footprints requiring facility maintenance capex.
- Litigation / Product Liability: Operational claims can impact earnings despite insurance coverage due to residual uninsured exposures [S1].
- Regulatory Changes: Emissions standards evolution can necessitate sudden operational adjustments impacting stock levels or service capabilities.
Monitoring KPIs like lease/rental utilization rates monthly can provide early warnings on margin trends while tracking OEM delivery schedules aids inventory planning precision.
What to Watch Next
Earnings announcements beyond Q2 2026 should clarify if used vehicle margin trends stabilize within the guided range (11%–16%) amid current wholesale/retail customer mix shifts [S1]. Lease/rental gross margin trajectory will hinge on rental fleet uptime metrics that management can influence through investments in mobile maintenance units deployed during this period.
The execution progress on joint ventures related to alternative fuel technologies—such as Cummins CNG systems—and their associated revenue contribution will be important indicators of forward-looking competitive differentiation [N3]
Further amendments or refinements on credit agreements (as noted recently) may signal evolving capital needs tied to lease fleet expansion or refinancing strategies impacting liquidity profiles.
Finally, any developments in PACCAR or International Motors corporate governance influencing dealership agreements could materially affect Rush’s supply chain security—an area requiring close stakeholder monitoring.
Financial Profile Discussion
As of June 30, 2026, Rush Enterprises reported cash & equivalents of approximately $265 million against current liabilities near $1.58 billion yielding a current ratio around 1.45—indicative of reasonable short-term liquidity buffers given the capital-intensive dealership operations [F1]. Total debt stood near $275 million as of year-end 2025 with modest net debt after cash balances suggesting manageable leverage levels aligned with industry norms for franchised commercial truck retailers [F1].
Operating income margins have shown resilience but are subject to external variability given shifts observed recently in key gross margin components—especially the decline in used vehicle margins caused by changing end-customer mixes notably between wholesale accounts versus direct retail trucks sold [S1]. Maintenance of steady cash flow from operations remains essential given ongoing commitments towards investing in service infrastructure expansion such as telematics platforms and mobile repair units needed for fleet uptime enhancement.
Disclaimer: This report is provided solely for informational purposes based on public filings without investment advice or research views.
Disclaimer: This is research-only, informational analysis and not investment advice. It may include AI-generated interpretation and general industry context. Always verify important details using primary sources.

Comments