
Sibanye Stillwater’s Strategic Steps Amid Market Volatility and Operational Challenges
Latest quarterly filings reveal Sibanye Stillwater's steady operational rhythm and a phased approach to its battery metals ambitions amid a volatile precious metals market.
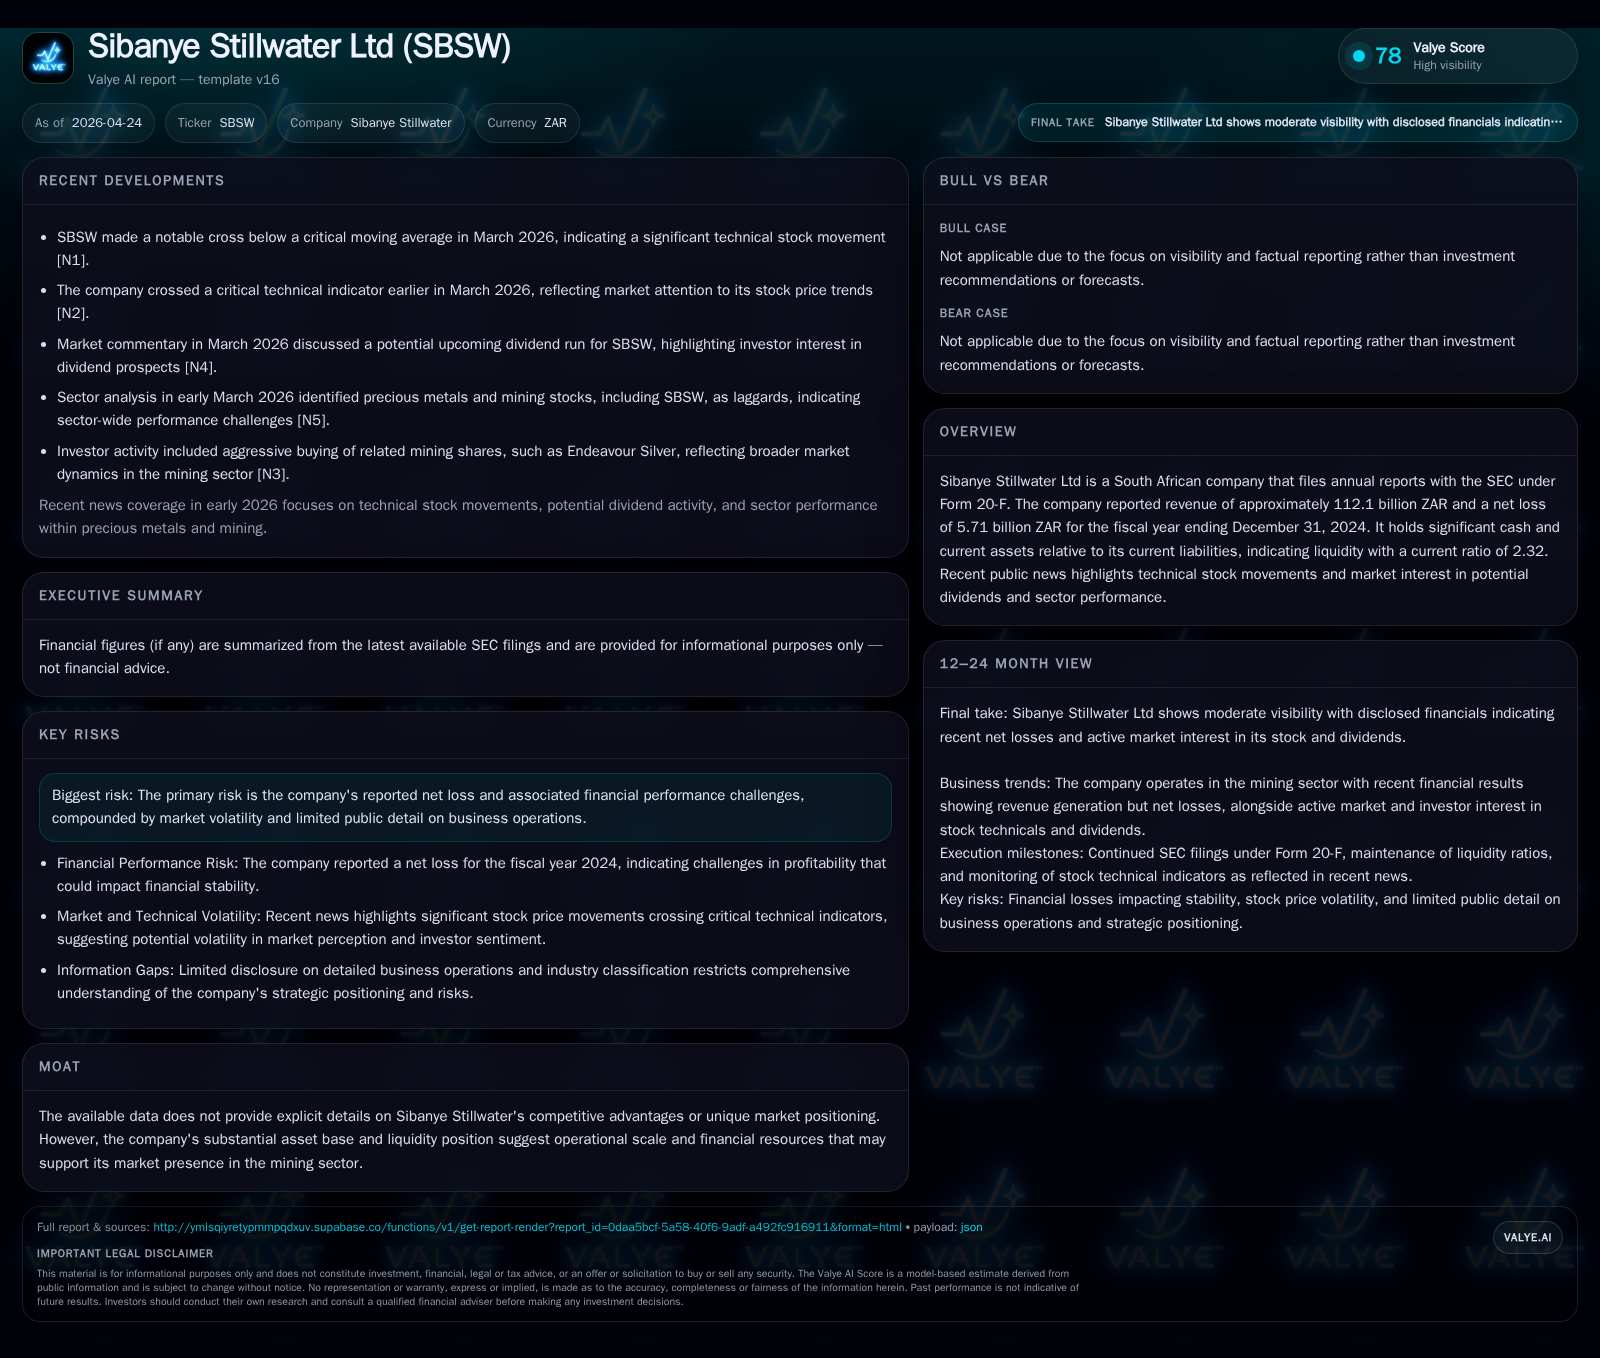
Sibanye Stillwater's recent SEC filings from April 2026 confirm ongoing compliance and steady operating activity despite persistent industry challenges. The company continues to advance its strategic initiatives, notably the phased Keliber lithium project, aimed at diversifying beyond traditional PGMs. While facing net losses and commodity price volatility, Sibanye Stillwater leverages its refining capabilities, mineral resource base, and liquidity to maintain resilience and flexibility. Investors should monitor execution milestones in battery metals development alongside regulation and PGM pricing trends as key drivers for future performance.
Latest Quarterly Operating Disclosure: What Changed?
Sibanye Stillwater’s most recent quarterly filings dated April 24 and April 20, 2026 [S2][S3] serve primarily as confirmations of routine regulatory compliance under the Securities Exchange Act without introducing unusual operational events or restatements. These 6-K reports indicate the company's continued filing cadence under Form 20-F, reaffirming its status as a foreign private issuer listed on the NYSE.
No material surprises or deviations from prior communications are present, signaling stabilizing operations after previous periods marked by sector-wide volatility. The lack of explicit operational highlights implies that Sibanye remains focused on executing pre-existing strategic plans rather than initiating abrupt shifts.
This steadiness in reporting suggests management’s approach prioritizes steady progress in growth initiatives—including critical projects like Keliber lithium—alongside maintaining core mining and refining activities.
Sibanye Stillwater Business Model and Product Quality
Sibanye Stillwater operates predominantly in the extraction and processing of precious metals, chiefly within the palladium, platinum, rhodium (collectively PGMs) space through its South African mines such as Rustenburg, Marikana, Kroondal, and also mining assets in the United States [S1]. Revenue generation flows from mining outputs sold primarily under international commercial terms where payments are largely dollar-denominated.
The company utilizes a toll refining model where ore concentrates from mines like the Platinum Mile are processed externally by entities such as Valterra Platinum before refined products return for sale. This partnership underscores an integrated yet flexible supply chain enabling quality control while spreading capital expenditure.
Beyond mining, Sibanye Stillwater operates recycling facilities in Pennsylvania and North Carolina. These process a wide range of feedstocks—industrial waste streams, electronic scrap, automotive residues—to recover precious metals with purity levels ranging from low-grade shreddings to products exceeding 99.9% purity including powders and sweeps [S1].
Refining partners maintain Good Delivery status with authoritative bodies like the London Bullion Market Association (LBMA) or London Platinum and Palladium Market (LPPM), ensuring outputs meet stringent market acceptance criteria. Such certification enables efficient downstream sales to global customers who demand high-grade materials for industrial uses.
The company also produces zinc concentrate from its Australian Century mine operations that is sold via traders or directly to smelters mainly across Asia-Pacific regions. Although zinc contributes a smaller share relative to precious metals, it complements product diversification.
This vertical chain from mining extraction through toll refining to final sale embodies Sibanye’s core value creation model. The combination of stable client relationships, currency risk management via USD payments, and recognized refinery status partly underpin its pricing power despite commodity cyclicality.
Industry Structure and Sibanye’s Competitive Position
The global precious metals industry is notably influenced by economic cycles affecting jewelry demand, industrial usage—especially catalytic converters for automobiles—and more recently clean energy technologies reliant on PGMs . Supply-side bottlenecks arise from geological scarcity and politically complex jurisdictions like South Africa.
In this space, Sibanye Stillwater competes against major integrated miners such as Anglo American Platinum but distinguishes itself by combining sizable production capacity with established refining partnerships enabling toll processing flexibility. This somewhat hybridized model reduces fixed capital intensity.
Furthermore, regulatory landscapes vary markedly between US operations—subject to EPA environmental standards—and South African mines facing labor laws plus local content requirements. Such regulatory diversity demands adaptive governance but can also serve as competitive moats due to complex permitting barriers for new entrants.
Accelerating structural shifts toward battery electric vehicles elevate demand for lithium-ion battery inputs. Sibanye positions itself within critical minerals supply chains through the Keliber lithium project located in Europe [S1]. This staged start-up project methodically mitigates execution risks by introducing defined holding points before committing to full-scale lithium hydroxide production.
This diversification strategy represents an acknowledgement of the cyclicality inherent in PGMs prices—boosted currently by supply constraints leading to short-term price rebounds—but tempered by potential long-term substitution risks.
Industry participants with exposure to both stable precious metals streams and emerging battery metal segments may be better insulated against commodity price cycles amid evolving energy transitions .
Growth Drivers and Strategic Initiatives
A cornerstone growth driver for Sibanye is the phased development plan for the Keliber lithium project [S1]. This measured approach provides meaningful optionality amid market uncertainties associated with battery metal pricing volatility and capital allocation choices. By advancing through incremental start-up stages—from resource delineation through pilot hydroxide production—the company seeks to retain financial discipline while positioning within Europe's critical minerals sector.
Parallel expansion of core PGM assets aims at maximizing throughput efficiency in South Africa’s Rustenburg and Marikana complexes along with adjacent Kroondal operations now integrated since September 2024 [S1]. Capacity enhancement includes technology upgrades targeting higher recovery rates amid complex ore bodies.
Recycling constitutes another lever for growth whereby industrial waste processing can flexibly augment feedstock supplies to refining activities without commensurate exposure to deposit depletion risks or mine closures. Partnerships with certified third-party Good Delivery refiners accentuate product quality credibility while supporting margin sustainability.
This multi-pronged growth strategy balances exposure between traditional precious metals—with their established market bases—and emergent battery metal demand that benefits from global decarbonization efforts . Together these elements seek to stabilize revenue flows while capturing secular upside trajectories.
Key Risks and Constraints to Growth
Despite proactive strategic initiatives, Sibanye faces notable challenges that may constrain growth execution. Recorded net losses totaling approximately 5.71 billion ZAR for fiscal year ended December 31, 2024 highlight persistent profitability pressures linked largely to PGM price volatility reducing revenue visibility [F1]. Although losses have narrowed compared to prior years' larger deficits (-37.43 billion ZAR in FY2023), bridging sustained profitability gaps depends heavily on commodity price recoveries.
Market susceptibility remains acute given PGMs’ countercyclical industrial demand factors coupled with substitution threats from alternative materials or shifts away from combustion engines [S1]. A prolonged downturn could trigger operation suspensions or stringent cost-cutting measures impairing production continuity.
Regulatory complexity spanning cross-border mining jurisdictions introduces potential compliance costs as well as political risks affecting permitting timelines or labor relations. For example, South Africa’s stringent labor environment necessitates ongoing engagement without jeopardizing productivity.
Capital-intensive nature of new projects like Keliber lithium imposes significant funding commitments which could strain cash flow if market conditions deteriorate sharply or planned ramp-ups experience delays . Furthermore, integration risks related to novel asset types outside traditional PGMs require technical expertise not immediately transferrable from legacy operations.
Finally, declining dividend payouts observed over recent years ([F1]) reflect cautious cash retention policies limiting shareholder returns but preserving financial flexibility during uncertain cycles.
What to Watch: Near-Term Milestones and Market Signals
Investor attention should center on several executional touchpoints as indicators of Sibanye's trajectory through 2026:
- Progress updates on the Keliber lithium project staging decisions delineating transition points toward scaled battery-grade lithium hydroxide output [S1].
- Subsequent quarterly earnings releases expected around mid-2026 providing guidance clarity on PGM production volumes alongside realized metal prices influenced by macroeconomic developments [N1][N2][N3].
- Emerging supply-demand dynamics in PGMs tied closely to automotive catalyst demand recovery versus substitution trends remain pivotal for revenue predictability .
- Corporate governance adjustments aligned with NYSE listing standards juxtaposed against JSE domestic practices likely influencing board composition transparency and committee independence disclosures [S1].
- Technical stock price movements highlighted in recent Nasdaq commentary suggest growing market scrutiny that could foreshadow shifts in institutional sentiment or liquidity patterns [N1][N2][N3].
Effective monitoring across these vectors will help discern whether Sibanye adapts successfully its strategic portfolio amidst external headwinds or requires tactical course corrections.
Financials: Current Balance Sheet Strength and Profitability Trends
Sibanye Stillwater’s full-year financial data per latest annual report confirms revenue generation near 112.1 billion ZAR for FY2024 representing a modest decline (-1.4% YoY) versus FY2023 results of approximately 113.7 billion ZAR [F1]. However, consistent net losses persist at -5.71 billion ZAR although showing improvement from much deeper losses recorded previously (-37.43 billion ZAR in FY2023).
The balance sheet exhibits solid liquidity fundamentals with cash & equivalents near 16 billion ZAR complemented by a current ratio of 2.32 indicating sufficient short-term asset coverage relative to liabilities ([F1]). This robust liquidity underpins continued capital investment capacity particularly vital for multi-year rollout projects like Keliber without immediate refinancing necessity documented in latest public filings ([S2],[S3],[S4]-[S10]).
Equity levels stand around 48.3 billion ZAR at year-end reflecting moderate erosion but stable capitalization given challenging commodity price environments [F1]. Dividends paid have materially contracted aligning with conservative distribution policies emphasizing reinvestment over payouts amid uncertainty [F1].
Overall financial stance balances operational loss absorption against strong asset-backed liquidity providing runway for strategic execution but contingent upon commodity recovery outlooks sustaining momentum.
Historical performance (annual)
| FY | Rev ($bn) | Net ($bn) | Rev YoY | Net YoY |
|---|---|---|---|---|
| 2024 | 112.1 | -5.7 | -1.4% | +84.7% |
| 2023 | 113.7 | -37.4 | -17.8% | -297.2% |
| 2022 | 138.3 | 19.0 | -19.7% | -43.8% |
| 2021 | 172.2 | 33.8 |
Source: SEC companyfacts cache [F1].
Capital returns and efficiency (annual)
| FY | Div ($bn) | ROE% |
|---|---|---|
| 2024 | 0.2 | -11.8 |
| 2023 | 5.3 | -72.5 |
| 2022 | 9.5 | 20.9 |
| 2021 | 18.2 | 41.5 |
Source: SEC companyfacts cache [F1].
These figures reiterate how volatile earnings have pressured returns but maintain room for recovery given operational scale and diversified mineral portfolio.
This analysis is intended solely as an informational resource reflecting public SEC disclosures and known sector context as of April 2026; it does not constitute investment advice.
Disclaimer: This is research-only, informational analysis and not investment advice. It may include AI-generated interpretation and general industry context. Always verify important details using primary sources.
Comments