
Starbucks Accelerates Revenue Growth and Store Portfolio Optimization in Q3 2026
Strong comparable store sales and strategic portfolio management underpin Starbucks' ongoing competitive edge amid margin pressures.
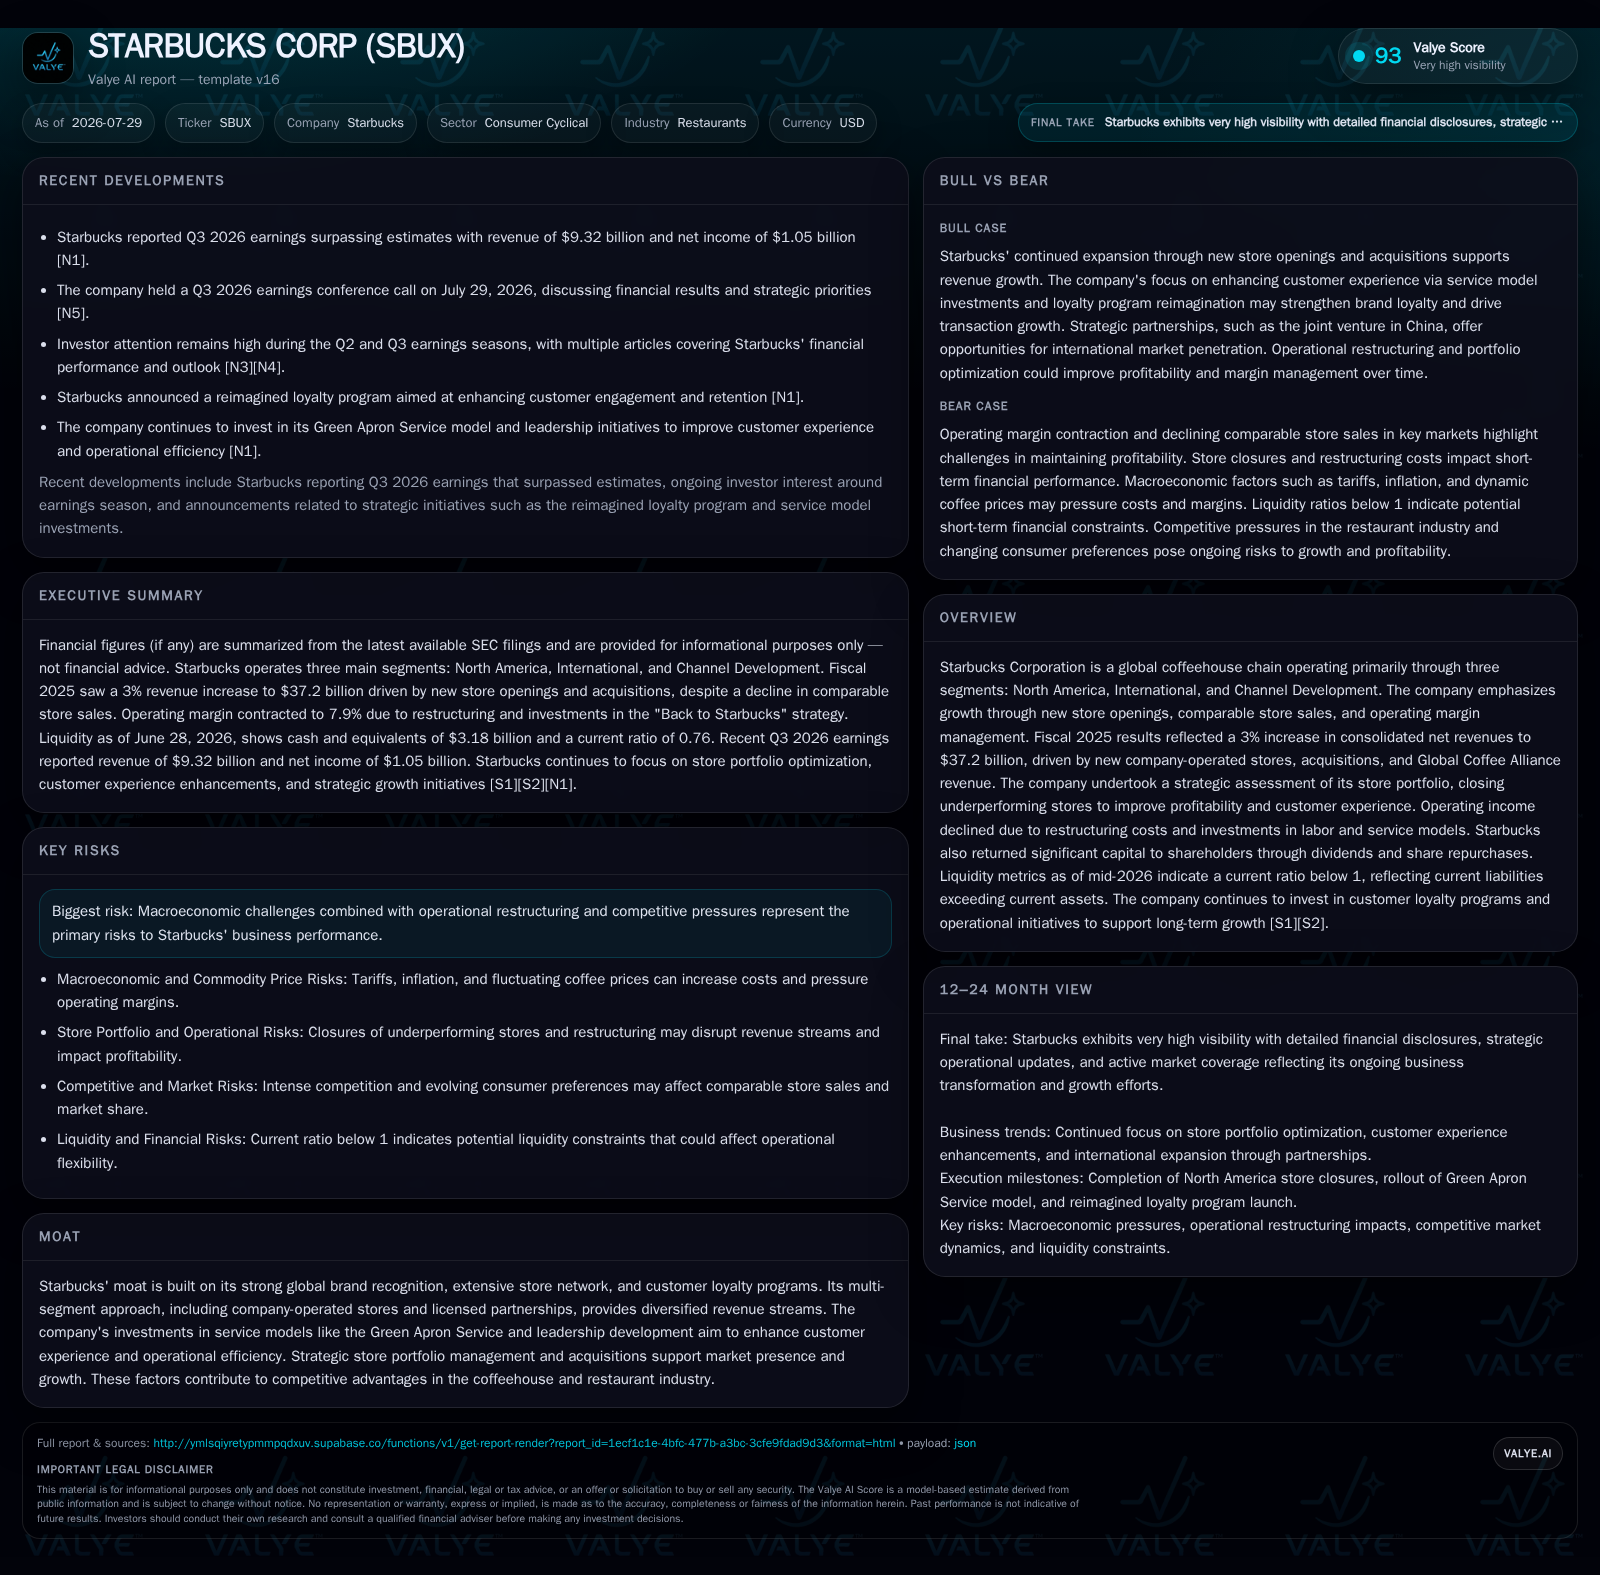
Starbucks reported a robust 7.9% increase in global comparable store sales for Q3 2026, surpassing expectations and prompting an upward revision of full-year guidance [S2][N1]. This growth is driven by successful marketing initiatives, menu innovation, and the Green Apron Service model enhancing customer experience. However, operating margins face compression due to rising labor and commodity costs, as well as restructuring expenses linked to optimizing store footprint and support functions [S2][S18]. Starbucks maintains a substantial global presence through a mix of company-operated and licensed stores, leveraging diversified revenue streams including its Global Coffee Alliance with Nestlé [S1][S6]. While risks from economic volatility and cost inflation persist, Starbucks’ commitment to digital engagement, loyalty programs, and international expansion continues to fuel sustainable growth momentum.
Recent Operating Update
The improved comparable sales were broadly distributed across regions: the North American operations saw solid customer traffic increases accompanied by average ticket size growth fueled by beverage customizations, while international markets benefited from continued expansion of licensed stores and successful localized marketing [S4][N1]. These outcomes underscore effectiveness of the “Back to Starbucks” strategy centered on elevating the in-store experience through its Green Apron Service model—a dedicated service approach reinforcing customer connection—and targeted menu innovation aligned with consumer trends
However, despite top-line gains, Starbucks experienced continued operating margin pressure. The operating margin contracted by approximately 290 basis points compared to prior periods due largely to higher labor costs invested in partner staffing levels to support enhanced service protocols (contributing roughly 260 basis points of margin drag) as well as inflationary cost headwinds including tariffs impacting coffee prices (around 150 basis points) [S10][S11]. Additionally, restructuring charges related to the company’s ongoing store portfolio rationalization—aimed at optimizing unit economics by closing underperforming stores and reshaping its Starbucks Reserve and Roastery presence—further weighed on profitability [S18].
Business Model Overview
Starbucks operates as a premier global roaster, marketer, and retailer of specialty coffee with revenue generated through three primary segments: North America (including U.S. and Canada), International (covering China, Asia Pacific, Europe, Middle East, Latin America), and Channel Development [S1][S6]. Its business model combines company-operated stores that capture retail margins directly alongside licensed store operations generating franchise fees.
Revenue drivers include new company-operated store openings that grow footprint scale; increases in comparable store sales reflecting higher customer traffic or spend per transaction; revenue from licensed partners; and consumer-packaged goods sold through retail channels facilitated chiefly by its Global Coffee Alliance joint venture with Nestlé creating recurring wholesale revenue streams outside brick-and-mortar outlets [S1][S6]
Monetization at company-operated stores depends heavily on volume (transactions/customers) and ticket size (average spend), both impacted by product mix decisions such as introducing new beverages or food items targeting evolving consumer preferences. Franchise/licensing provides stable fee income without direct operational expenses but limits upside exposure.
Operationally significant variables include labor cost ratios given the service intensity of Starbucks locations; food & beverage cost volatility tied to raw material pricing; real estate lease obligations; and ongoing capital expenditures focused on store refurbishments or technological upgrades enhancing loyalty program participation or digital ordering capabilities [S7]
Industry Structure and Competitive Position
Within the Restaurants sector—specifically specialty coffee retail—Starbucks competes against peer companies such as Dunkin’ Brands (quick-service coffee focus) and fast casual chains like Chipotle Mexican Grill for discretionary consumer spending. Unlike mass-market quick-service restaurants such as McDonald’s which rely heavily on franchising for rapid expansion, Starbucks mixes company-operated stores maintaining brand control with licensed outlets offering more flexible capital-light growth.
Starbucks’ moat stems primarily from its unparalleled brand recognition worldwide coupled with a dense global network exceeding 41,000 locations as of late fiscal 2025 [S6], an elaborate customer loyalty ecosystem driving repeat visits via personalized rewards programs integrated digitally, plus proprietary service standards like Green Apron Service supporting premium experience differentiation. Its multi-channel strategy including packaged goods under the Channel Development segment complements retail engagement providing additional touchpoints beyond cafés.
The balance between company-operated versus licensed outlets also reflects regional idiosyncrasies; for example, the International segment notably shifted toward licensing models accounting for nearly 90% of stores in recent years—a strategic move reducing capital intensity but necessitating strong licensee relationships for quality control [S18].
Growth Drivers
Growth catalysts include:
- New Store Openings: Expansion remains foundational with opening of net new company-operated stores contributing incremental revenues alongside licensed outlets scaling through partnerships.
- Comparable Store Sales: Organic growth via greater customer footfall and higher average ticket size fueled by menu innovation (e.g., seasonal offerings) and customization options encourages spending uplift.
- Digital Engagement & Loyalty: Investments in technology platforms enabling mobile orders/payments alongside enhanced Starbucks Rewards programs drive customer retention benefiting lifetime value metrics.
- International Market Penetration: Geographic diversification via licensing deals particularly in China backed by strategic partner Boyu Capital aims at capturing burgeoning coffee consumption trends amid urbanization.
- Channel Development & Partnerships: The Global Coffee Alliance with Nestlé expands wholesale distribution for packaged coffees reaching consumers beyond café visits.
- Operational Efficiency: Ongoing portfolio optimization actions reducing unit-level costs by shuttering underperforming stores plus refining support infrastructure signal potential margin recovery long term.
Risks and Watchpoints
Key risks articulated since most recent filings remain largely unchanged:
- Macroeconomic Volatility: Consumer discretionary spending remains sensitive to economic downturns potentially damping frequency of premium coffee purchases.
- Commodity Price Inflation: Volatility in coffee bean pricing compounded recently by geopolitical tariffs threatens food & beverage cost control essential for margin stability.
- Labor Cost Pressures: Wage inflation paired with staffing shortages impose upward cost pressures necessitating careful labor deployment balancing service quality versus expenditure.
- Competitive Intensity: Increasing competition from local chains or emerging specialty coffee operators risks market share erosion despite brand strength.
- Regulatory/Geopolitical Concerns: Health regulations affecting product formulations or sourcing constraints could impact offerings or supply chain reliability internationally.
- Portfolio Rationalization Execution Risks: Restructuring charges tied to closing stores or reallocating resources could affect short-term financial performance if not managed smoothly.
Monitoring comparable store sales trends closely alongside labor cost ratios will be critical indicators reflecting both demand sustainability and efficiency improvements respectively going forward.
What to Watch Next
Investors should track forthcoming quarterly reports focusing on:
- Continued trajectory in comparable store sales growth rates globally including key regional splits,
- Margin development particularly regarding labor cost efficiency gains versus wage inflation impacts,
- Progress updates on execution of restructuring plans including Starbucks Reserve/Roastery optimization,
- Digital penetration metrics indicating adoption rates of mobile orders/rewards programs,
- New store opening cadence balanced against closure rates informing net footprint changes,
- Developments around international joint ventures especially in China influencing revenue diversification,
- Capital allocation moves including share repurchases or dividend policies reflecting cash flow priorities.
Financial Profile Discussion
As of June 28, 2026 balance sheet data reported via companyfacts [F1], Starbucks had total debt near $13.4 billion and net debt approximately $10.2 billion. Current assets were about $7.5 billion against current liabilities near $9.9 billion, implying a current ratio of approximately 0.76x [F1]. This suggests tight short-term liquidity coverage consistent with typical industry working capital patterns where receivables turnover quickly against lease obligations.
In summary, Starbucks exhibits balanced financial flexibility underpinning its operational investments while maintaining shareholder returns amidst navigating external inflationary pressures alongside executing strategic transformation efforts designed to bolster sustainable growth.
Disclaimer: This is research-only, informational analysis and not investment advice. It may include AI-generated interpretation and general industry context. Always verify important details using primary sources.

Comments