
Seer, Inc. Expands Proteomics Commercialization Amid Ongoing Financial Losses and Market Challenges
Seer recently reported steady progress in scaling its Proteograph platform but continues to face commercialization and profitability hurdles.
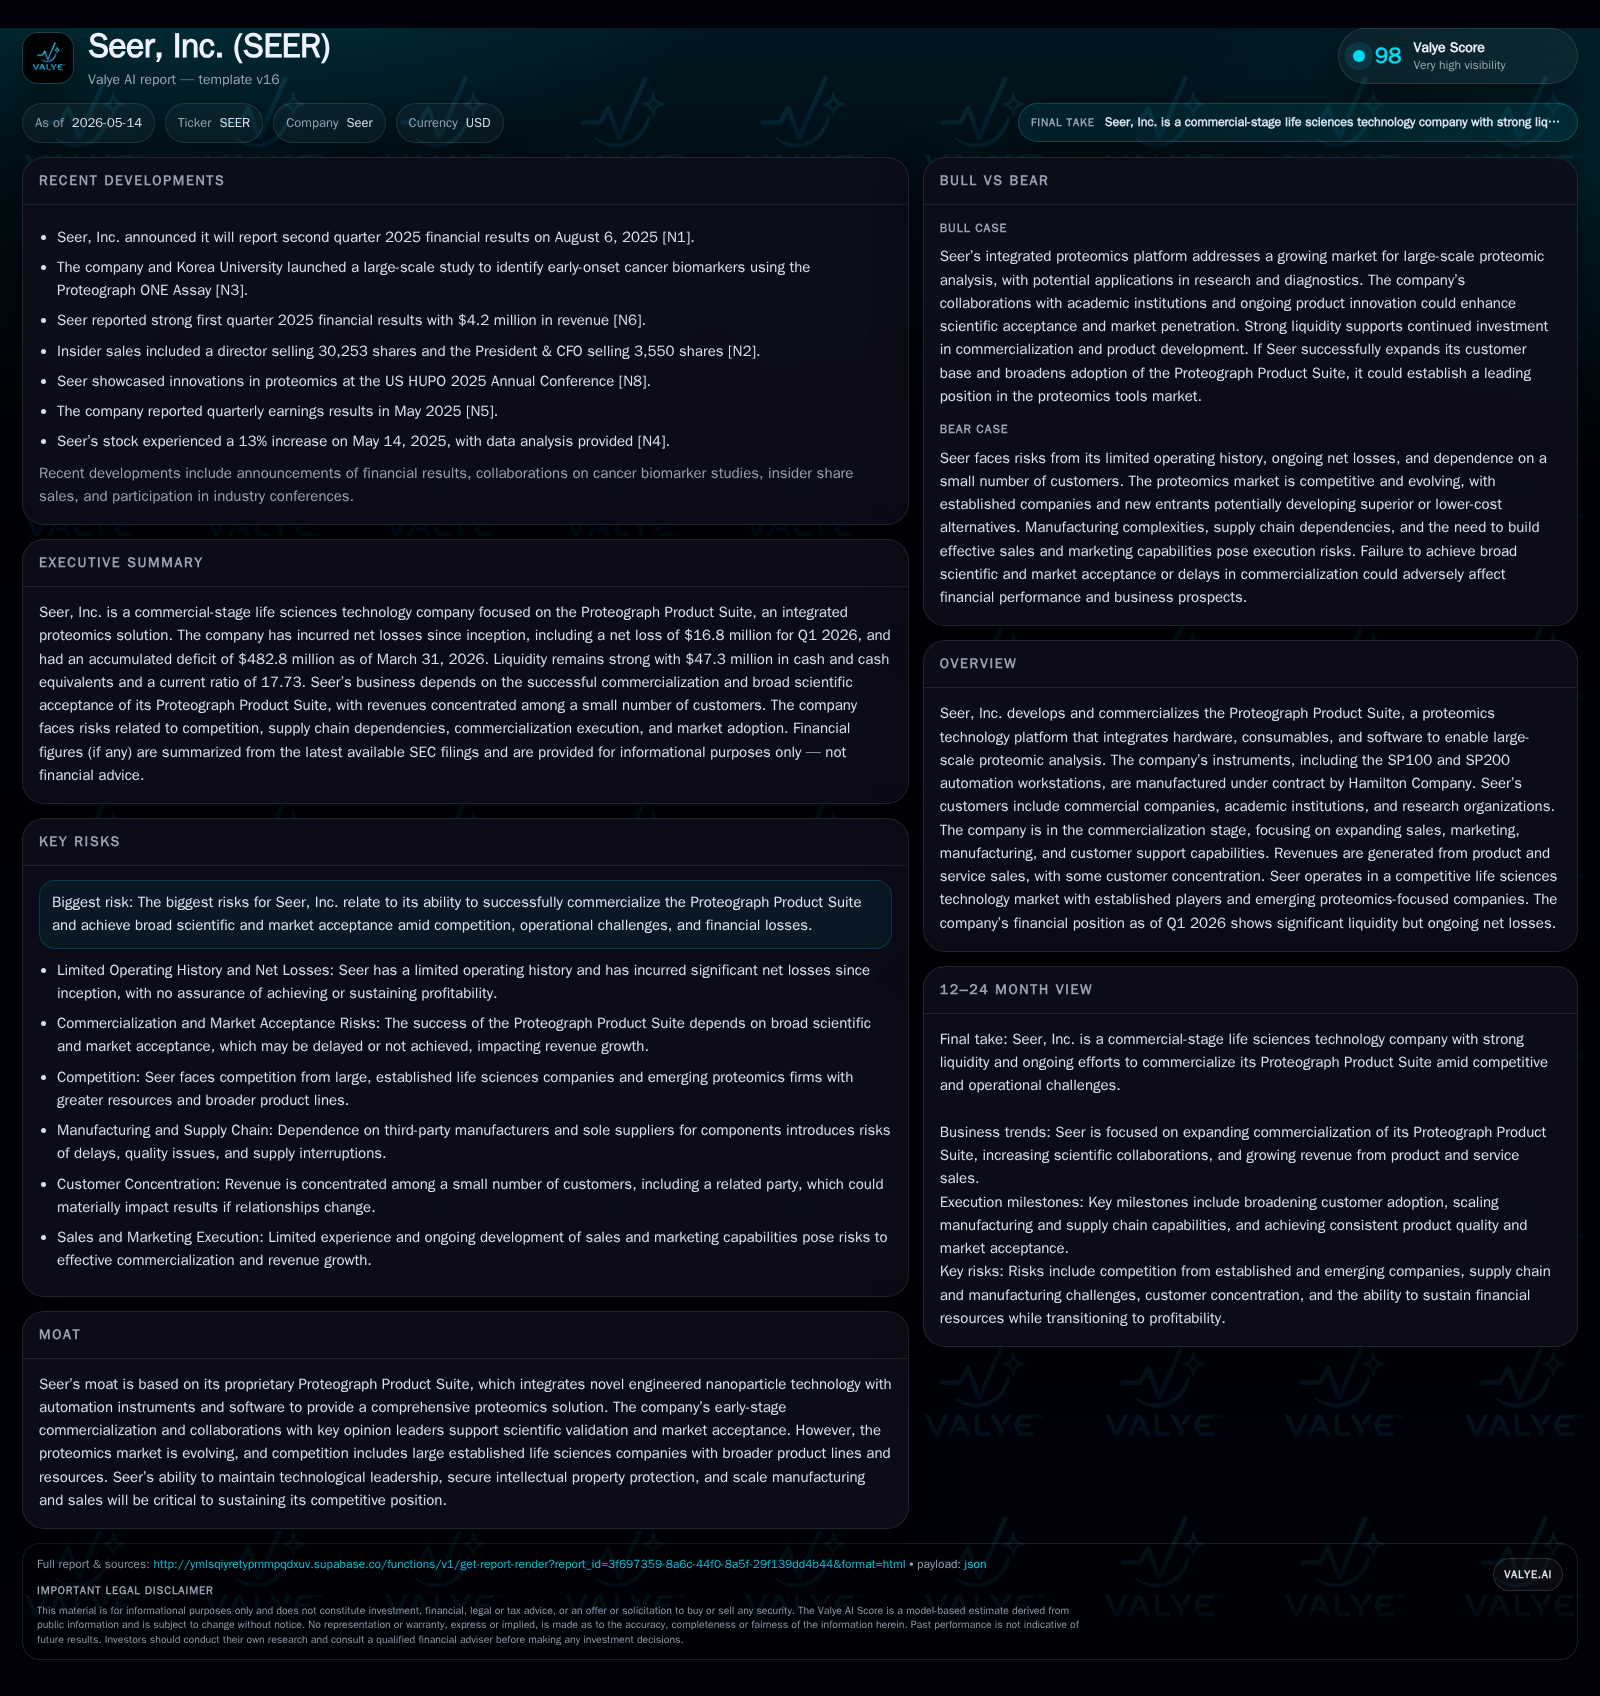
In its Q1 2026 filing, Seer, Inc. reaffirmed its focus on commercializing the Proteograph Product Suite, highlighting growth in sales and enhancements in manufacturing and customer support functions. Despite these operational advances, the company is still operating at a net loss with negative cash flows characteristic of emerging life sciences platform companies. Seer’s proprietary integration of nanoparticle technology with automation and software provides a differentiated product in a competitive proteomics market dominated by incumbents with broader portfolios. The path to growth hinges on expanding scientific adoption, securing intellectual property, and maintaining technological leadership amid evolving regulatory and market dynamics.
Recent Operating Update
Seer, Inc.'s latest quarterly report for Q1 2026 [S2] and accompanying Form 8-K filings [S3] provide an updated view on the company's ongoing commercialization efforts of its Proteograph Product Suite. The company reported continued expansion in its sales, marketing, manufacturing partnerships, and customer support infrastructure aimed at accelerating adoption of its integrated proteomics platform.
Despite these advances in operational execution, Seer remains in the early commercialization stage with no indication yet of profitability or positive cash flow generation. The company disclosed maintaining significant liquidity headroom as of March 31, 2026 with cash & equivalents at $47.3 million and a healthy current ratio of 17.73 [F1]. However, operating losses remain material with full-year 2025 operating income at -$77.9 million [F1].
Furthermore, Seer has recently been subject to unsolicited acquisition proposals from activist investors or other parties which were publicly rejected by the board in April 2026 [S6], [S20]. This denotes heightened strategic scrutiny but management’s commitment to its current long-term development strategy.
Business Model
Seer's business model centers on commercializing its Proteograph Product Suite—a comprehensive proteomics platform that integrates:
- Engineered nanoparticles for sample preparation enabling high-throughput protein detection
- Automation instruments including SP100 and SP200 workstations manufactured under contract by Hamilton Company
- Proprietary software solutions enabling data analysis for large-scale proteomic studies
Revenue generation derives from the sale of these hardware units combined with consumable nanoparticle reagents and ancillary services such as technical support and training. Customer segments include commercial life science companies aiming to incorporate advanced proteomic analyses into drug discovery pipelines as well as academic institutions conducting foundational biological research.
Margins depend on factors such as product mix between hardware (typically higher ASPs) versus consumables (recurring revenue), volume scale efficiencies via contract manufacturing partners (Hamilton), and service penetration expansion. The recurring consumables business is potentially a key lever for margin expansion if scientific adoption widens.
Industry Structure and Competitive Position
Proteomics is an evolving segment within life sciences focused on comprehensive protein measurement capabilities complementary to genomics but technically more challenging due to protein complexity.
Seer's moat lies primarily in the proprietary combination of engineered nanoparticles designed to capture the proteome efficiently with automation hardware integrated seamlessly with data analytics software—a vertically integrated solution that few competitors fully replicate.
Competition includes well-established life sciences tool providers offering mass spectrometry platforms or specialized reagents but generally without Seer's integrated end-to-end workflow design focused on scale and reproducibility. Emerging specialist proteomics startups are also competing but face similar early-stage adoption challenges.
The vendor ecosystem requires robust intellectual property portfolios to protect unique chemistries; Seer’s ability to maintain this will be critical given the resource advantages held by larger multi-product incumbents.
Growth Drivers
Key growth vectors identified include:
- Market Adoption: Increasing penetration among academic researchers and commercial clients as large-scale proteomic data gains prominence for biomarker discovery and drug target validation.
- Capacity Utilization: Scaling up production efficiency through contract manufacturing partnerships (Hamilton) enables meeting growing demand while potentially improving gross margins.
- Product Roadmap: Ongoing R&D investments aimed at introducing next-generation nanoparticle chemistries or enhanced automation features could improve sensitivity or throughput.
- Geographic Expansion: Broadening international distribution channels which may benefit from less penetrated markets or collaborations with global research consortia.
- Service Offerings: Expanding value-added services like custom data analysis or application-specific workflows to deepen customer relationships.
These factors could manifest in measurable KPIs such as order backlog growth, installed base expansion of SP series instruments, recurring consumable revenue ramp-up, retention rates for service contracts, or margin improvements from scale effects.
Risks and Watchpoints
Several operational and market risks constrain Seer’s growth prospects:
- Commercialization Risk: Achieving broad scientific consensus around the Proteograph’s advantages remains uncertain given entrenched technology alternatives; failure here would limit revenue potential.
- Financial Sustainability: Persistent net losses require ongoing capital raises or cost management; adverse liquidity scenarios could restrict operational investments needed for growth.
- Regulatory Environment: Complexities around potential FDA classification if products are used clinically or near-patient impose compliance costs; recent shifts in regulatory doctrines add unpredictability [S4], [S9].
- Competitive Pressure: Larger instrument vendors could launch competing integrated workflows leveraging bigger installed bases or bundled offerings.
- Manufacturing Dependence: Reliance on third-party contract manufacturers introduces risks regarding capacity constraints or quality issues impacting delivery timeliness.
- Intellectual Property: Inadequate or challenged patent protections could erode Seer’s technology exclusivity with commoditization risk rising over time.
- Scientific Validation: The platform’s perceived value depends heavily on ongoing endorsements by key opinion leaders who influence wider community acceptance.
What to Watch Next
Investors and industry watchers should focus on milestones indicating sustained commercial traction including:
- Quarterly updates revealing order book growth, gross margin trends particularly improvement from higher consumable attachment rates.
- New product announcements or field trials validating performance enhancements over incumbent techniques.
- IP portfolio developments such as granted patents or litigation outcomes protecting core nanoparticle innovations.
- Regulatory clarity especially regarding FDA policies impacting marketing claims or device labeling post-research use only (RUO) classifications.
- Announcements relating to strategic partnerships expanding geographic reach or industry collaborations advancing scientific credibility.
- Cash runway updates including any equity raises adjusting capital structure amidst continued investment needs.
- Customer testimonials evidencing integration into downstream clinical applications which can broaden addressable markets beyond research settings.
Financial Profile Summary
Latest financial snapshot
| Metric | Value | Period |
|---|---|---|
| Cash & equivalents | $47mm | |
| 2026-03-31 | ||
| Current assets | $182mm | |
| 2026-03-31 | ||
| Current liabilities | $10mm | |
| 2026-03-31 | ||
| Current ratio | 17.73x | |
| 2026-03-31 |
Source: SEC companyfacts cache [F1].
As of Q1 2026 end:
- Cash & equivalents stood at $47.3 million providing solid near-term liquidity support alongside strong current assets of $181.6 million against modest current liabilities of $10.2 million (current ratio 17.73) [F1]
- Full-year operating loss reported at -$77.9 million for FY2025 reflecting continued investment in commercialization infrastructure while revenues are scaling [F1]
- No current explicit debt obligations disclosed implying no immediate leverage constraints [F1]
- Share repurchase programs totaling up to $50 million authorized since May 2024 signal confidence but execution remains discretionary based on capital availability [S22], [S26]
Finances underline a typical early-stage deep tech growth company dynamic: operational burn supports technology validation efforts while building out commercial capabilities; breaking even likely requires successful market uptake over several years horizon.
This analysis draws exclusively on the latest SEC filings through May 2026 and publicly available data as specified in citations without supposition beyond documented disclosures. It aims to present an independent assessment rooted in operating fundamentals rather than speculative outlooks.
Disclaimer: This is research-only, informational analysis and not investment advice. It may include AI-generated interpretation and general industry context. Always verify important details using primary sources.
Comments