
Seven Hills Realty Trust’s Tailored Loan Strategy and Capital Structure in Focus
An in-depth analysis of SEVN's niche middle market CRE lending approach and its financing framework amid shifting market dynamics.
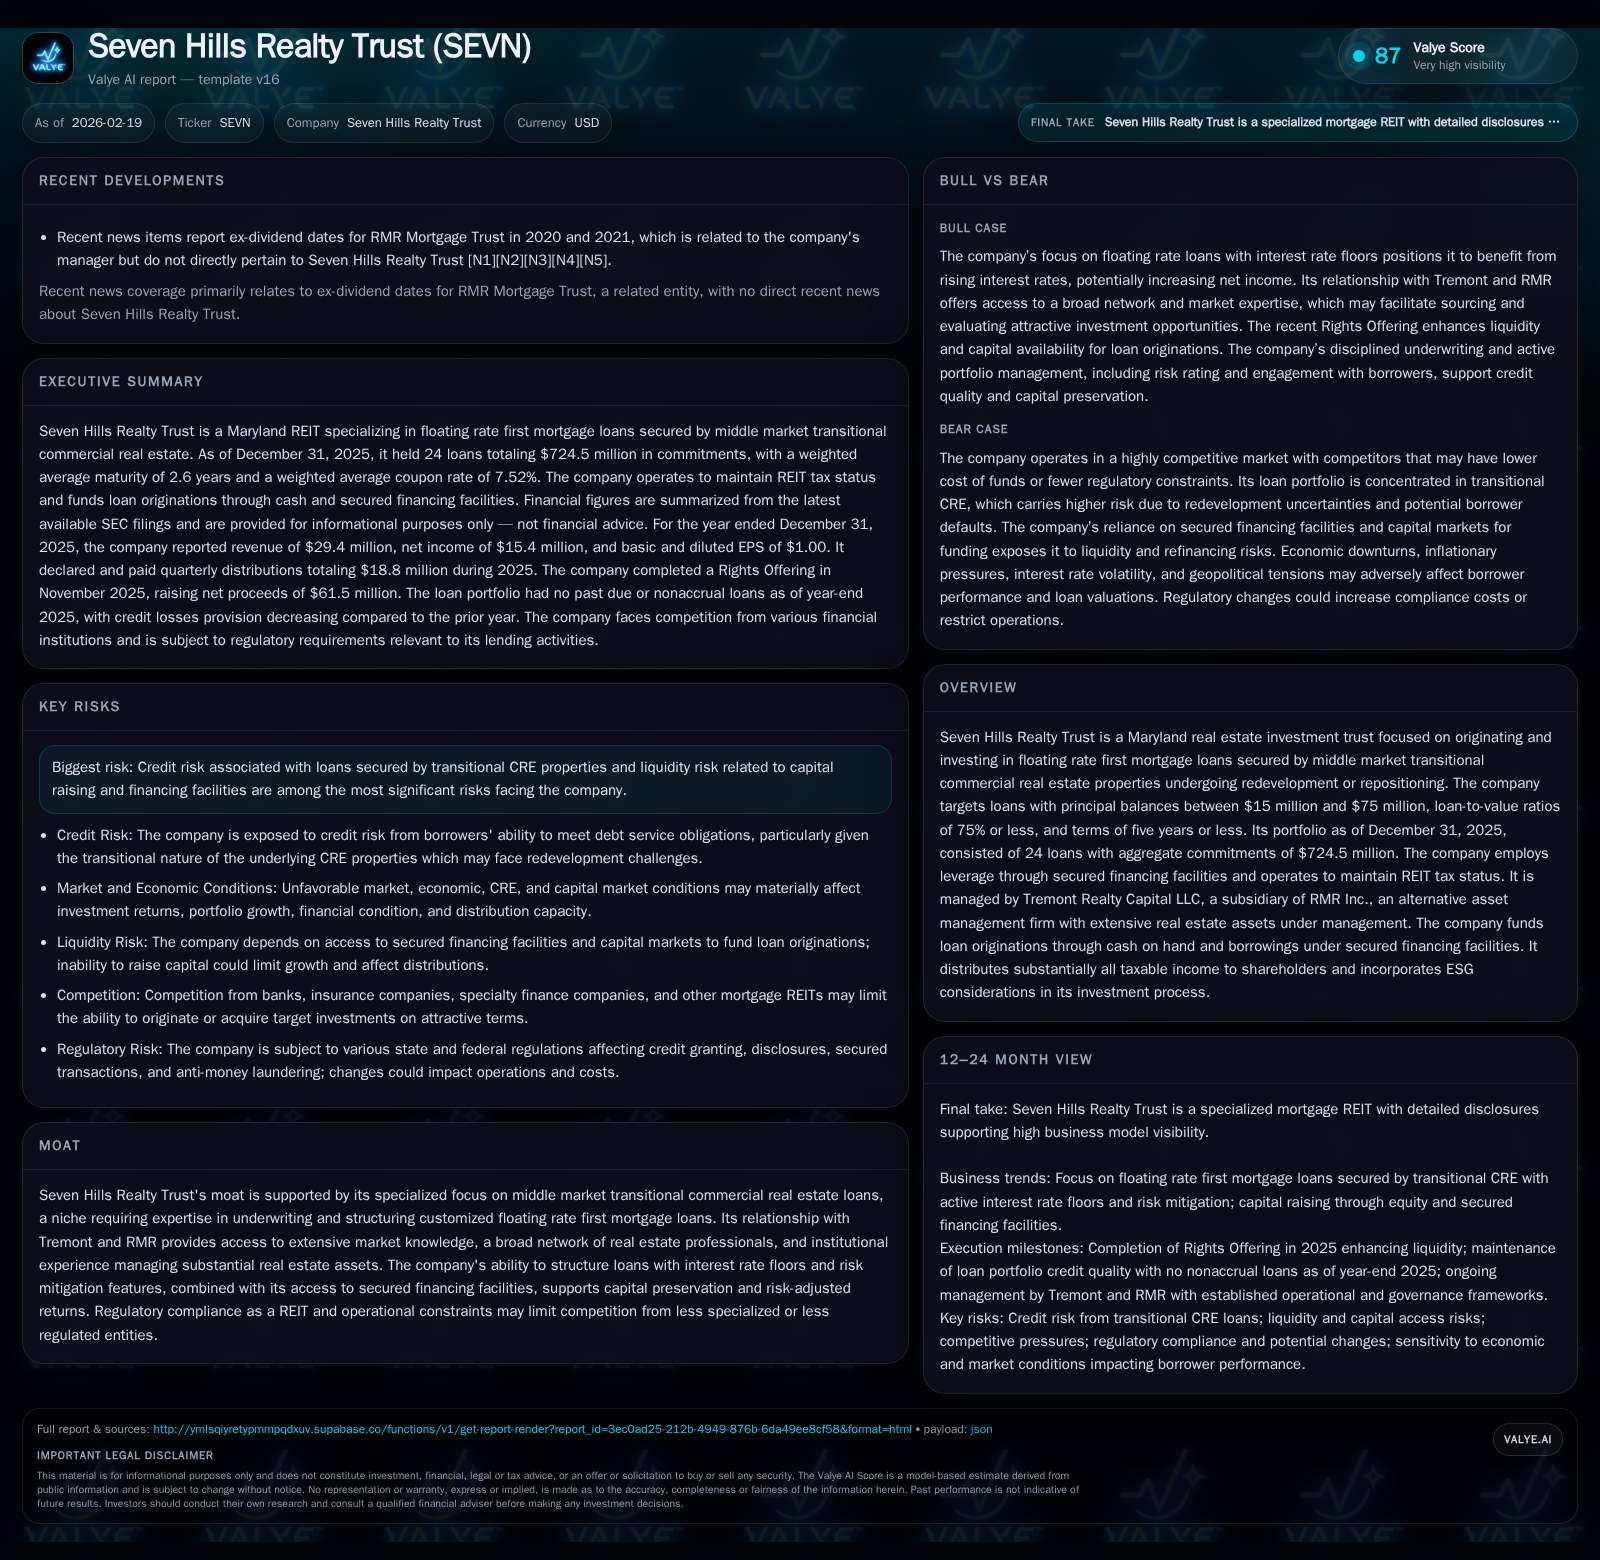
Seven Hills Realty Trust concentrates on floating rate, first mortgage loans to middle market transitional commercial real estate properties, leveraging its partnership with Tremont Realty Capital and a suite of secured financing facilities. Recent financials reveal a contraction in revenue and net income in 2025, partly due to lower SOFR rates and competitive loan prepayments. The company maintains a disciplined loan portfolio with risk mitigation strategies and active credit oversight. Its capital structure relies heavily on master repurchase agreements with major banks, which impose restrictive covenants but enable liquidity for growth. Dividend payouts remain steady though slightly reduced in line with cash flow declines. Key risks include borrower credit performance amid economic uncertainty and leveraging constraints tied to REIT regulations.
Specialization in Middle Market Transitional CRE Lending: The Core Investment Thesis
Seven Hills Realty Trust (SEVN) has carved out a distinct role focused exclusively on originating and managing floating rate first mortgage loans secured by middle market transitional commercial real estate (CRE) properties across the United States [S1][F1]. These are properties typically undergoing redevelopment or repositioning efforts aimed at increasing their intrinsic value.
The company predominantly targets loans ranging between $15 million and $75 million in principal balance, with a conservative loan-to-value (LTV) cap generally set at 75% or less [S1][S14]. Loan terms do not exceed five years, reflecting the bridge financing nature intended for borrowers expecting refinancing or property disposition within a relatively short horizon.
SEVN’s loans feature SOFR-linked floating interest rates augmented by competitive margins along with active interest rate floors averaging around 2.81%, which provide protection against falling benchmark rates—a salient risk metric given recent SOFR volatility [S1][S14]. The firm insists on customized loan structures tailored closely to the borrower's redevelopment plan for the underlying collateral, integrating non-recourse provisions with stringent carve-out guarantees identifying responsible parties for certain adverse events [S1][S14]. This specialization requires depth in underwriting expertise.
Crucially, SEVN benefits significantly from its relationship with Tremont Realty Capital LLC—a subsidiary of RMR Inc.—which offers seasoned middle market CRE investment advisory capabilities backed by institutional knowledge and portfolio management experience across extensive real estate assets [S1]. This relationship forms a core component of SEVN’s moat.
Historical Financial Performance and Trends: Navigating Recent Revenue and Income Declines
A glance at SEVN’s financial trajectory reveals contraction in key income metrics over the past three fiscal years culminating in 2025. Revenues declined from $38.2 million in FY2023 to $29.4 million in FY2025 ([F1] Table).
Historical performance (annual)
| FY | Rev ($mm) | Net ($mm) | CFO ($mm) | Rev YoY | Net YoY |
|---|---|---|---|---|---|
| 2025 | 29 | 15 | 15 | -16.7% | -13.4% |
| 2024 | 35 | 18 | 20 | -7.7% | -31.4% |
| 2023 | 38 | 26 | 20 | -6.1% | |
| 2022 | 28 | 13 |
Note: Omitted columns lack sufficient annual XBRL coverage in the provided tags (need ≥2 annual points): OpInc, Capex, FCF. Source: SEC companyfacts cache [F1].
Capital returns and efficiency (annual)
| FY | Div ($mm) | Buybacks ($) | ROE% |
|---|---|---|---|
| 2025 | 19 | 383000 | 4.7 |
| 2024 | 21 | 377000 | 6.6 |
| 2023 | 21 | 183000 | 9.6 |
| 2022 | 15 | 137000 | 10.2 |
Source: SEC companyfacts cache [F1].
Note: Operating income and Capex data not available from provided tags.
The year-over-year revenue decline of approximately -16.7% between FY2024 and FY2025 largely stems from reduced net interest income driven by lower prevailing SOFR index levels impacting coupon resets across the portfolio as well as fluctuating prepayment activity among borrowers [S17][F1]. This correspondingly pressured net income which decreased by about -13.4%.
Operating cash flow contracted more sharply (-25%) during the same period as lower loan repayments combined with increased loan originations altered cash inflows/outflows dynamics [F1]. While net income remains positive, the resulting return on equity based on FY2025 figures is modest—approximately a 4.7% ROE calculated via net income over equity base—signaling compression compared to previous years [F1].
Loan Portfolio Composition and Credit Risk Management Practices
As of December 31, 2025, SEVN maintained a tightly concentrated portfolio consisting of only twenty-four floating rate first mortgage loans aggregating approximately $724.5 million under commitments [S24][F1]. Loans span diverse geographic regions and property types but share uniform characteristics centered around middle market transitional CRE requiring value-add approaches.
SEVN actively rates each loan's credit risk on a scale from "1" (lower risk) to "5" (impaired or loss likely), incorporating proprietary evaluations considering sponsor financial strength, collateral quality, leasing status, debt yield metrics, exit plans, and localized market conditions [S16]. By year-end, four loans (~17% of amortized cost) were classified as “higher risk” or rating “4” yet none fell under rating “5” indicating imminent loss expectations [S8].
Risk mitigation strategies embedded within loan documentation typically include cash flow sweeps directing excess borrower cash flows towards loan repayment or reserves as well as legally enforceable interest reserves to smooth debt service coverage during transition phases [S14]. Collateral-dependent loans—those principally reliant on underlying property value for repayment rather than ongoing operations—are carefully monitored quarterly through fair value comparisons versus amortized cost to establish appropriate allowances for credit losses under U.S GAAP expected credit loss methodologies [S11][S16].
No nonaccrual or past due loans were reported at December 31, 2025—a notable indicator amidst inflationary pressures and interest rate shifts affecting borrower liquidity profiles [S8]. However, management continues diligent engagement with borrowers to verify execution progress aligned with business plans underpinning each secured loan.
Leverage Framework and Capital Structure: Navigating Repurchase Facilities and Debt Covenants
SEVN’s capital structure relies substantially on secured financing facilities primarily in the form of master repurchase agreements (“repo facilities”) with major lending banks—Wells Fargo, Citibank, UBS—and supplemented by a credit facility with BMO Harris Bank (collectively referred to as Secured Financing Facilities) [S4][S6].
As per year-end figures:
- UBS Master Repurchase Facility holds an outstanding balance near $195 million against maximum capacity of $250 million,
- Wells Fargo Master Facility carries about $93 million,
- Citibank Master Facility totals approximately $136 million,
- BMO Facility accounts for roughly $65 million, together making total borrowings against these lines approximately $488 million [S5].
These facilities permit SEVN to pledge its mortgage loans as collateral against borrowings at advance rates generally ranging from 75% up to tentatively 80%, contingent on lender approvals—the haircut percentages reflect prudent valuation discounts applied by banks when pricing advances relative to underlying collateral fair values [S13][S18]. The repo agreements incorporate margin call mechanisms mandating debt reduction or additional collateral posting if collateral values drop below negotiated thresholds—a critical liquidity risk trigger inherent in such arrangements [S19].
Financial covenants embedded within these agreements restrict dividends or new investments when certain minimum tangible net worth or interest coverage ratios are breached ensuring cautious capital deployment aligned with debt service capability [S23]. Despite this restrictive framework, amendments made early in calendar year 2026 extended maturities for Wells Fargo and UBS repo agreements through early-to-late February/March 2028 while expanding capacity notably at Wells Fargo by $125 million enhancing borrowing flexibility [S5].
Notably, SEVN’s leverage ratio at December 31, 2025 stood at an overall debt-to-equity multiple around 1.5x—well within internal policy guidance capped near a maximum of about three-and-a-half times equity—but still reflecting moderate use of borrowed funds relative to its equity base aimed at balancing incremental returns without excessive risk-taking [S9].
Dividend Strategy, Shareholder Returns, and Capital Allocation Efficiency
SEVN maintains consistent dividend payments aligned with REIT distribution mandates requiring payout of most taxable income annually [S15][S26]. Dividends declined modestly from about $20.7 million paid during calendar year 2024 down to roughly $18.8 million for full-year 2025 reflecting decreased operating earnings capacity amid challenging borrowing cost dynamics [F1][S17]. Quarterly distribution declared early in January 2026 was set at $0.28 per share totaling approximately $6.3 million earmarked for payment shortly thereafter indicating sustained commitment toward shareholder returns albeit cautiously scaled.
Capital allocation highlights include minimal stock buyback activities reflecting either tight liquidity prioritization towards loan funding or regulatory constraints pertaining to affiliated transactions under Tremont/RMR manager relationships which backstop equity issuances when required; buybacks totaled under half a million dollars annually keeping share count largely stable [F1][S7].
Distributable earnings accounting appropriately excludes certain non-cash items such as accreted purchase discounts related to exit fees recognized upon collection underscoring conservative profitability measurement practices used internally for dividend coverage assessments rather than headline revenue figures alone [S4][S26]. Overall dividend coverage appears adequately supported given operating cash flows even despite recent decline trajectories.
Market Conditions Impacting Growth Opportunities and Portfolio Repositioning
Recent periods witnessed heightened financial market volatility stemming from U.S fiscal policies intertwined with geopolitical tensions that tempered transaction volumes within commercial real estate sectors early into calendar year 2025 before improving markedly following three Federal Open Market Committee interest rate reductions that year subduing previously elevated benchmark rates [S1].
Investor optimism gradually returned fueled by stabilizing monetary policy outlooks coupled with improved underlying property fundamentals prompting renewed deal activity among CRE participants including banks, insurance companies, private equity funds alongside mortgage REITs like SEVN competing intensively for attractive credit spread premiums albeit compressed compared to prior periods due to abundant liquidity availability seen across multiple lender categories leading to tighter spreads overall across CRE debt spectrum irrespective of property sector [S1].
SEVN management anticipates acceleration in transactional velocity throughout 2026 based on these factors balanced against lingering inflation concerns potentially tapering economic growth alongside externally generated uncertainty risks emanating from global geopolitical frictions adding cautionary overlay particularly concerning longer-duration asset repositioning initiatives requiring patient capital commitments [S1].
Outlook on Funding Sources, Financing Costs, and Potential Portfolio Expansion
With available liquidity sources comprising roughly $123 million cash plus additional borrowing room under committed Secured Financing Facilities amounting collectively near $350 million at year-end 2025 SEVN exhibits substantial dry powder capacity enabling measured loan origination expansion assuming market conditions remain favorable for capital access without exorbitant price predicates [S6][F1].
Management commentary indicates intentions toward leveraging this borrowing capacity prudently focusing on selective creditworthy investment opportunities identified within their origination pipeline adhering strictly to underwriting criteria maintaining LTV thresholds ensuring robust risk-adjusted return profiles over anticipated holding horizons including potential bridging into longer-duration takeout mortgages [S1][S27]. Equity capital raises became more accessible following the December 2025 Rights Offering fully backstopped by Tremont injecting about $61.5 million net proceeds expanding equity cushion mitigating dilution risks while preserving operational flexibility amidst volatile markets [S7].
Nonetheless access to additional capital depends critically on the common shares’ trading levels relative to book value impacting cost-effectiveness of issuance decisions along with evolving lending environment conditions affecting repo facility terms highlighting ongoing capital acquisition challenges typical among mid-sized mortgage REITs navigating cyclic CRE finance sectors [S1][S10].
Key Risks: Credit Exposure, Liquidity, REIT Compliance, and External Economic Factors
The principal risks confronting SEVN stem from the inherent credit vulnerability associated with transitional CRE loans where redevelopment uncertainties may delay stabilization resulting in deteriorated borrower payment capacity ultimately impairing loan performance risking provisioning increases or principal write-downs reflecting possible impairment recognition requirements under GAAP standards especially if foreclosure scenarios become probable necessitating collateral-based valuation allowances [S25][S16][S11].
Liquidity constitutes another substantial risk governed by ability to maintain uninterrupted access to revolver funding predominantly via master repurchase facilities whose margin calls triggered by adverse collateral valuation shifts could compel rapid debt paydowns constricting operational liquidity reserve buffers jeopardizing dividend sustainability or curtailing new originations if refinancing avenues falter amidst tightening capital markets during cyclical downturns or regulatory changes imposing stricter bank capital requirements reducing appetite for repo participation [S19][S22][S23][S24].
Regulatory compliance imposes further constraints including adherence to IRC REIT qualification tests compelling minimum distribution levels while limiting hedging capabilities that might ordinarily mitigate interest rate risks thereby exposing earnings volatility particularly given dynamic SOFR benchmark fluctuations influencing both asset yields and liability costs disproportionately should mismatch occur between floating rate investment returns and borrowing expense structures despite intended term-index matching efforts described by management policies [S25][S22].
External macroeconomic elements such as sustained inflationary pressures impacting construction input costs delaying project timelines alongside geopolitical uncertainties capable of precipitating broader economic slowdowns compound operational complexity necessitating vigilant monitoring alongside proactive portfolio management intervention strategies leveraged via Tremont expertise alliance aiming at preemptive workout engagement where needed before material credit escalation ensues.
Analyst Watchpoints: Triggers to Monitor in SEVN’s Upcoming Reporting Cycle
Investors evaluating Seven Hills Realty Trust should keep close watch on several key indicators revealing directional trends impacting fundamentals:
- Changes in allowance for credit losses provisioning especially regarding collateral-dependent transitional loans signaling evolving default risks;
- Utilization rates versus availability under master repurchase facilities pointing toward liquidity strain possibilities;
- Compliance status concerning restrictive covenant thresholds including tangible net worth minima and interest coverage ratios that could limit operating flexibility;
- Dividend declarations relative to distributable earnings reflecting resilience or stress;
- Prepayment dynamics shaping reinvestment opportunities whether favorable spreads persist;
- Market perception via share price relative to book value influencing future fundraising prospects;
- Updates on amendments or expansions of secured financing agreements indicating strategic agility addressing maturities/repricing challenges;
- Any material shifts reported regarding borrower financial health feedback loops or restructuring negotiations conveying early warning signals.
Monitoring these metrics will provide actionable forward-looking insights essential for framing both portfolio risk exposures as well as growth vectors embedded within this specialized middle market mortgage REIT niche.
This report synthesizes publicly available SEC filings up through February 19, 2026 related directly to Seven Hills Realty Trust without extrapolation beyond disclosed facts or timelines provided therein.
Disclaimer: This is research-only, informational analysis and not investment advice. It may include AI-generated interpretation and general industry context. Always verify important details using primary sources.
Comments