
SHENGFENG DEVELOPMENT Ltd: Scaling Integrated Logistics Across China with Strategic Capital Discipline
SHENGFENG DEVELOPMENT leverages its expansive logistics network and hybrid asset model to sustain growth amid regulatory and competitive pressures.
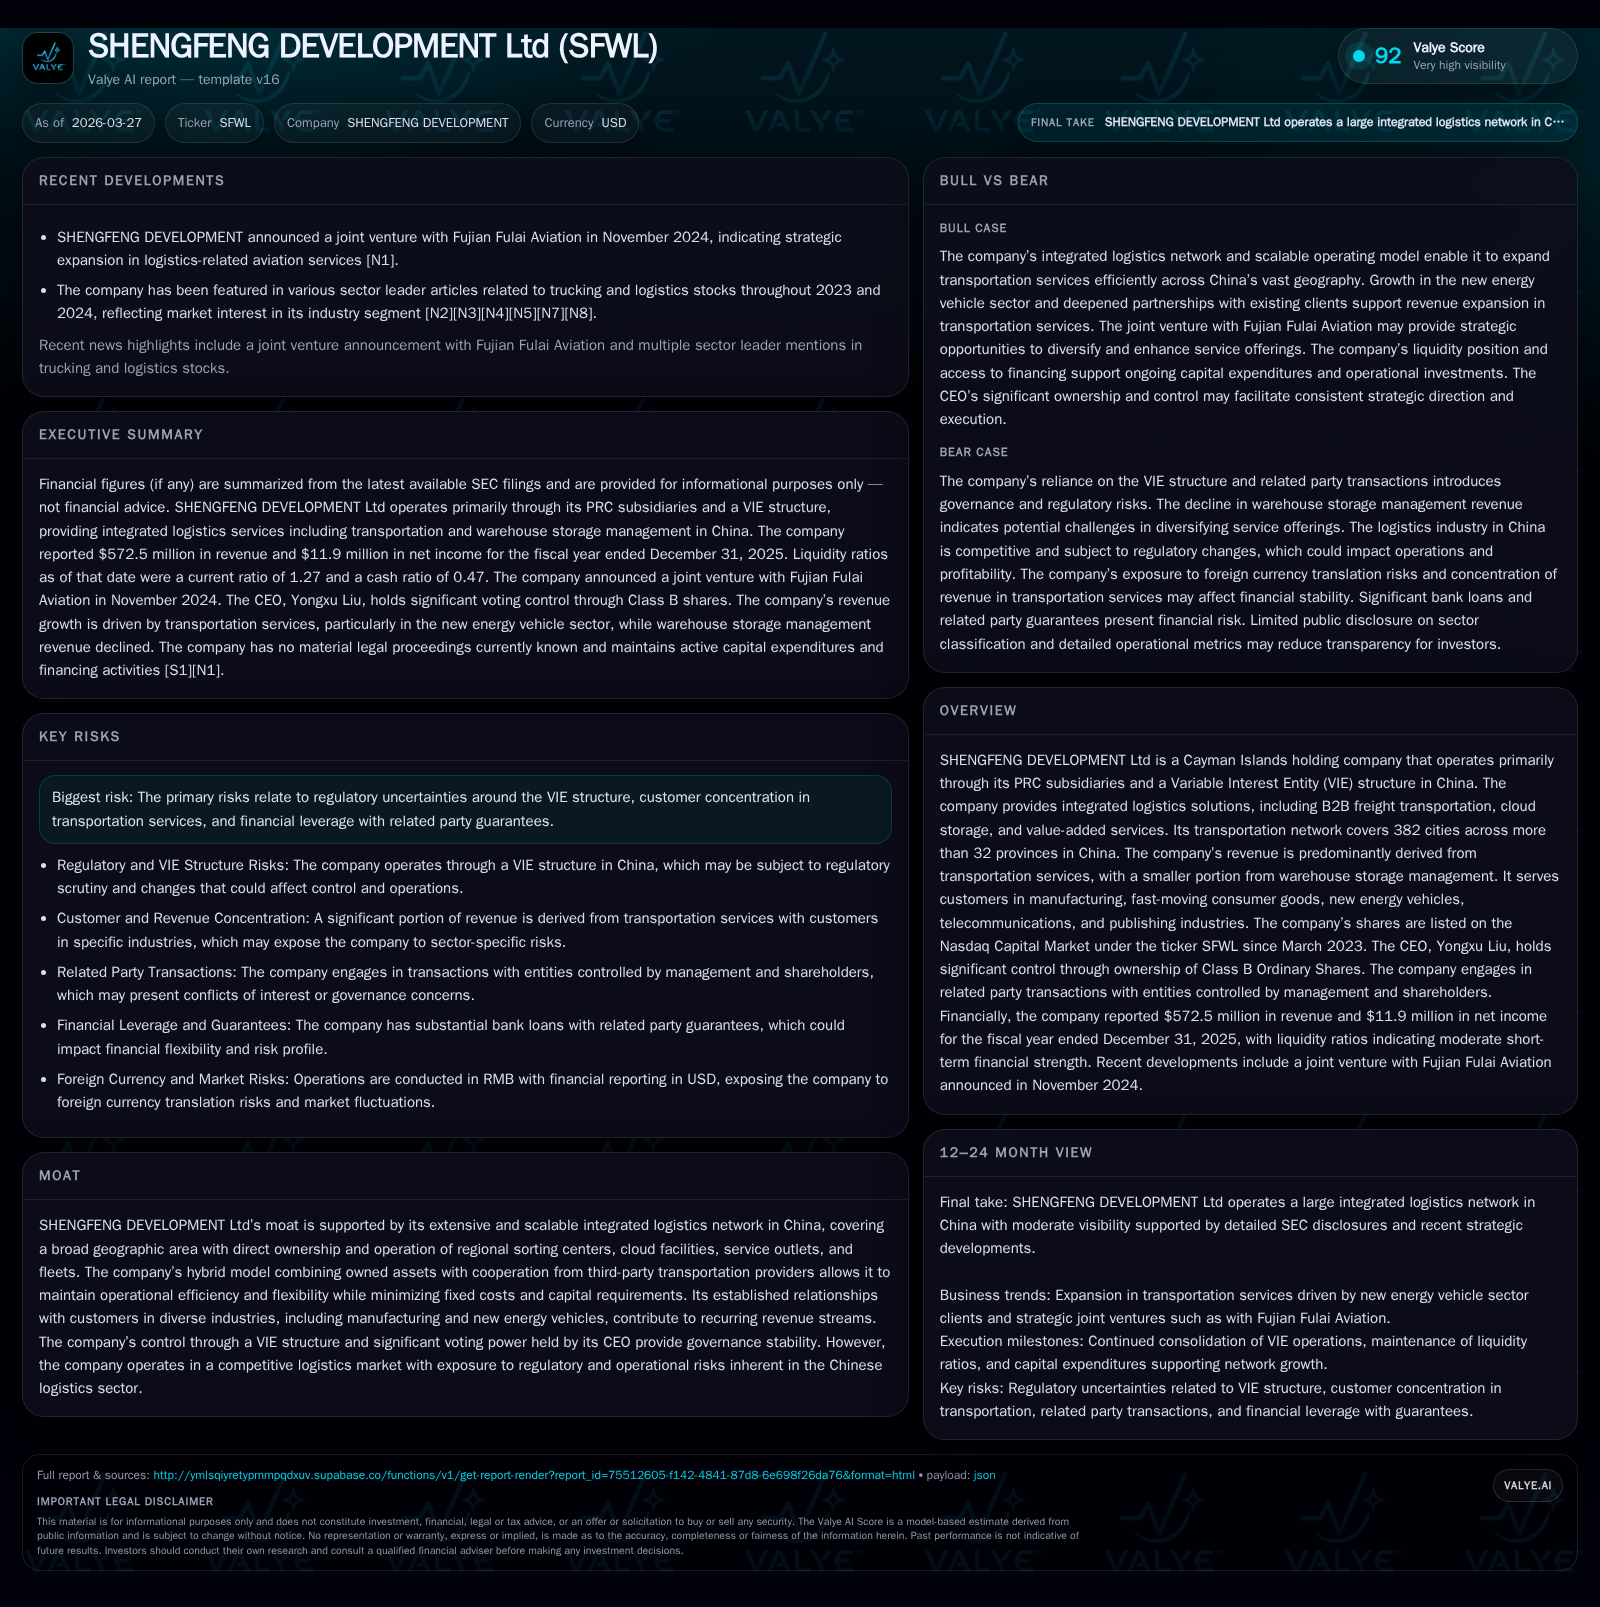
SHENGFENG DEVELOPMENT Ltd operates a vast integrated logistics network covering 382 cities across China through a hybrid model of owned assets and third-party partnerships, fueling revenue growth primarily driven by transportation services. The company has demonstrated consistent double-digit top-line expansion with improving operating income, supported by efficient fleet management and route optimization. While opportunities exist in expanding cloud storage and serving emerging sectors like new energy vehicles, risks from VIE regulatory uncertainty and customer concentration persist. The firm maintains disciplined capital allocation, balancing capex investments with stable operating cash flows but reported negative free cash flow in 2025 due to elevated capex. Governance is centralized under CEO Yongxu Liu who holds decisive voting power, presenting both stability and risk for minority shareholders.
Evolving Revenue Growth: Accelerating Scale in Integrated Logistics
SHENGFENG DEVELOPMENT Ltd has built a formidable presence in China's contract logistics space, extending its service footprint to 382 cities spanning over 32 provinces as of the end of 2025 [S1]. This geographic scale is matched by rapid revenue growth, with net revenues rising from $404 million in FY2023 to $572 million in FY2025, marking robust growth supported primarily by transportation services [F1]. The transport segment contributed approximately $555 million or about 97% of revenues in FY2025, up nearly 15% year-over-year, reflecting deepened relationships with customers primarily in manufacturing, fast-moving consumer goods (FMCG), new energy vehicles, telecommunications, and publishing industries [S6], [S22]. Conversely, revenue from warehouse storage management declined by over 13% in FY2025 to about $14 million as the firm prioritized transportation expansion [S6]. This aligns with broader industry trends favoring integrated freight solutions.
Historical performance (annual)
| FY | Rev ($mm) | Net ($mm) | CFO ($mm) | OpInc ($mm) | Rev YoY | Net YoY |
|---|---|---|---|---|---|---|
| 2025 | 572 | 12 | 16 | 17 | +13.6% | +9.6% |
| 2024 | 504 | 11 | 15 | 15 | +24.8% | |
| 2023 | 404 | 12 | 14 | +9.1% | ||
| 2022 | 370 | 7 | 10 |
Source: SEC companyfacts cache [F1].
Capital returns and efficiency (annual)
| FY | FCF ($mm) | ROE% |
|---|---|---|
| 2025 | -3 | 9.0 |
| 2024 | -14 | 9.3 |
| 2023 | 1 | |
| 2022 | 0 |
Source: SEC companyfacts cache [F1].
Table: Historical Financial Summary FY2022-FY2025 [F1]
Operational Efficiency and Margin Stability
SHENGFENG employs a hybrid asset model that balances owned assets—26 regional sorting centers, 57 cloud offline freight centers (Cloud OFCs), and approximately 420 trucks—with an extensive network of over 122,000 third-party transportation providers [S1], [S16]. This approach reduces fixed cost exposure while maintaining capacity flexibility essential for scaling across China's fragmented logistics markets.
Centralized route planning and transport management systems optimize truck utilization and reduce empty runs—a key driver of operational efficiency [S1], [S22]. Despite an increase in general and administrative expenses by approximately 18% in FY2025 due to wage inflation and professional fees, gross margins remained stable around 9.3%, reflecting disciplined cost control amid competitive pricing pressures [S15], [S22]. Selling and marketing expenses held steady near $6 million annually.
Market Outlook and Regulatory Considerations
Growth prospects are anchored on further penetration into less saturated regions and sectors including new energy vehicles aligned with China’s industrial policies [S1]. While warehouse storage management revenues declined recently, digital initiatives such as cloud storage solutions may offer medium-term upside though no explicit guidance was provided [S1].
The company's offshore holding structure using VIE arrangements introduces regulatory risk common among foreign-listed Chinese firms as PRC government policies evolve [S1]. Investors should remain vigilant regarding potential impacts on capital access or operational permissions.
Capital Allocation: Balancing Growth Investment and Cash Flow
Capital expenditures have fluctuated significantly—from $6.9 million in FY2022 ramping up to nearly $30 million in FY2024 before moderating to $19 million in FY2025—reflecting investment cycles supporting infrastructure expansion [F1], [S3]. Operating cash flow grew steadily but did not fully cover capex in FY2025 resulting in slightly negative free cash flow around -$2.9 million [F1].
The company holds approximately $35 million in cash and equivalents with a current ratio of about 1.27 indicating adequate liquidity despite substantial current liabilities nearing $171 million related mainly to trade payables and debt maturities spread over the next five years [F1], [S4], [S7]. No dividends or share repurchases were reported indicating retained earnings are reinvested to support growth.
Governance Structure Concentration
Governance is highly concentrated with CEO Yongxu Liu controlling over 91% voting power via Class B shares despite holding only about 1.23% of Class A shares outstanding—a dual-class share structure typical for founder-led Chinese ADRs seeking control retention post-listing [S1]. This concentration provides decision-making stability but raises minority shareholder governance risks.
Summary Table: Key Financial Metrics (USD Millions)
| Metric | FY2023 | FY2024 | FY2025 |
|---|---|---|---|
| Revenue | $404 | $504 | $572 |
| Operating Income | $13.9 | $14.7 | $16.9 |
| Net Income | $10.3 | $10.9 | $11.9 |
| Operating Cash Flow | $12.1 | $15 | $16.1 |
| Capital Expenditures | $10.8 | $29.5 | $19 |
| Free Cash Flow (OpCF-Capex) | - | - | -2.9 |
| Equity | $108 | $117 | $132 |
| Approximate ROE (%) | - | - | ~9 |
Source: SEC filings as of December year-end for each fiscal year [F1]
Conclusion
SHENGFENG DEVELOPMENT Ltd demonstrates strong top-line growth fueled by its dominant transportation services segment leveraging a scalable hybrid asset model across China’s vast logistics landscape. The company maintains stable operating margins despite rising costs while investing prudently through its capital expenditure cycles.
Investors should closely monitor fleet capacity developments, capital spending patterns, regulatory risks inherent to the VIE structure, and evolving market dynamics including competition and customer concentration exposures.
Disclaimer: This analysis is based on information available as of March 27, 2026 from SHENGFENG DEVELOPMENT Ltd's SEC filings including Form 20-Fs through December 31, 2025 for informational purposes only without investment recommendations.
Disclaimer: This is research-only, informational analysis and not investment advice. It may include AI-generated interpretation and general industry context. Always verify important details using primary sources.
Comments