
Superior Group’s Revenue Growth Deceleration and Sourcing Challenges Redefine 2025 Outlook
Superior Group's historic brand portfolio and diversified segments confront tariff headwinds, supply chain disruptions, and strategic segment shifts that reshape its near-term financial trajectory.
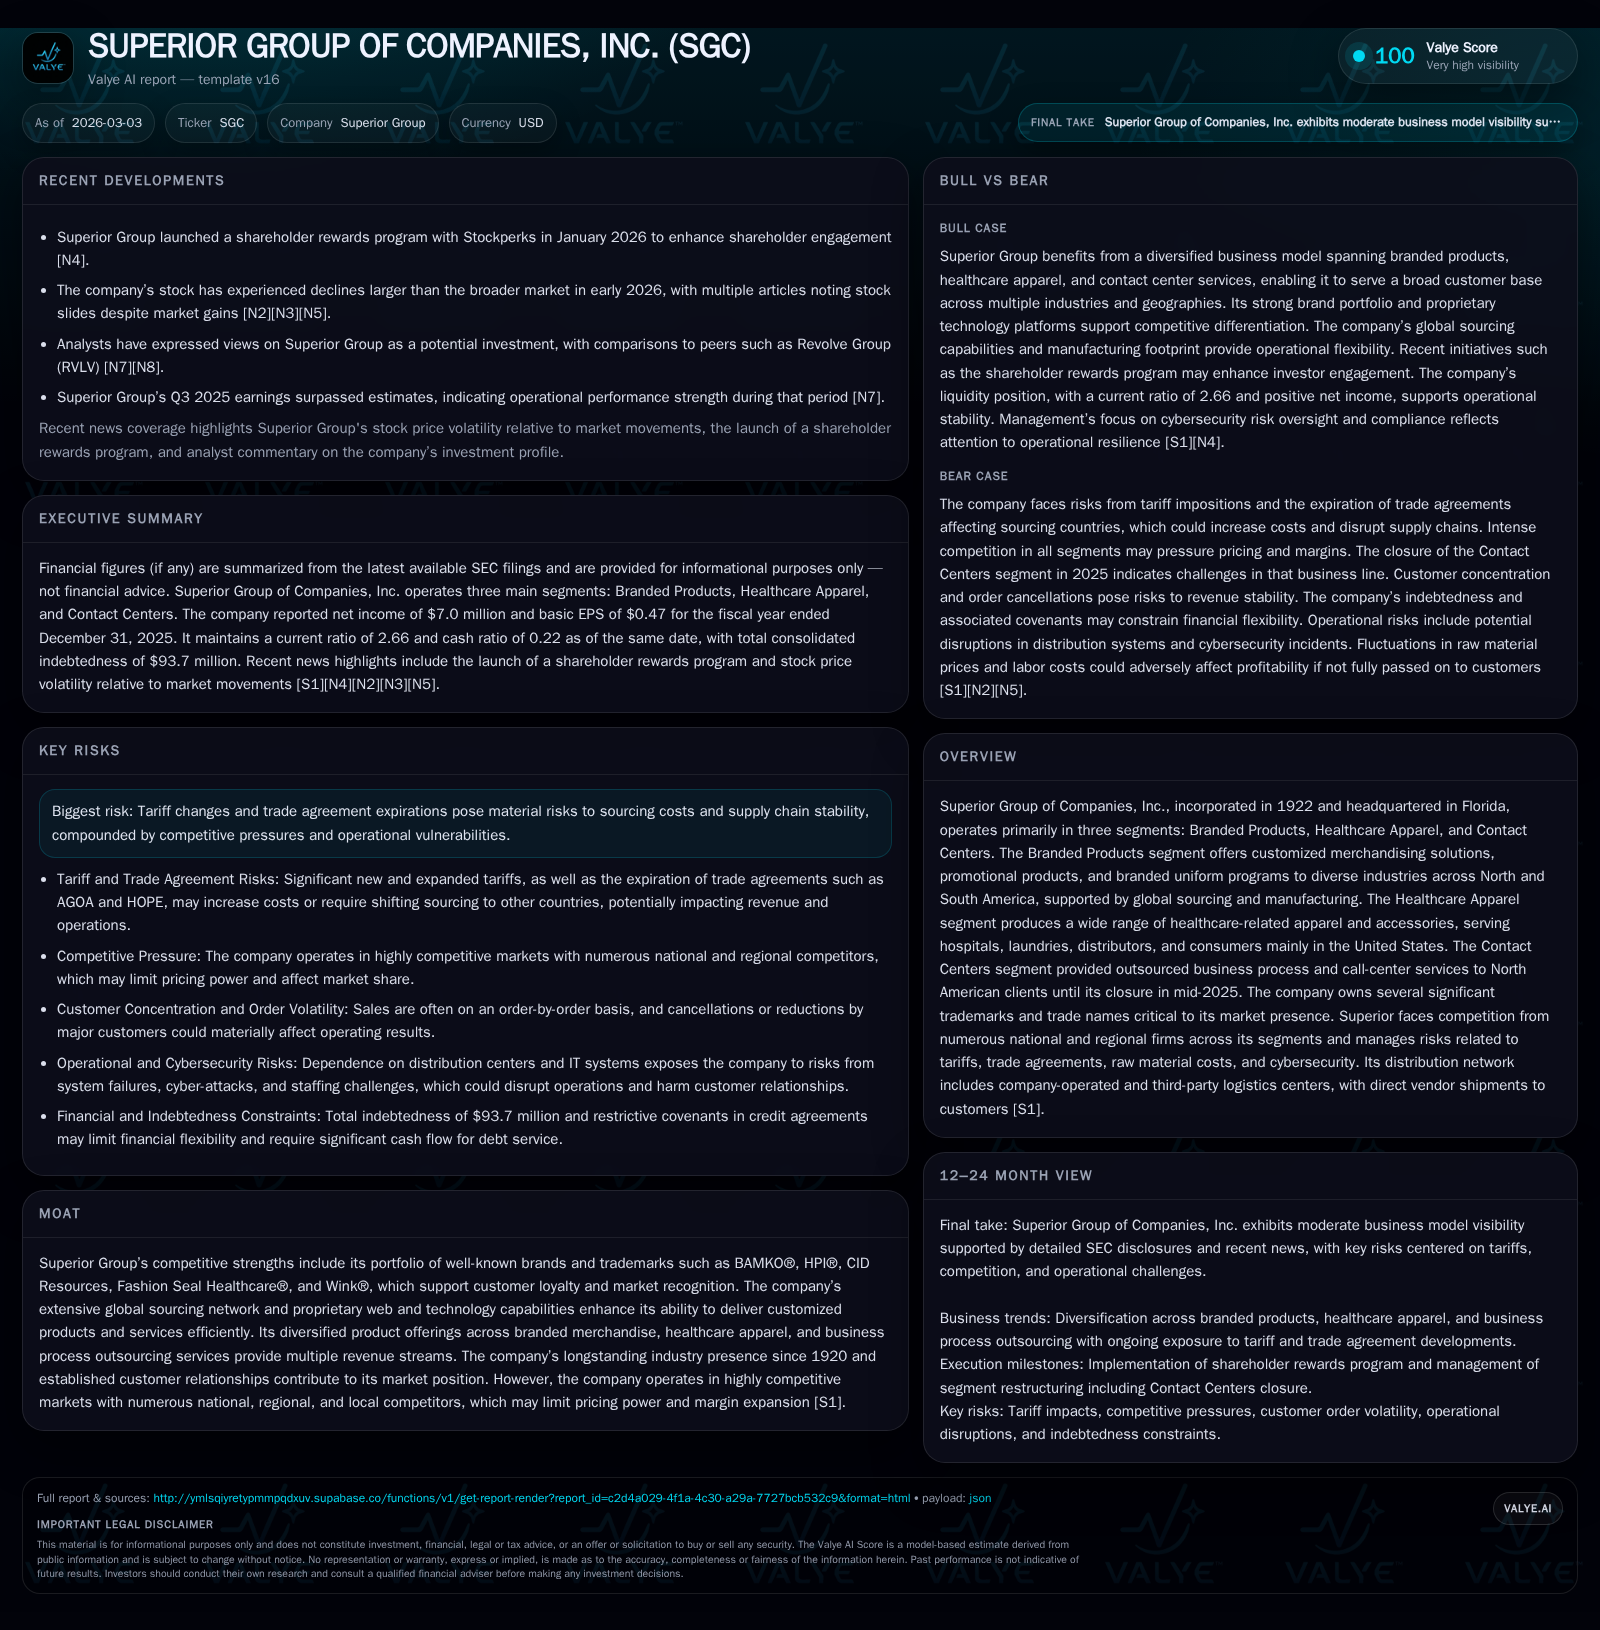
Superior Group of Companies, Inc., with roots dating back to 1922, leverages a robust portfolio of legacy brands across its Branded Products and Healthcare Apparel segments while managing the exit from its Contact Centers business. Despite achieving a 12% revenue increase in 2025, net income declined sharply by approximately 42%, reflecting margin pressures exacerbated by new tariffs and expired trade agreements affecting sourcing costs in key countries such as China and Haiti. The company's global sourcing network and proprietary technology underpin resilience but face challenges as cost pass-through proves difficult amid competitive pricing. Capital allocation remains constrained by leverage, limiting dividends and buybacks despite positive free cash flow generation. Monitoring upcoming trade negotiations, margin recovery post-contact center closure, and technological enhancements will be essential to assessing Superior’s evolving operational outlook.
Legacy Brands and Diversified Segments: Foundations of Superior Group
Superior Group of Companies traces its origins to 1922 and today comprises three principal segments: Branded Products, Healthcare Apparel, and until mid-2025, Contact Centers [S1]. The Branded Products segment is the largest contributor by sales — accounting for approximately 64% of net sales in fiscal year (FY) 2025 [S5]. It offers customized merchandising solutions under well-known trademarks such as BAMKO® and HPI®, producing branded uniform programs alongside promotional products tailored through proprietary web-enabled merchandising platforms designed to support broad industry verticals including retail chain stores, entertainment venues, food service organizations, and transportation companies [S24].
The Healthcare Apparel segment represents around one-fifth of the company's revenues (20% in FY2025) [S5] and delivers mission-critical apparel products — including fashionable scrubs, lab coats, patient gowns, isolation gowns, barrier fabric lab wear, clean room clothing — primarily within the United States market. This unit leverages trademarks like Fashion Seal Healthcare® and Wink® plus the CID Resources trade name to sustain customer loyalty among hospitals, laundries servicing healthcare facilities, distributors and consumers [S24][S18].
Until June 15, 2025, the Contact Centers segment contributed roughly 16% of sales offering outsourced business process outsourcing services through "The Office Gurus®" entities predominantly located nearshore [S15]. Its recent closure reflects a strategic shift away from lower-margin BPO activities to focus on core branded product offerings.
The company’s competitive advantage hinges on this diversified platform supported by a strong portfolio of trademarks that enhance brand recognition and secure customer relationships spanning North America with nascent presence in South America for Branded Products via operations in Brazil [S1][S24]. Additionally, Superior benefits from an extensive global sourcing network spanning countries such as China, Haiti (including own manufacturing), Vietnam, Bangladesh, Madagascar and the United States — a complexity that underscores operational resilience but also exposes it to geopolitical tariff risk [S8].
Growth Performance Through the Years: Revenue, Profit, and Segment Trends
Superior's top-line has progressed steadily over recent years driven by product diversification and market penetration. Using available financial data from FY2017 through FY2025 [F1], annual revenues grew from roughly $72.45 million in FY2017 to an estimated increase resulting in reported top-line growth of about +12% YoY for FY2025 [F1][S6]. Such revenue momentum reflects persistence in branded merchandise demand despite industry cyclicality.
However, this robust revenue expansion masks significant earnings pressure; net income declined noticeably by approximately 41.7% YoY to $7.0 million at FY2025 [F1]. This decline stems primarily from heightened cost structures tied to tariff inflations discussed later as well as operational discontinuities including the Contact Centers segment shutdown reducing scale economies.
Operating cash flows (CFO) followed suit — dropping from $33.4 million in FY2024 to nearly $19.7 million for FY2025 (-41%) even as capital expenditures fell moderately (-11%) over the same period yielding free cash flow near $15.8 million [F1]. The following table displays key annual financial metrics highlighting these trends:
Historical performance (annual)
| FY | Net ($mm) | CFO ($mm) | Capex ($mm) | Net YoY |
|---|---|---|---|---|
| 2025 | 7 | 20 | 4 | -41.7% |
| 2024 | 12 | 33 | 4 | +36.8% |
| 2023 | 9 | 79 | 5 | +127.4% |
| 2022 | -32 | -3 | 11 |
Source: SEC companyfacts cache [F1].
Capital returns and efficiency (annual)
| FY | Div ($mm) | Buybacks ($mm) | FCF ($mm) |
|---|---|---|---|
| 2025 | 9 | 10 | 16 |
| 2024 | 9 | 7 | 29 |
| 2023 | 9 | 74 | |
| 2022 | 9 | 0 | -14 |
Source: SEC companyfacts cache [F1].
Figures marked '-' indicate data not explicitly provided for that year; revenue YoY % is for FY25 vs FY24 where available.
While revenue growth offers some optimism for demand sustainability particularly within branded merchandise customization services (leveraging proprietary web platforms), profitability challenges point towards growing external cost headwinds coupled with internal restructuring impacts.
Impact of Tariffs and Supply Chain Shifts on Operational Costs
Beginning Q2-2025,[S2] details significant new tariffs imposed by U.S authorities primarily targeting imports from China and Vietnam – key sourcing hubs for Superior’s raw materials including cotton/polyester blends crucial for apparel segments [S8]. These tariff expansions impose higher duties directly increasing COGS across both Branded Products (e.g., plastic components supplied principally from China) and Healthcare Apparel fabrics sourced primarily from Chinese producers [S8][S26].
Compounding the cost environment are the September-30-2025 expirations without renewal of pivotal trade agreements such as the African Growth and Opportunity Act (AGOA) alongside Haitian trade preferences under HOPE/HELP acts critical for preferential duty treatment on apparel manufacturing inputs sourced or produced in Haiti [S2]. Without retroactive reinstatements or alternative agreements suppliers face steeper effective tariffs forcing reevaluation of sourcing strategies or absorption of elevated costs.
Superior's sizable global sourcing network partly offsets single country dependence risk; however increased regional duties induce complexities causing fragmented supply chains with added logistical expense combined with volatility that challenge inventory forecasting precision—a known vulnerability given industry seasonally muted yet demand unpredictability risks [S6][S22].
Passing these cost increments downstream remains difficult given pricing elasticity constraints inherent to promotional products markets noted for intense price sensitivity; failure here directly compresses margins even as alternative material substitutions exist only selectively due to required quality standards [S9][S12].
Ongoing management focus includes trade negotiation monitoring with intent to steer imports through tariff-exempt countries or negotiate favorable terms yet uncertainty persists regarding eventual outcomes influencing near-term financial results [S2].
Closing Contact Centers: Strategic Implications and Margin Effects
Mid-2025 witnessed termination of Superior's Contact Centers segment representing about one-sixth (~16%) of total revenues historically but characterized by lower profitability profiles compared with goods-focused divisions [S15]. Closure reduces overall revenue base yet simultaneously eliminates associated labor-intensive operating expenses supporting potentially margin improvement long term.
This business contraction signals refocused capital deployment toward core Branded Products & Healthcare Apparel units better aligned with Superior's legacy competencies leveraging branded intellectual property assets tightly integrated with manufacturing capabilities [N3][S1][S15].
Short term impact includes lost service revenue offset variably via cost savings measures capturing overhead reductions especially payroll burdens; however effect on cash flow inflows is mixed due to contracted earnings stream loss requiring careful working capital management during transition [N3]. Ultimately margin pressure relief depends on ability to grow merchandise businesses sufficiently absorbing fixed cost footprint.
Future Growth Prospects: Dependence on Renewed Trade Preferences and Market Demand
Looking ahead Superior’s growth relies heavily on resolution or mitigation around evolving U.S.-global trade policies affecting tariff scopes especially involving China/Vietnam/Haiti; renewal prospects currently uncertain given expiration timing late-2025 without confirmed extensions at filing date prompting scenario analyses internally [N2][N5][S2][S1].
Continued demand momentum hinges on success commercializing proprietary customization technologies enabling scalable branded marketing program solutions sustaining client retention/expansion particularly within retail & food chains sensitive to employee incentive programs amid economic fluctuations.
Meanwhile healthcare apparel demand might leverage aging demographic trends alongside institutional focus on infection control driving specialty garment requirements although competitive intensity places downward pressure on pricing trajectory necessitating operational efficiency gains [N2][S1].
Unanticipated macroeconomic shocks or persistent supply chain constraints could cap achievable growth rates underscoring importance monitoring forward guidance updates or milestone disclosures related to contract wins or technology roll-outs relevant leading indicators absent explicit formal forecasts disclosed currently.
Capital Allocation Amid Debt Leverage: Dividends, Buybacks, and ROE Analysis
Despite generating positive EBITDA streams yielding CFO near $19.7 million after capex ($3.95 million) resulting in $15.8M free cash flow for FY25 Superior faces meaningful debt leverage restraint evidenced by outstanding borrowings totaling roughly $93.7 million as at December-31-2025 constraining liquidity flexibility per credit agreement covenant stipulations restricting discretionary spend [F1][S4][S23].
Shareholder returns reflected disciplined approach with dividends totaling approximately $8.91M complemented by share repurchases around $10.14M executed during FY25 indicating measured efforts at capital distribution considering leverage limitations [F1][N4][S4].
ROE approximated at a subdued ~3.6%, derived from net income reported against shareholders' equity base totaling about $192.82 million end-FY25 consistent with tighter margin environment restricting equity earnings accretion pace for investors [F1].
Operating restrictions embedded in debt covenants curtail additional borrowings plus limit dividend increases or buyback expansions pending deleveraging progress necessitating conservative capital deployment prioritizing balance sheet stability whilst exploring organic growth reinvestment opportunities.
Financial Health Spotlight: Cash Flows, Liquidity, and Debt Covenants Review
Liquidity metrics remain sound with a current ratio near a robust ~2.66 signalling comfortable near-term asset coverage over liabilities promoting ongoing operational flexibility albeit tempered by sizeable debt service obligations detailed above [F1][S4][S7][S28].
Investments focused chiefly on maintaining distribution center efficacy reflecting capex moderation versus prior periods aligning with steady-state facility upkeep instead of expansion projects further supporting controlled capital intensity narratives[F1][S21].
Operational resilience also depends on managing risks linked to supply chain disruption potential ranging from geopolitical instability through natural disasters affecting critical production sites notably Haiti facility exposure; management maintains multi-sourcing strategy alongside business interruption insurance aiming at mitigation though gaps persist inherent given unique geographic footprints[S20][S22].
Financial covenant compliance remains critical; failure triggers default events potentially accelerating lender demands or interest rate penalties placing premium importance upon continue cash generation discipline exploiting inventory optimization plus receivables collection efficiencies.[S4][S23]
Risks Around Competitive Pressures and Regulatory Changes to Monitor
Competitive dynamics are fierce across all segments especially promotional products where national/regional competitors such as HALO Branded Solutions Inc., BDA Inc., Staples Inc., Cimpress PLC wield greater purchasing scale driving price compression pressure forcing Superior periodic gross margin concessions[S13][S16]
Healthcare apparel faces competition from Medline Industries Inc., FIGS Inc., Barco Uniforms Inc., among others resulting in analogous pricing & product innovation battles constraining premium pricing adherence[S13]
At regulatory front tariff policy volatility generates revenue/cost unpredictability compelling constant sourcing adjustments complicating longer-term planning[S11][S26][S29] Data privacy/security law escalations also impose incremental compliance costs elevating operational risk profiles[S25] Environmental regulations remain less impactful historically but warrant vigilance for future changes influencing manufacturing compliance costs[S17] Market shifts toward automation/AI may further erode BPO market attractiveness evident with contraction/closure decision[S15] Monitoring these evolving risks crucial helps anticipate margin erosion episodes vs strategic repositioning responses.
Investor Takeaways: What to Watch in Upcoming Quarters
Upcoming quarters warrant attention toward several key catalysts:
- Progress updates on trade deal renewals affecting tariff reinstatements or easing impacting input costs directly influencing gross margins[N2]
- Post-Center closure earnings releases will reveal margin recovery trajectory vs revenue base contraction effect overlay[N3]
- Deployment status/performance impacts from proprietary web-enabled merchandising technology wielding competitive differentiation expected contributing topline resilience[S1]
- Credit facility covenant status reports signaling balance sheet health underpinning capacity for future shareholder return programs[N4][S4]
- Volatility stemming from geopolitical events like Middle East conflicts posing inflation/input cost risk layers requiring close scrutiny[S11] These developments collectively inform evolving investment considerations reflecting Superior’s ability to navigate cyclical headwinds while leveraging enduring legacies.
This analysis synthesizes available data without predictive recommendations; readers should consider it informational rather than investment advice.
Disclaimer: This is research-only, informational analysis and not investment advice. It may include AI-generated interpretation and general industry context. Always verify important details using primary sources.
Comments