
Shoals Technologies Balances Growth Potential Against Supply and Warranty Risks
Shoals Technologies leverages patented solar EBOS solutions while managing supply chain and warranty challenges impacting near-term performance.
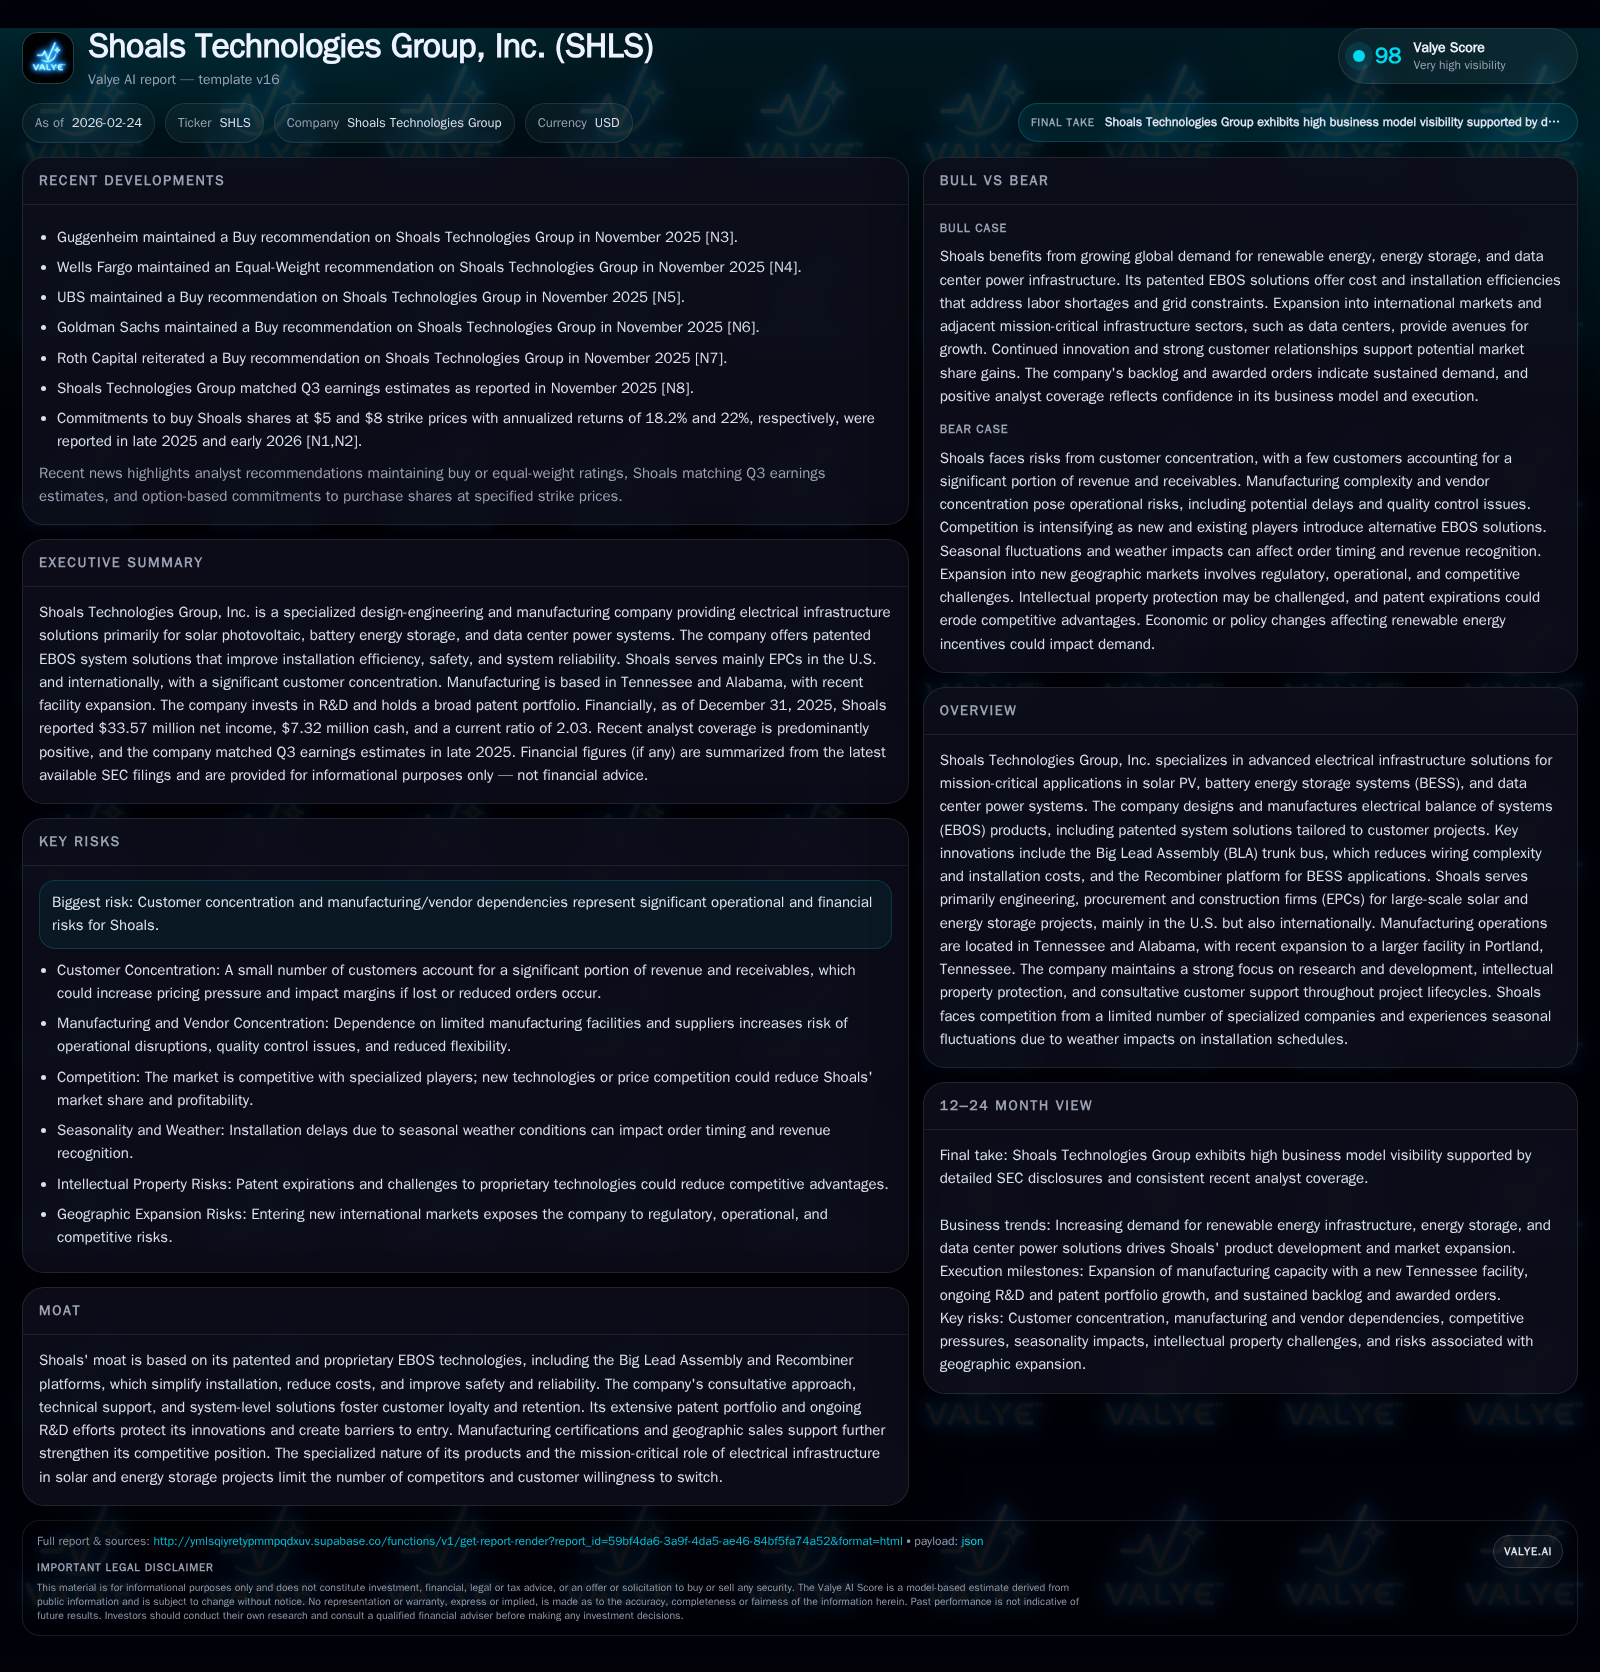
Shoals Technologies Group, Inc. (SHLS) has developed a defensible niche in electrical balance of systems (EBOS) products for solar, battery energy storage, and data center power applications through proprietary technologies. The company’s growth is underpinned by rising demand for renewables and energy infrastructure but tempered by solar project delays, concentrated customer exposure, and a significant warranty liability from defective wire products. Recent capacity expansion supports scale, yet cash flow pressure from remediation costs and increased capex constrains financial flexibility. Shoals’ strong patent portfolio and consultative sales approach provide competitive moats; however, execution risks around manufacturing ramp-up and international trade policies remain salient. Investors should monitor backlog conversion, resolution of the Prysmian litigation, and the pace of BESS and data center market penetration.
Company Overview
Shoals Technologies Group, Inc. (Nasdaq: SHLS) operates as a specialized design-engineering and manufacturing firm providing advanced electrical infrastructure solutions primarily for utility-scale solar photovoltaic (PV), battery energy storage systems (BESS), and emerging mission-critical applications in data centers. Central to its offering is electrical balance of systems (EBOS), which encompasses all components required for powering the transmission path from solar arrays or battery storages to inverters and ultimately to the grid.
Since its founding in 1996, Shoals has built a moat around proprietary EBOS technologies such as its patented Big Lead Assembly trunk bus that reduces wiring complexity and installation cost, as well as its Recombiner platform for BESS systems [S1][S9]. This system-level approach integrates customs engineering, project-specific product design, installation efficiency enhancements, and post-installation technical support — factors that earn significant customer loyalty among engineering procurement and construction firms (EPCs) in the U.S., which constitute its primary customer base.
Manufacturing footprint spans facilities in Tennessee and Alabama with a recent expansion into a new 638,000-square-foot consolidated facility in Portland, Tennessee aimed at streamlining operations and scaling capacity [S5][S19].
Historical Performance
Financial disclosures provide insight primarily on profitability metrics rather than detailed revenue figures. Shoals posted operating income of $56.4 million in FY2025, reflecting a 10.2% increase versus FY2024’s $51.2 million [F1]. Net income rose notably by 39.2% to $33.6 million from $24.1 million year-over-year [F1]. These gains were achieved despite mounting warranty costs that pressured profitability earlier.
Operating cash flow contracted significantly by 78.8% to $17.1 million in FY2025 from $80.4 million in prior year [F1]. Capex jumped close to threefold from $8.4 million to $33 million as the company invested heavily in its manufacturing expansion [F1]. Consequently, free cash flow was negative by roughly $16 million last year.
Historical performance (annual)
| FY | Net ($mm) | CFO ($mm) | OpInc ($mm) | Capex ($mm) | Net YoY |
|---|---|---|---|---|---|
| 2025 | 34 | 17 | 56 | 33 | +39.2% |
| 2024 | 24 | 80 | 51 | 8 | -39.6% |
| 2023 | 40 | 92 | 79 | 11 | -68.7% |
| 2022 | 128 | 39 | 66 | 3 |
Note: Omitted columns lack sufficient annual XBRL coverage in the provided tags (need ≥2 annual points): Rev, Div. Source: SEC companyfacts cache [F1].
Capital returns and efficiency (annual)
| FY | Buybacks ($mm) | FCF ($mm) | ROE% |
|---|---|---|---|
| 2025 | 0 | -16 | |
| 2024 | 25 | 72 | |
| 2023 | 81 | 7.3 | |
| 2022 | 36 | 43.8 |
Source: SEC companyfacts cache [F1].
Note: Revenue unavailable in provided filings; Buybacks omitted due to zero activity in latest year.
ROE stands at approximately 6% based on net income relative to year-end equity of ~$544 million reported through FY2023 [F1]. The relatively modest ROE paired with cash flow compression indicates capital is tied up amidst growth investments and warranty issues.
Growth Prospects
Shoals targets sustained demand growth driven by escalating global renewable energy deployment trends augmented by emerging applications like grid-scale battery storage and AI-driven data centers [S9][S18]. Its ongoing R&D emphasis on proprietary platforms tailored for BESS and data center power is designed to capture these adjacent market opportunities.
Nevertheless, the solar industry cyclicality persists with notable project delays experienced throughout recent years tied to permitting bottlenecks, supply chain disruptions, shifting trade policies including anti-dumping tariffs, financing hurdles, and uncertainties around government incentives like the IRA [S1][S25]. Such delays have deferred near-term orders impacting Shoals’ rollout cadence.
The company commands roughly half its revenue from just five key customers with the largest accounting for around one-fifth overall [S5][S6]. While this concentration can enable scale efficiencies through deeper partnership engagements, it also exposes the firm to pricing pressure risk or order volatility should large customers delay or cancel projects.
In addition to geographic diversification efforts—extending sales presence into Southern Europe, Latin America, Australia-Pacific—and vertical expansion into OEM markets for specialized electrical components [S5][S16], executive commentary highlights persistent lead times exceeding a year due to the custom-engineered nature of EBOS solutions [S9], complicating throughput acceleration.
Key Risks & Challenges
A material near-term headwind is the estimated warranty provision of approximately $73 million stemming from defective wire insulation shrinkback associated with products manufactured using Prysmian cables [S12][S13]. This issue carries operational disruption risk given labor intensity for field inspections and replacements alongside exposed product liability concerns with zero insurance coverage on such claims.
Shoals has filed a lawsuit against Prysmian; however potential recovery remains uncertain both legally and temporally [S12]. The company’s failure to fully recoup remediation costs could materially impair margins going forward.
Manufacturing integration into the new consolidated Tennessee facility presents scale benefits but also operational risks including potential inefficiencies during ramp-up phases such as quality control lapses or supply chain interruptions exacerbated by vendor concentration constraints [S19][S20]. The addition of advanced manufacturing capabilities must stabilize without adversely affecting order fulfillment timelines.
Trade policy volatility involving tariffs or embargo modifications especially between U.S-China relations generates input cost unpredictability for imported raw materials—a vulnerability given component sourcing outside domestic boundaries [S10][S14]. Currency fluctuations add another layer of foreign exchange exposure.
On intellectual property frontiers while patent protections covering most product innovations extend beyond next decade [S24], ongoing infringement litigation itself introduces considerable legal expense uncertainty alongside possible limitations should patents be invalidated or circumvented by competitors [S21][S25].
Lastly cybersecurity risks loom given reliance on IT systems internally plus third-party vendors essential for operations; though no material incidents reported so far [S16], heightened AI-enabled attacks heighten threat levels requiring continuous controls investment.
Capital Allocation & Financial Health
Shoals’ capital deployment strategy reflects aggressive reinvestment focused on expanding production footprint aligned with anticipated future capacity needs as demonstrated by tripling capex spend between FY2024-FY2025 [F1]. Yet free cash flow returned negative territory signaling tight liquidity dynamics requiring cautious working capital management.
Though authorized for up to $150 million share repurchase program since mid-2024 only about $25 million has been executed primarily before ramped capital spending reduced excess cash availability; no buybacks occurred during FY2025 [F1][S26]. Dividends are not currently paid underscoring prioritization of reinvestment over distributions.
Leverage levels include nearly $137 million revolving loans outstanding under senior secured credit agreements imposing financial covenants restricting certain business activities; failure here could impair operational flexibility if adverse market conditions arise [S15][S27].
Liquidity ratios appear sound with current assets double current liabilities providing short-term buffer; however medium-term credit access depends on maintaining positive earnings trajectory amidst sector cyclicality.
Outlook & What To Watch For
Key metrics warrant close observation include backlog progression which totaled $748 million as of December-end 2025—a record elevated level—increased from prior years yet conversion timing remains uncertain due to persistent EPC project execution delays caused by external market forces such as macroeconomic uncertainties or regulatory shifts [S18][S22].
Resolution progress regarding Prysmian litigation outcomes influencing warranty accrual adjustments will significantly impact profitability forecasts.
Expansion success into data center power systems via newer product offerings like Recombiner variants tailored specifically for these clients would signify important diversification away from solar-centric business exposure [S9].
Improvements in operational efficiency stemming from fully integrated manufacturing at Portland facility will be critical to optimize margins potentially offsetting input cost inflation impacting raw material prices globally.
Industry developments regarding tariff regimes or incentive programs around clean electricity investment could dramatically swing project economics shaping order inflows going forward requiring ongoing scenario revisiting by management.
Finally continuing evolution within R&D pipelines evidencing breakthrough features maintaining Shoals’ technological edge relative to competitors will underpin sustainable differentiation critical given intensifying competition landscape featuring both incumbent providers and newer entrants seeking portions of this specialized niche segment [S11][S24].
Conclusion
Shoals Technologies Group exhibits commendable technological leadership through proprietary EBOS platforms supporting growing clean energy infrastructure needs while navigating substantial short- term headwinds emanating from warranty liabilities linked to supplier defects, manufacturing consolidation challenges, competitive pressures amplified by high customer concentration risk profile, and external trade policy uncertainties.
While historical profit gains illustrate operating leverage potential, negative free cash flows induced by elevated capex weigh on liquidity cushions stipulating prudent capital deployment going forward.
The company’s performance will hinge critically on its ability to convert backlog amid sector-wide execution delays; manage warranty remediation effectively; stabilize expanded manufacturing footprint; extend product reach into adjacent fast-growth markets including data centers; and defend intellectual property amidst an evolving technological contest.
Monitoring operational cadence against these vectors offers insight into Shoals’ medium-term financial health trajectory within an industry undergoing rapid structural transformation toward decarbonization-led electrification demands.
This report is prepared solely for informational purposes without any recommendation regarding securities transactions or investment decisions relating thereto.
Disclaimer: This is research-only, informational analysis and not investment advice. It may include AI-generated interpretation and general industry context. Always verify important details using primary sources.
Comments