
Sphere Entertainment Co. Surpasses Q1 Revenue Expectations with Distinct Venue Strength
Strong Q1 2026 results underscore Sphere Entertainment's unique venue assets and diversified revenue streams amid capital structure challenges.
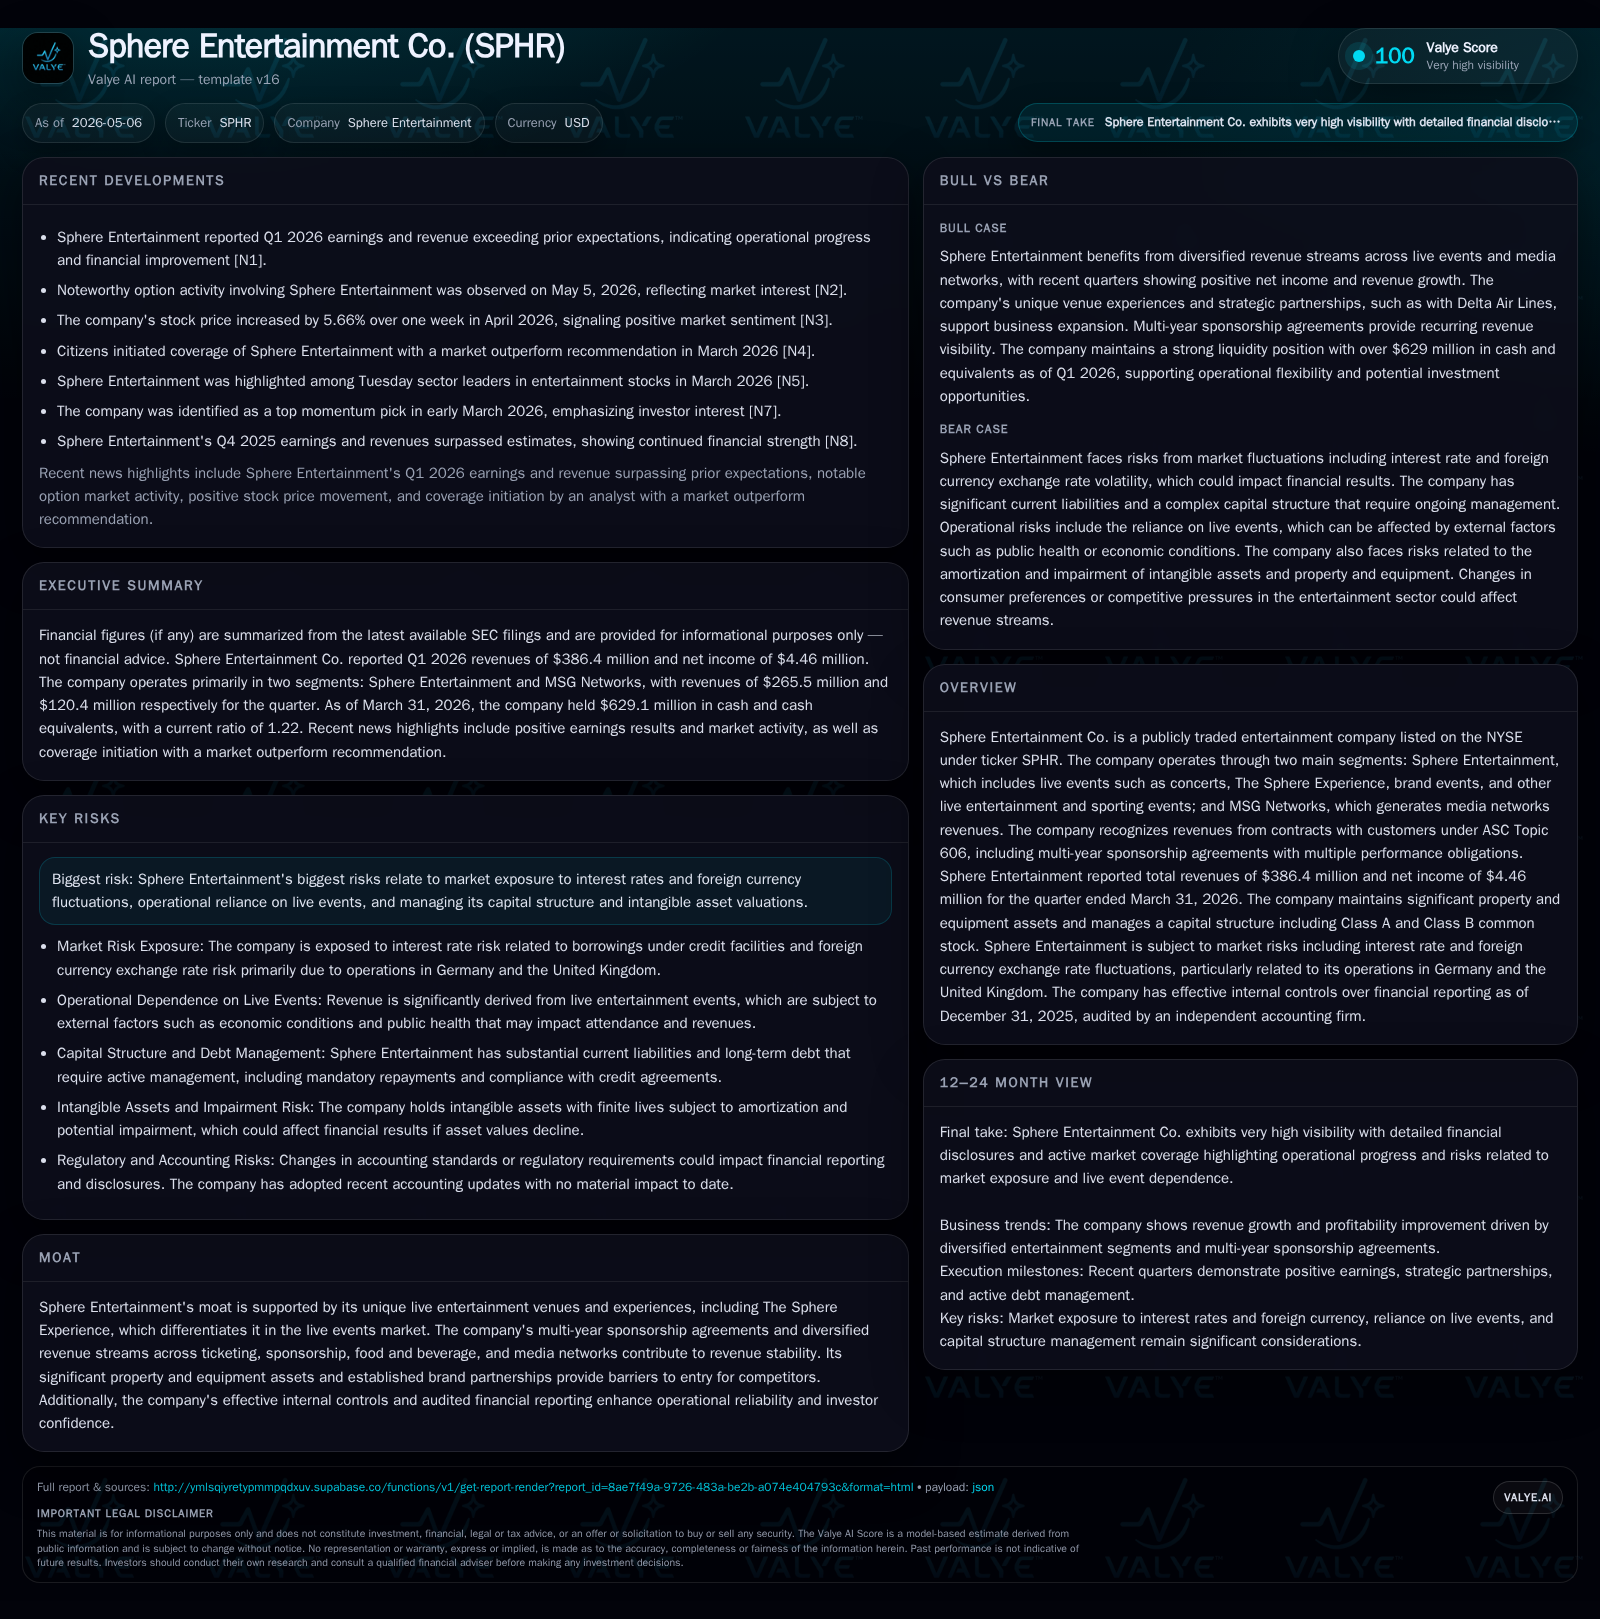
Sphere Entertainment Co. reported a solid financial turnaround in Q1 2026, posting $386 million in total revenues and returning to net income of $4.46 million, driven by robust performance in live events and its MSG Networks media segment. The company's proprietary venues, notably The Sphere Experience, alongside long-term sponsorship contracts and diverse revenue sources (ticketing, concessions, and media), underpin its differentiated market position. However, exposure to interest rate fluctuations, foreign currency risks, and reliance on successful live sporting and entertainment events present ongoing operational challenges. Upcoming milestones include monitoring sponsorship renewals, accounting standard impacts, and debt covenant compliance.
Latest Quarterly Operating Highlights and Implications
Sphere Entertainment's latest filing dated May 5, 2026 (10-Q) reveals a notable operational improvement for the first quarter ended March 31, 2026. Total revenues reached $386.4 million supporting a return to net income of $4.46 million compared to a loss exceeding $81 million in the prior-year comparable period [S2][S3]. This recovery was driven primarily by the Sphere Entertainment segment's execution on live events—covering concerts, branded experiences including The Sphere Experience—and a seasonal uptick in MSG Networks media advertising revenues linked to live NBA and NHL sports programming inventories sold predominantly in Q1 and Q4 [S2][S3].
Accounting updates disclosed in the filing detail ongoing evaluation of FASB pronouncements scheduled for adoption by late-decade periods — these include changes affecting disclosures on expense disaggregation (effective FY 2027) and capitalization criteria for internal-use software (effective FY 2028). While adoption is not expected to materially affect financials immediately, vigilance over these changes will be necessary for forward-looking analyses [S2][S4].
Business Model Overview: Live Events, Media Networks, and Sponsorship Ecosystem
Sphere Entertainment operates as an integrated live entertainment and media company with two core segments: Sphere Entertainment focusing on live experiences such as concerts, The Sphere Experience venue operations, brand activations, and various sporting events; MSG Networks delivering media network revenues through rights sales and advertising tied to professional sports content [S1][S2]. The company’s revenue model rests fundamentally on several pillars:
- Ticketing & Venue Licensing Fees: Revenue generated from event ticket sales plus licensing fees charged for venue use.
- Multi-year Sponsorship Agreements: Contracts involving multiple performance obligations under ASC Topic 606 provide predictable income streams extending beyond single event cycles.
- Food, Beverage & Merchandise Sales: Ancillary revenue derived from concession offerings during live events.
- Media Network Advertising & Rights Fees: Revenues primarily from advertising slots sold within MSG Networks' NBA/NHL coverage.
This diversified model mitigates substitution risk typical in single-stream entertainment companies by blending long-term sponsors with experience-driven consumer spending. Multi-year contracts underpin revenue visibility while granting pricing leverage across sponsorship signage, suite licensing, and advertising inventories [S1][S2].
Competitive Moat and Industry Positioning Through Signature Venue Assets
A vital competitive advantage for Sphere emerges from its ownership and operation of differentiated live event venues — notably The Sphere Experience — which support unique immersive entertainment offerings unmatched by most competitors in scale or technological innovation [S1]. These proprietary venues require substantial capital investment in property and equipment that create formidable entry barriers for new entrants.
The integration with MSG Networks provides additional ecosystem strength through cross-promotional opportunities and stable contractual relationships with sports leagues. Brand partnerships cultivated via long-term sponsorships generate switching costs for clients given the exclusivity binding them to specific signage rights and suite licenses within these iconic venues [S1]. These elements combine to shape an economic moat resistant to commodity-style competition.
Key Growth Drivers: Sponsorship Agreements, Expanding Venue Footprint, and Media Opportunities
Growth at Sphere hinges on multiple interrelated drivers:
- Renewal/Expansion of Multi-Year Sponsorship Contracts: These longer-term deals ensure sustained revenue visibility even amid cyclical fluctuations in event frequency.
- Recovery & Expansion of Live Event Attendance: Post-pandemic demand resurgence supports higher utilization across venues fueling ticketing gains plus ancillary spend on concessions.
- Media Advertising Upsides: As NBA/NHL seasons drive heightened live viewership during key quarters (Q1/Q4), targeted advertising inventory sales bolster MSG Networks results.
- Potential Geographic/Product Line Expansion: While no explicit recent announcements anchor this currently, legacy filings suggest possibilities remain regarding broadening Sphere’s footprint or extending brand experiences.
Measured operating KPIs such as backlog of signed sponsorship agreements or event bookings were not specified but remain relevant monitors [S2][S1].
Risks and Operational Challenges: Market Exposure, Debt Structure, and Event Dependence
Risks spotlighted by management primarily target three domains:
- Financial Leverage & Credit Facility Restrictions: The amended credit agreement for MSG Networks classified as troubled debt restructuring carries an interest rate around 8.77% plus penalty default rates. Covenants impose strict limits on capital allocation choices including dividend payments or incurring additional debt; mandatory cash sweeps further constrain free cash flow flexibility [S2].
- Interest Rate Sensitivity: Floating components of the credit facilities expose the company to incremental interest expense volatility if rates rise materially beyond current levels [S1].
- Foreign Currency Risks: Operations in Europe—via Holoplot acquisition in Berlin—as well as currency exposures related to previous U.K.-based real estate investments introduce earnings volatility through FX translation effects primarily involving the Euro and British Pound Sterling [S1].
- Operational Dependence on Successful Live Events: Although diversified somewhat by media revenues and sponsorships, the business remains sensitive to consumer attendance patterns influenced by broader economic conditions or unexpected disruptions.
What Investors Should Watch Next: Guidance, Strategic Execution, and Market Signals
Key near-term monitoring areas encompass:
- Q2 Operational Guidance Updates: Confirmation of sustaining revenue momentum or indications of sector cyclicality.
- Outcomes & Terms of Sponsorship Renewal Cycles: Clarity around contract extensions or expansions that influence forward-looking revenue streams.
- Accounting Standards Adoption Impact Transparency: Particularly as new ASUs around software capitalization (effective FY 2028) come closer—this may affect internal capital expenditure recognition or expense line classification.
Additionally, market reception to upcoming quarterly reports and event schedules will serve as demand barometers influencing strategic initiatives [S2][S3].
Financial Profile Snapshot: Liquidity, Leverage, and Cash Flow Dynamics
Latest financial snapshot
| Metric | Value | Period |
|---|---|---|
| Cash & equivalents | $629mm | |
| 2026-03-31 | ||
| Current assets | $904mm | |
| 2026-03-31 | ||
| Current liabilities | $743mm | |
| 2026-03-31 | ||
| Current ratio | 1.22x | |
| 2026-03-31 |
Source: SEC companyfacts cache [F1].
As of March 31, 2026:[F1]
- Cash & equivalents: $629.1 million
- Current assets: $903.6 million
- Current liabilities: $742.7 million (current ratio ~1.22)
The company demonstrated strong operating cash flow generation with $136 million provided by operating activities in Q1 versus just $6 million year-over-year prior period—a sign of improving operational efficiency despite ongoing debt service costs [S2].
Interest expense pressure persists with noted effective rates at nearly 9% on term facilities plus potential default interest penalties that underscore refinancing need vigilance [S2]. Mandatory amortization schedules and cash sweeps further highlight constrained financial leeway but also signify disciplined deleveraging commitment [S2].
This balance-sheet profile indicates solid near-term liquidity but elevated leverage metrics recommend close tracking relative to earnings growth trajectories fostering sustainable deleveraging over time.
This analysis is based solely on publicly available information including recent SEC filings up to May 5, 2026 ([S1]-[S29]) and company facts snapshots ([F1]). It does not constitute investment advice or recommendations.
Disclaimer: This is research-only, informational analysis and not investment advice. It may include AI-generated interpretation and general industry context. Always verify important details using primary sources.
Comments