STAG Industrial’s Financial Strength and Dividend Focus Amidst Industry Ambiguity
An analytical deep dive into STAG Industrial's recent financial performance, dividend consistency, and competitive positioning within the opaque industrial real estate landscape.
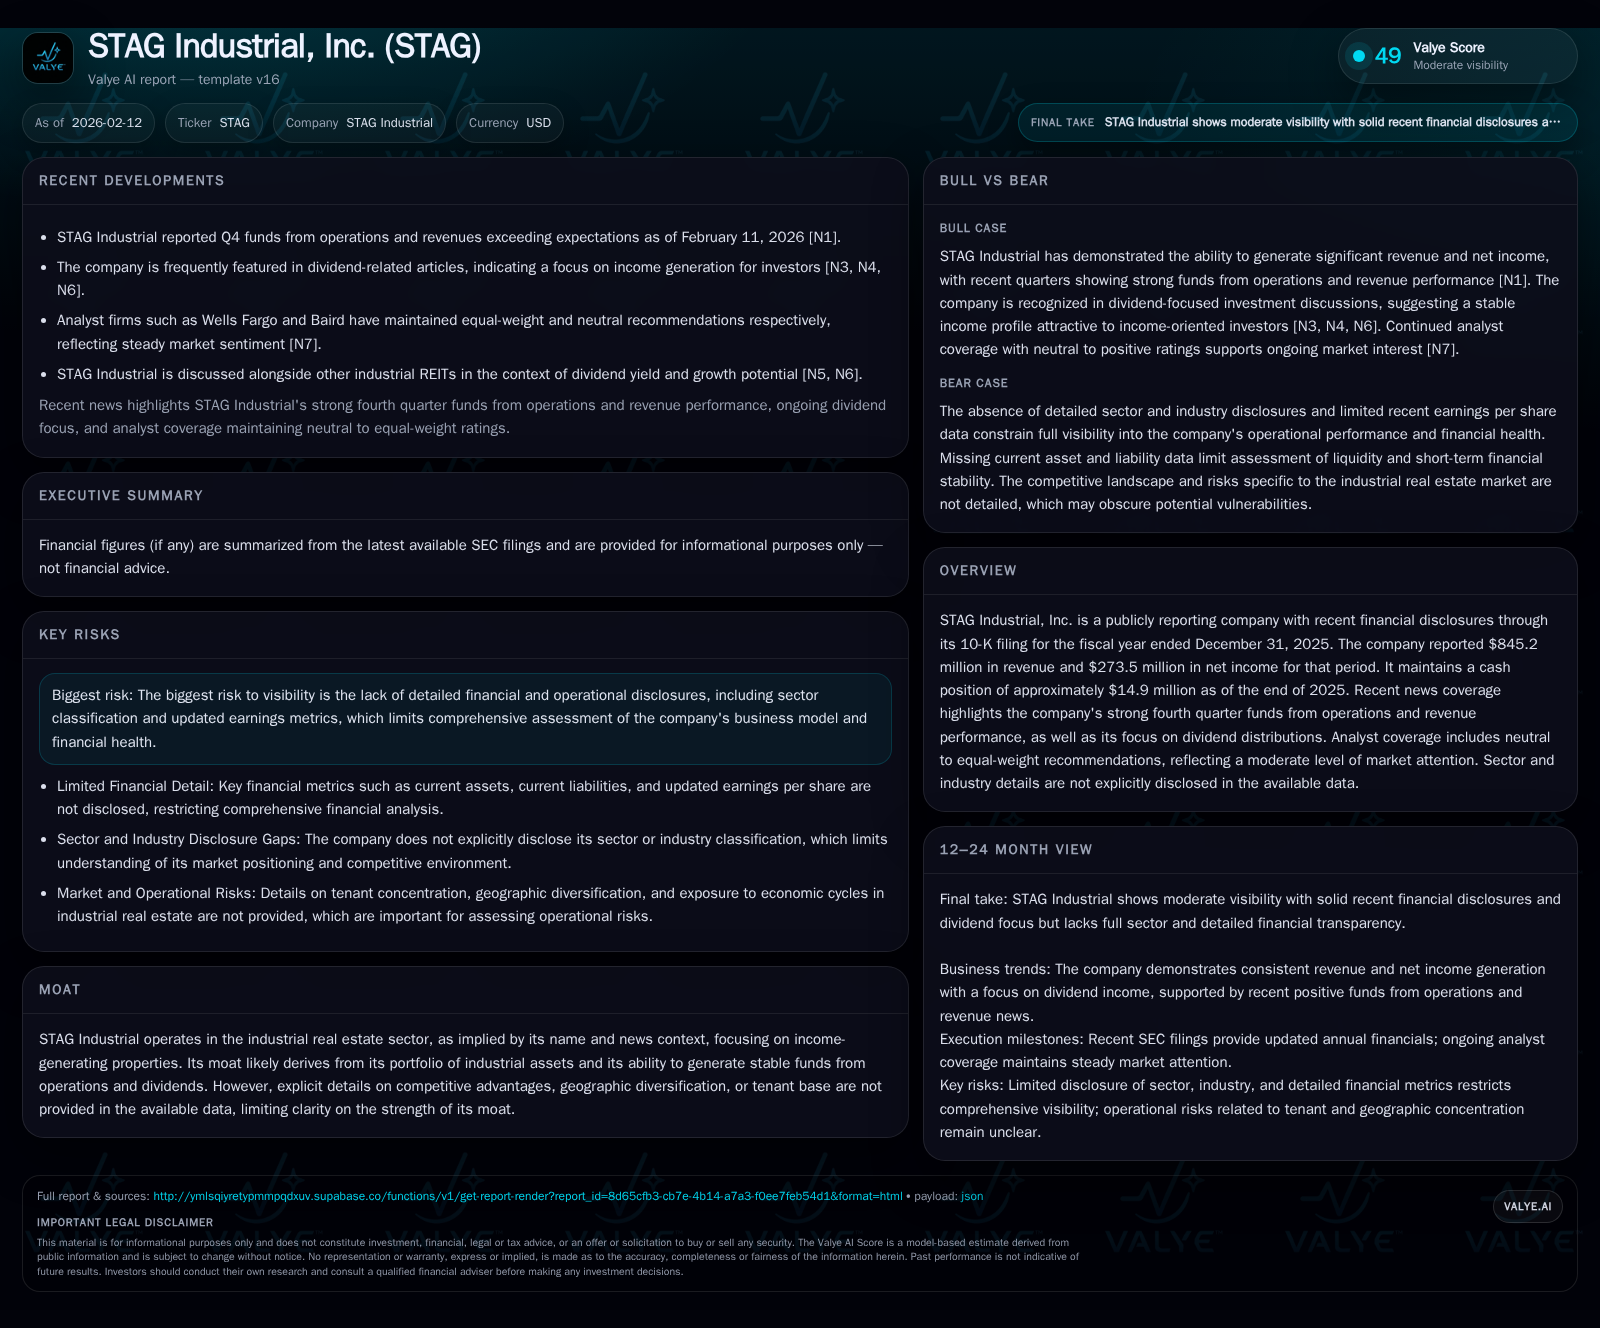
STAG Industrial reported strong fiscal 2025 results with $845.2 million in revenue and $273.5 million in net income, underscored by a notable Q4 funds from operations beat that signals operational resilience. Despite these solid financial markers and a shareholder-friendly dividend policy, the company’s limited sector disclosures and scant operational detail leave key questions about portfolio composition and competitive advantages unanswered. Compared with peers like Rexford Industrial, STAG demonstrates stable but less transparent footing, prompting cautious optimism balanced with wariness of disclosure gaps.
A Close Look at STAG’s Latest Financial Surge
STAG Industrial closed out fiscal year 2025 unveiling revenue of $845.2 million alongside a striking net income tally of $273.5 million [S1][F1]. These figures suggest not only solid top-line momentum but also efficient cost management capable of translating sales into meaningful bottom-line profits. The end-of-year cash balance of roughly $14.9 million, while positive, appears lean relative to the scale of operations—implying perhaps a disciplined or utilitarian approach to liquidity which might prioritize reinvestment or debt servicing over sizable cash hoards.
The fourth quarter further cemented this bullish narrative with funds from operations (FFO) exceeding Wall Street expectations, signaling that STAG’s recurring cash flow remains resilient even under market pressures [N1]. For investors attuned to REIT fundamentals, FFO is a critical metric above net income as it adjusts for non-cash charges; here STAG beats the market’s estimates by a margin that invites confidence in the company’s ability to sustain dividend payouts and support asset acquisitions.
Decoding STAG’s Portfolio Without a Sector Label
Despite its transparent name implying an industrial footprint, STAG’s official disclosures notably omit direct references to its sector or industry classification [valye_report_excerpt]. This absence complicates efforts to pinpoint what mix of property types or geographic regions underpin its revenue streams.
Industry context clues suggest a focus on income-producing industrial real estate such as warehouses and distribution centers—assets increasingly prized amid e-commerce growth trends. However, lacking granular data on asset locations or tenant identities leaves analysts inferencing rather than knowing the fabric of STAG’s operational base [N1]. Such opacity challenges stakeholders seeking clarity on risk concentration or the potential impact of shifting logistics dynamics.
Dividend Dynamics: Income Stability or Catch?
STAG’s dividend has surfaced in multiple market commentaries emphasizing yield sustainability [N3][N4]. Positioned as a reliable income stock within the REIT space, the company attracts investors focused on consistent cash distributions—a trait coveted especially during periods of equity volatility.
Yet the dividend story comes paired with flat analyst enthusiasm indicated by mostly neutral or equal-weight ratings [valye_report_excerpt]. This middling sentiment might reflect investor caution stemming from incomplete operational transparency, prompting questions about how long current payout levels can be maintained without growth disclosures or tenant data confirming stability.
Nonetheless, if past FFO strength is any indication, STAG is delivering enough operational cash flow to potentially back these dividends well into the near future.
Comparing STAG in a Crowded Industrial REIT Field
Contrast emerges when pitting STAG against peer names like Rexford Industrial which recently reported even more pronounced FFO surges [N2][N1]. Rexford’s higher-profile earnings beats contribute to greater visibility and potentially a richer valuation backdrop.
STAG holds its own in terms of raw numbers but falls short of peer-level disclosure granularity that fuels analyst upgrades or wider investor interest. The comparison underscores a competitive industrial real estate landscape where performance must be matched with transparency to command premium investor attention.
What the Numbers Hide: Risks in Financial Opacity
The makings of caution lie chiefly in what STAG’s filings leave unsaid. Limited insight into tenant mix exposes shareholders to unquantified tenant credit risks; geographic concentration risks remain unknown; details on lease expiration schedules are lacking—all pivotal for assessing stability in rental income streams [valye_report_excerpt].
This partial veil creates blind spots that complicate prudent valuation or risk management exercises. Investors must therefore weigh financial strength against informational incompleteness that might mask emerging vulnerabilities or growth bottlenecks.
Unpacking the Moat: Asset Quality and Tenant Mix Impressions
From inference rather than explicit statement, one can hypothesize that STAG’s moat lies in its portfolio’s income-generating capacity—stable rents yielding steady funds from operations—even if precise asset quality metrics evade public view [valye_report_excerpt][N1]. The consistency in cash flow benchmarks hints at diversified tenant bases or at least long-term lease contracts providing reliable occupancy.
Yet without concrete details on tenant industries or property locations, verifying moat durability remains speculative. Outstanding performance data is encouraging but cannot fully substitute for transparency.
Looking Forward: Growth Prospects Amidst Unknowns
Looking ahead, STAG’s position seems tethered to its proven ability to generate steady operating cash flows coupled with a shareholder-friendly dividend regimen [S1][N1]. Market appetite for industrial spaces—buoyed by structural shifts toward logistics and distribution—is broadly favorable.
Still, growth trajectory carries uncertainty owing largely to disclosure gaps. Should management pivot towards enhanced reporting on portfolio composition and operational strategies, investor confidence may rise accordingly. Until then, future outlook hinges largely on maintaining existing financial momentum while cautiously navigating unknown inflection points embedded in opaque dataset shadows.
This analysis relies on available public disclosures and market reports as of early 2026. The absence of comprehensive operational detail necessitates cautious interpretation; readers should consider supplementing this view with additional primary sources where possible. This report does not constitute investment advice but aims to provide rigorous company insight contextualized within prevailing industry dynamics.
Disclaimer: This is research-only, informational analysis and not investment advice. It may include AI-generated interpretation and general industry context. Always verify important details using primary sources.
Comments