
Service Properties Trust Faces Portfolio Rebalancing Amid High Leverage and Tenant Concentration
SVC’s 2025 reflects strategic shift towards net lease properties from hotels, challenged by elevated debt and concentrated tenant risk in travel centers.
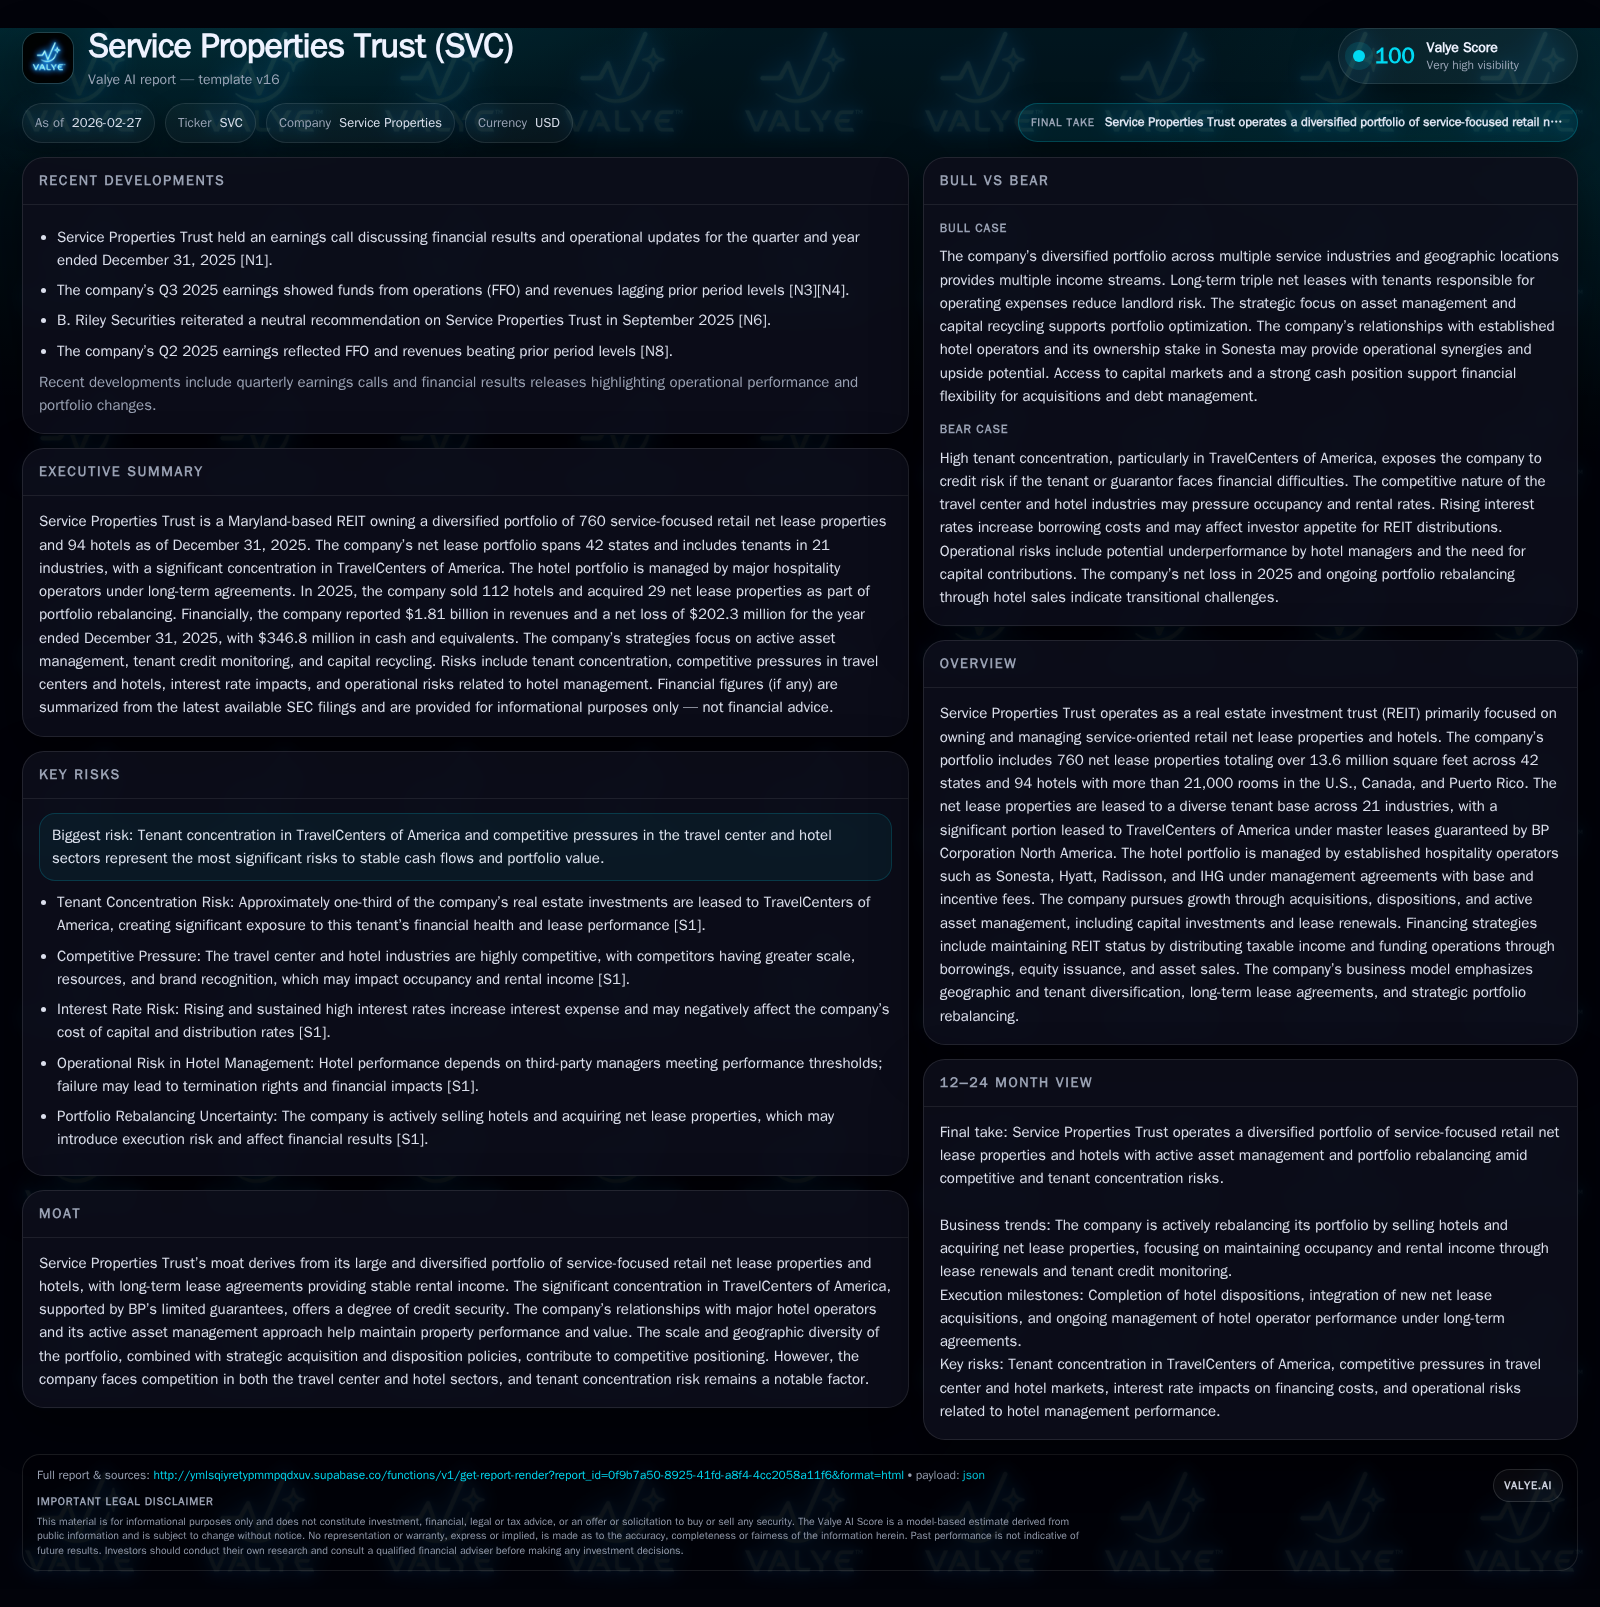
Service Properties Trust operates a large diversified portfolio of service-oriented retail net lease properties and hotels, emphasizing long-term leases primarily with TravelCenters of America (TA) backed by BP guarantees. The company has been rebalancing its portfolio by selling a substantial number of hotels while acquiring net lease assets. Revenue declined modestly in 2025 alongside continued net losses driven by leverage and operational challenges. SVC carries significant debt with restrictive covenants, limiting flexibility. The company’s future growth depends on successful asset recycling, lease renewals, and managing risks associated with tenant concentration and competitive pressures in travel centers and hotels.
Historical Performance and Portfolio Overview
Historical performance (annual)
| FY | Rev ($mm) | Net ($mm) | CFO ($mm) | Capex ($mm) | Rev YoY | Net YoY |
|---|---|---|---|---|---|---|
| 2025 | 1815 | -202 | 118 | 48 | -4.3% | +26.6% |
| 2024 | 1897 | -276 | 139 | 41 | +1.2% | -740.6% |
| 2023 | 1874 | -33 | 486 | 48 | +0.6% | +75.2% |
| 2022 | 1863 | -132 | 243 | 19 |
Source: SEC companyfacts cache [F1].
Capital returns and efficiency (annual)
| FY | Div ($mm) | Buybacks ($) | FCF ($mm) |
|---|---|---|---|
| 2025 | 7 | 660000 | 70 |
| 2024 | 101 | 751000 | 98 |
| 2023 | 132 | 802000 | 438 |
| 2022 | 38 | 470000 | 224 |
Source: SEC companyfacts cache [F1].
Service Properties Trust (SVC) operates a sizable real estate investment trust portfolio comprising both retail net lease assets and hotels focused on service industries critical to travel and daily necessities. As of December 31, 2025, the company owned 760 service-focused retail net lease properties totaling approximately 13.6 million square feet spread across 42 states and managed a portfolio of 94 hotels with roughly 21,243 rooms located primarily within the U.S., plus some holdings in Canada and Puerto Rico [S1][S20].
Annual revenue for FY2025 was approximately $1.81 billion, a decline of around 4.3% compared to $1.90 billion in the prior year [F1]. This top-line softness reflects ongoing portfolio rebalancing actions alongside competitive pressures affecting leasing rates and hotel operating performance.
Operating income figures prior to recent years show modest fluctuations: $380 million reported in FY2017 [F1], though more current operating income figures aren’t explicitly provided for comparison beyond this date.
Net income remained negative across recent years: -$202 million in FY2025 improving modestly from -$276 million in FY2024 but still indicative of persistent unprofitability possibly driven by high interest expense related to substantial debt burden [F1].
Operating cash flow fell more sharply by approximately 15.5% year-over-year to $118 million in FY2025 from around $139 million in FY2024 [F1]. Capital expenditures rose by about 16%, reaching nearly $48 million [F1], highlighting ongoing investments primarily related to maintaining asset quality.
Free cash flow after capex remains positive — estimated near $70 million in FY2025 — though overall cash generation is tightly balanced against financing costs and discretionary spending.
Portfolio Composition: Net Lease Focus vs Hotel Assets
The company’s core strength lies in its diversified retail net lease portfolio leased to over 181 tenants across approximately 140 brands spanning at least 21 industries [S25]. The largest concentration is within travel centers where SVC leases five master leases encompassing over 175 total sites operated primarily by subsidiaries of TravelCenters of America (TA), supported by limited payment guarantees from BP Corporation North America [S14][S25]. Approximately $3.27 billion was invested in TA-related properties alone as of December 31, including both TravelCenters of America Inc. branded locations (131 properties) and Petro Stopping Centers (44 properties). These sites are strategically located adjacent to interstate highways featuring services tailored for long haul trucking fleets such as fuel (diesel/gasoline), repair services, restaurants, convenience stores, and EV charging stations [S14][S25].
The hotel segment owning just under a hundred properties represents a smaller portion of invested capital but remains material with around $4.8 billion historic cost invested [S28]. Hotels are operated under management contracts with major brands including Sonesta (multiple segments), Hyatt Place, Radisson Hotels & Resorts, InterContinental Hotels Group (Crowne Plaza), among others [S28]. These agreements generally involve both base fees pegged to gross revenues plus incentive fees tied to performance benchmarks such as hotel EBITDA exceeding thresholds [S15]. The typical hotel management contract term ranges up to expiry dates between 2026 and 2040.
Recent Strategic Shifts and Growth Prospects
During calendar year 2025, Service Properties Trust executed aggressive portfolio rebalancing by disposing of a significant hotel count—112 hotels comprising roughly 14,600 rooms—and concurrently acquiring a smaller batch of retail net lease properties totaling almost 284,000 square feet [S20]. The company continues marketing additional hotels for sale while seeking further net lease acquisitions as part of its strategy to rebalance away from the more operationally intensive hotel segment towards longer-term leased assets which typically provide steadier rental income streams.
Growth drivers hinge on successful execution of early lease renewals within the net lease portfolio where the weighted average remaining lease term stands at around 7.4 years [S20], along with stringent credit monitoring of tenants with an eye toward identifying asset recycling opportunities—selling non-core or underperforming assets for redeployment into higher-return investments.
Capital allocation flexibility is constrained given the current elevated leverage profile as well as financial covenants embedded within debt instruments that can restrict borrowing capacity or force deleveraging should rents or operating incomes decline materially [S6][S7][S17]. The company has indicated plans to continue funding acquisitions through revolving credit facilities, proceeds from equity or debt issuance—including potentially preferred shares or convertible securities—and proceeds from asset sales [S4][S15]. However, these sources remain subject to market conditions especially given recent volatility impacting cost-of-capital considerations.
Financial Framework and Capital Structure Constraints
At year-end December 31, 2025 consolidated debt stood close to $5.5 billion spread across multiple classes including senior secured notes due between 2027-2032 series (with varying coupon rates near mid-single digits up to circa 8-9%), mortgage-backed notes secured against specific assets (~$650 million unsecured subsidiary-level nonrecourse borrowings), plus an undrawn revolving credit facility [S9][F1]. These debts carry financial covenants requiring maintenance of certain ratios that limit incremental leverage usage thereby constraining growth investments absent deleveraging events or equity raises.
Interest costs have increased noticeably amid rising global interest rates raising the effective cost of capital for floating rate borrowings under the revolver while also pressuring valuations underlying fixed coupon bonds issued when rates were lower [S7][S17][S18]. Refinancing risks persist as some notes mature within the next few years requiring either repayment or refinancing potentially at less favorable terms if credit metrics weaken further or markets deteriorate.
The company’s common share distributions have been held nominally at $0.01 per quarter for extended periods reflecting prudent liquidity preservation intentions given leverage levels and refinancing risks [F1][S26], while modest buybacks have been executed without major impact on outstanding share count supporting cautious capital return policies.
Competitive Positioning and Risks
Service Properties Trust’s moat derives largely from scale—the breadth across numerous service-oriented sub-industries within its retail net lease business combined with geographic diversification—and contractual protections embedded within master leases backed partially by BP guarantees specifically concerning TA travel centers . However tenant concentration risk remains acute as TA-related travel centers constitute a significant proportion of annual minimum rents owed representing principal risk if travel center operators experience downturns or defaults given competitive pressures from larger peers such as Pilot Flying J Inc. and Love’s Travel Stops & Country Stores who dominate the trucking fueling market alongside TA [S14][S23].
Hotels face intense competition based on brand loyalty programs, location desirability and amenity differentiation against nationally recognized chains often commanding greater economies of scale able to invest heavily into customer-facing innovations or loyalty rewards programs that drive occupancy premiums.
Other external risk factors emphasized include adverse macroeconomic conditions impacting trucking volumes or consumer leisure travel leading potentially to lower rent payments or weaker hotel operating margins; inflationary pressures increasing maintenance costs particularly on older hotel inventory; environmental liabilities; cybersecurity risks due to reliance on management firms incorporating evolving AI technologies; regulatory changes impacting REIT status; pandemic resurgences or geopolitical tensions affecting demand profiles [S11][S24].
Forecasts & Key Milestones to Monitor (Analysis)
Though explicit formal guidance was not provided in filings or public news transcripts as of early 2026 [N1], key metrics investors should watch include:
- Lease renewal rates especially within TA-branded net leases given their outsized rental contribution,
- Performance benchmarks of managed hotels reflected via incentive fees that signal recovery or deterioration,
- Debt covenant compliance indicators including leverage ratios and interest coverage,
- Trends in rental collection rates during economic cycles,
- Progression on asset dispositions focused on completing additional hotel sales,
- Changes in distribution policy reflecting liquidity positioning amidst refinancing maturities. Monitoring these metrics will provide insight into the company’s ability to de-risk its balance sheet while optimizing asset mix towards more resilient recurring cash flows.
Returns and Capital Allocation Analysis
Despite revenue exceeding $1.8 billion annually last fiscal year, SVC generated negative net income (-$202 million) for FY2025 resulting in an approximate negative return on equity near -31% given equity base contraction down to about $646 million from over $851 million in the prior year end due largely to accumulated losses and portfolio adjustments [F1]. Operating cash flows decreased year-over-year but remained positive totaling close to $118 million offset partially by increased capex spending for asset upkeep.
Dividend payments shrunk considerably—from over $100 million paid out in FY2024 down below $7 million last year—to preserve liquidity relating directly to restrictions imposed by leverage covenants coupled with management caution amid refinancing uncertainties [F1]. Buybacks have been nominal thus far indicating priority remains on strengthening balance sheet health rather than shareholder returns at this stage.
In sum, capital allocation currently prioritizes debt repayment capacity and strategic repositioning away from high capital intensive hotel assets towards long-term leased service-oriented properties offering relatively stable rent rolls supported by long-dated master leases coupled with credit enhancements.
This analysis summarizes current public disclosures as found in Service Properties Trust's SEC filings through FY2025 closing statements including their latest Form 10-K filed February 25th, 2026 ([S1]–[S29]), the Nasdaq earnings call transcript dated February 26th, 2026 [N1], plus corroborating financial data extracted from standard SEC XBRL companyfacts repositories dated February 26th, 2026 [F1]. Details represent factual reporting without recommendation or inferred outlook beyond stated company disclosures or direct industry context where explicitly noted.
Disclaimer: This is research-only, informational analysis and not investment advice. It may include AI-generated interpretation and general industry context. Always verify important details using primary sources.
Comments