
Synlogic, Inc. Navigates Strategic Transition After Nasdaq Delisting
Following Nasdaq delisting, Synlogic focuses on strategic alternatives with a sharply reduced operational footprint and solid liquidity.
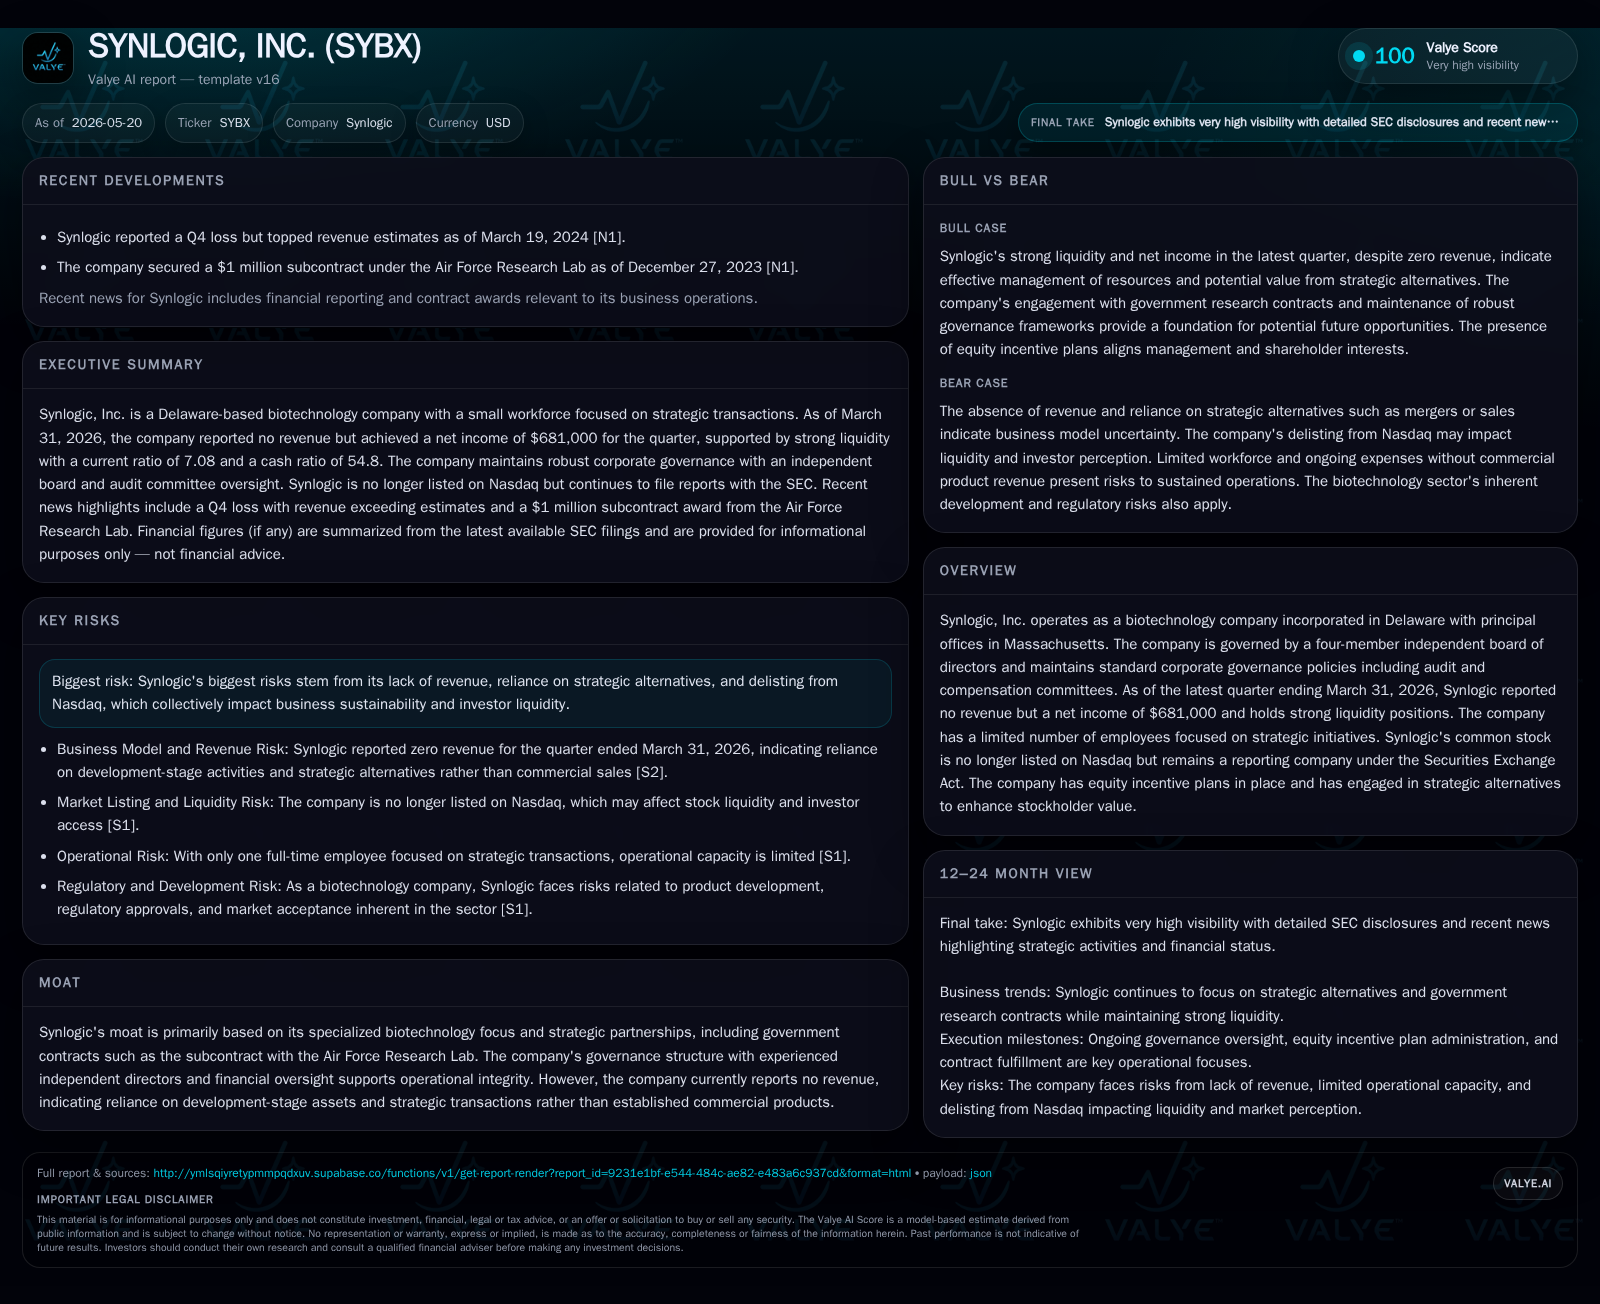
Synlogic, Inc. reported no revenue for the latest quarter ending March 31, 2026, consistent with its development-stage status. The company withdrew its Nasdaq listing request after being deemed a 'public shell,' transitioning to OTC Markets trading. With operations scaled down to a single full-time employee focused on strategic transaction evaluation, Synlogic is repositioning as a transaction-driven entity emphasizing licensing, partnerships, or potential mergers. The company holds $14.1 million in cash and maintains a strong current ratio above 7x, supporting near-term operations despite zero commercial revenue. Risks include execution uncertainty around strategic alternatives and limited internal capacity, while growth depends on successful deal-making rather than organic pipeline advancement.
Recent Operating Update
Synlogic filed its latest quarterly report (Form 10-Q) dated May 14, 2026 [S2], covering operations through March 31, 2026. The company reported no revenues for the period [F1], consistent with its development-stage biotechnology profile lacking commercial products. Despite this, Synlogic recorded a modest net income primarily driven by non-operating items such as interest income or financial gains [F1].
In January 2026, Synlogic voluntarily withdrew its request for a Nasdaq Hearings Panel review after Nasdaq Staff designated it a "public shell" due to the absence of operating assets and minimal organizational scale [S4][S16]. Consequently, trading of Synlogic shares was suspended on Nasdaq effective January 21, 2026, with quotations moving to the OTC Markets Group platform. This transition marks a significant shift away from traditional public company operations.
Operationally, Synlogic has contracted significantly; as of March 31, 2026, it employed only one full-time employee focused on assessing strategic transactions as directed by the Board of Directors [S1][S24]. This reduction indicates that internal research and development activities have been effectively paused while management prioritizes evaluating alternatives such as mergers, asset sales or licensing arrangements aimed at enhancing stockholder value.
Business Model Overview
Historically centered on engineered synthetic biotic medicines—live bacterial therapeutics designed for specific biological functions—Synlogic now operates predominantly as an intellectual property holding and transaction-focused entity rather than an active drug developer.
The absence of revenue-generating products means value creation depends heavily on potential partnerships or licensing deals leveraging its proprietary synthetic biology platform. While engagements such as government contracts with entities like the Air Force Research Lab exist, these do not currently provide material recurring revenues.
The company’s approach emphasizes preserving strategic optionality through maintaining cash reserves and intellectual assets while minimizing ongoing expenses [S21]. The adoption of an equity incentive plan approved in late 2025 supports retaining key personnel or consultants integral to executing strategic alternatives including potential acquisitions or collaborations.
Margins and cash flow are influenced more by non-operational sources than by operational profitability due to the lack of manufacturing capabilities or commercial infrastructure.
Industry Structure and Competitive Positioning
The synthetic biology therapeutics sector includes companies advancing engineered live biotherapeutics across various clinical indications. Compared to peers maintaining active R&D pipelines supported by significant funding and scientific staff, Synlogic’s scale has notably diminished.
Competitors typically focus on microbiome therapies targeting metabolic disorders, oncology immunotherapy adjuncts, or infectious diseases with mid-to-late stage clinical candidates. In contrast, Synlogic’s competitive advantage resides mainly in its specialized intellectual property related to synthetic biotic engineering and select government-funded biodefense research contracts.
Watch closely for any announcements regarding completed mergers, asset sales or licensing agreements that could materially alter business prospects or capital structure. Governance changes signaling more proactive strategy implementation warrant attention.
What to Watch Next
- Outcomes from evaluations of strategic alternatives including any definitive transaction agreements.
- Announcements of new or expanded government research contracts supporting incremental revenues.
- Capital structure developments such as equity financings linked to executing new strategic plans under the equity incentive program.
- Board communications clarifying long-term vision beyond transactional positioning towards possible renewed R&D investment.
- Trends in liquidity management balancing limited operational inflows against administrative costs.
Financial Profile Summary
As of March 31, 2026, Synlogic held $14.1 million in cash and equivalents with total current assets around $14.56 million against current liabilities near $2.06 million, yielding a strong current ratio exceeding 7x—a sign of solid short-term liquidity [F1]. This financial buffer supports corporate overhead during the transition toward alternative strategies despite no operating revenues reported through fiscal year-end December 31, 2025 [F1].
Operating losses continue; however, the most recent quarter showed modest net income primarily attributable to non-core financial activities rather than operational performance—reflecting sharply reduced cost structures alongside treasury management gains [F1][S2]
Overall financial health permits near-term survival but longer-term viability hinges critically on successfully realizing strategic alternatives given minimal organic cash generation capacity evident in recent filings.
This analysis is based on publicly available SEC filings and news sources up to May 20, 2026. It does not constitute investment advice.
Disclaimer: This is research-only, informational analysis and not investment advice. It may include AI-generated interpretation and general industry context. Always verify important details using primary sources.

Comments