
AT&T's Network Investments Drive Fiber and Wireless Growth in Q2 2026
AT&T’s Q2 results showcase revenue growth fueled by fiber and wireless service expansion, underpinned by heavy 5G and fiber capital deployments balancing market saturation pressures.
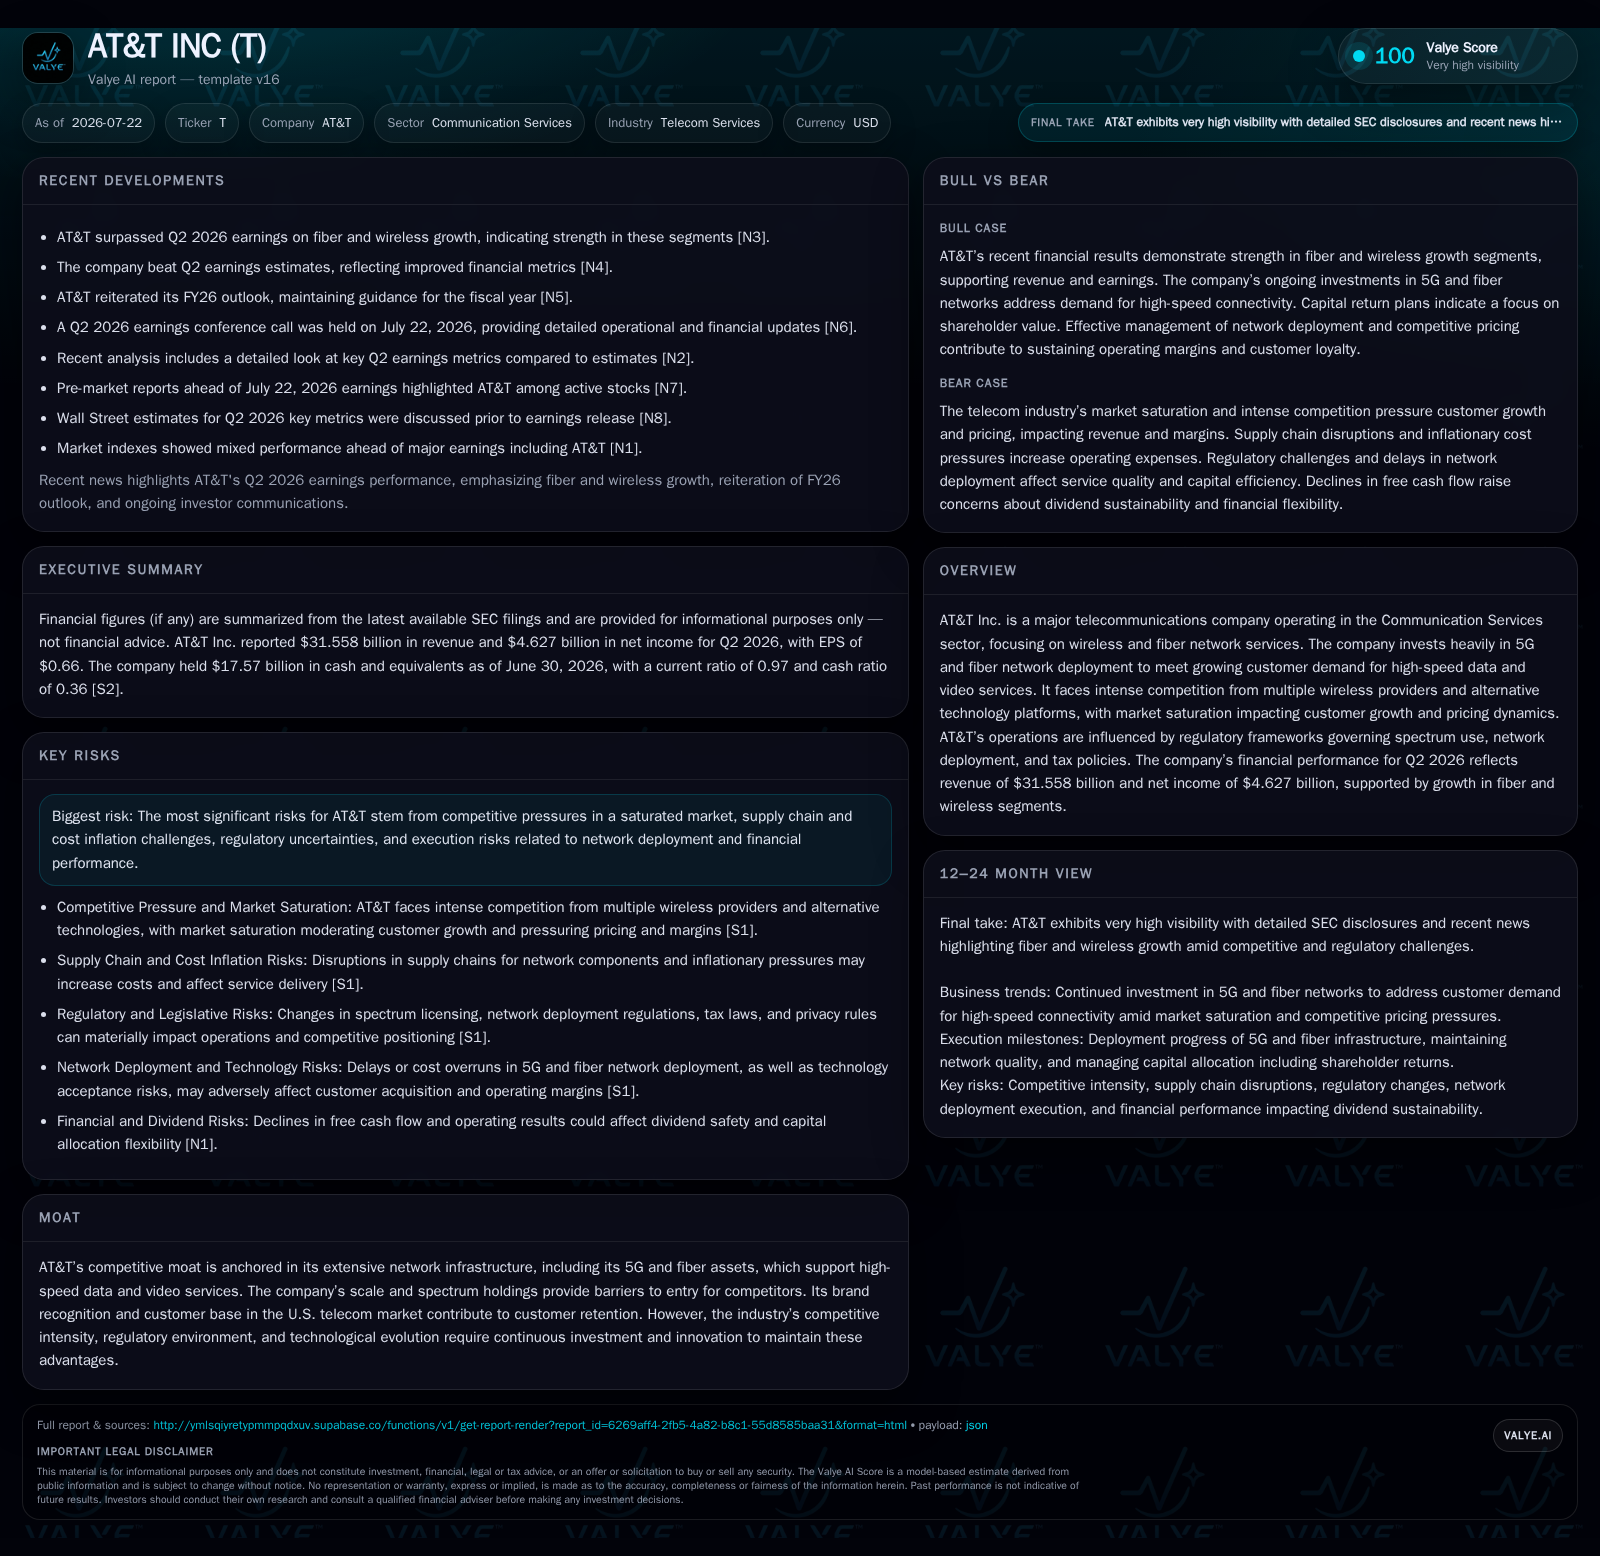
In Q2 2026, AT&T reported $31.558 billion in revenue, reflecting continued strength in its fiber-optic broadband and wireless data segments supported by ongoing 5G network expansion and fiber deployments. Despite a saturated U.S. telecom market presenting subscriber growth challenges, the company sustains average revenue per user (ARPU) gains that help offset churn pressure. Capital expenditures remain elevated to enhance network capacity and coverage, maintaining competitive positioning against peers like Verizon and T-Mobile. Inflationary cost pressures, regulatory uncertainties around spectrum licenses, and subscriber churn risks are notable headwinds requiring monitoring as AT&T balances investment intensity with margin preservation.
AT&T's Q2 2026 Operating Update: Fiber and Wireless Revenue Growth Amid Market Saturation
AT&T reported total revenue of $31.558 billion for the second quarter of 2026, driven primarily by growth in its fiber-optic broadband and wireless service segments [S2][N3]. This revenue momentum occurs despite the challenges of a saturated U.S. telecommunications market where subscriber acquisition growth is constrained. The company’s ability to increase average revenue per user (ARPU) quarter-over-quarter plays a pivotal role in offsetting the impact of subscriber churn, a common dynamic in mature telecom markets [S2]. ARPU gains reflect successful monetization of enhanced network coverage and quality improvements enabled by ongoing 5G network expansion and fiber deployments, allowing AT&T to offer premium or value-added bundled services.
However, the filing also indicates a modest decline in subscriber counts, underscoring the difficulty of driving volume growth in saturated geographies [S2]. This heightens the strategic importance of ARPU management through differentiated offerings, such as higher-speed fiber broadband and enriched wireless data plans leveraging AT&T’s expanding 5G network capabilities.
Business Model and Revenue Drivers
AT&T’s revenue is generated primarily through subscription fees paid by consumers and businesses for voice, data, and video services delivered over its wireless and wireline networks. The company also earns from equipment sales, wholesale network access, and value-added services. The core business model depends on maintaining a large subscriber base while maximizing ARPU through tiered service plans, bundled offerings, and upselling higher-speed or premium connectivity options. Capital expenditures (CapEx) on network infrastructure and spectrum licenses are critical to sustaining service quality and competitive positioning, directly impacting the company’s ability to attract and retain customers.
Key operating metrics include subscriber counts (postpaid and prepaid), ARPU, subscriber churn rates, network coverage and capacity, and service activation rates. These KPIs influence revenue growth, gross margin on services, and free cash flow generation.
Capital Expenditures Focused on 5G and Fiber Network Expansion
AT&T continues to allocate a significant portion of operating cash flow to capital expenditures aimed at expanding its 5G network footprint and fiber-optic broadband infrastructure [S1][S2]. This capital intensity is typical for telecom operators investing to meet rising consumer demand for high-speed data and low-latency connectivity. While these investments create short-term margin pressure through increased depreciation and operating costs, they strengthen AT&T’s long-term competitive moat by enhancing network capacity, coverage, and service quality.
The efficiency of these investments will be critical to monitor, particularly whether CapEx translates into improved service activation rates, subscriber retention, and ARPU growth in subsequent quarters [N12][S2]. Failure to convert network investments into sustainable revenue and cash flow improvements could constrain financial flexibility given the company’s elevated leverage.
Competitive Landscape and Spectrum Portfolio
AT&T operates in a highly competitive environment alongside national wireless carriers such as Verizon Communications and T-Mobile US. Verizon similarly invests heavily in fiber and wireless convergence, while T-Mobile is recognized for its rapid nationwide 5G rollout. AT&T’s extensive spectrum license portfolio provides a competitive barrier by enabling robust wireless data services with low latency, but also exposes the company to regulatory risks related to spectrum usage rights, pricing constraints, and deployment mandates [S1]
Subscriber churn rates and ARPU trends serve as critical indicators of AT&T’s success in customer retention and pricing power relative to its peers. Maintaining or improving these metrics amid aggressive pricing competition and alternative broadband offerings from cable providers like Comcast is essential for sustaining revenue growth.
Demand Drivers Supporting Long-Term Growth
Structural demand drivers underpinning AT&T’s growth include increasing broadband penetration, rising mobile data consumption, and enterprise connectivity needs [N3]. The proliferation of video streaming, IoT devices, and cloud services fuels demand for higher-speed fiber broadband and expanded 5G wireless coverage. These trends justify ongoing capital investments despite market saturation.
Fiber-optic broadband expansion addresses consumer and business demand for superior fixed-line speeds compared to cable alternatives, while densification of 5G networks via small cells supports mobile data traffic growth. These factors contribute to expanding the addressable market and enhancing ARPU potential.
Risks and Headwinds
Inflationary pressures affect AT&T’s cost structure, increasing expenses for network equipment, customer premises equipment (CPE), handsets, labor, and distribution [S1]. Supply chain constraints, particularly for semiconductors and network components, may delay deployments or raise costs. Attempts to pass these costs onto customers through price increases risk accelerating subscriber churn if consumers opt for lower-priced alternatives or bundled offerings from competitors.
Regulatory uncertainties around spectrum licensing and wholesale access obligations add complexity to network deployment plans and pricing strategies. Additionally, competitive pricing pressures and subscriber churn remain persistent risks that could compress margins and slow revenue growth.
Key Metrics and Execution Watchpoints
Investors and analysts should closely monitor several near-term operating metrics to assess AT&T’s execution:
- Service activation rates following capital investments, indicating monetization effectiveness [N12][S2]
- Subscriber retention trends and churn rates, reflecting competitive positioning
- ARPU levels and gross margin on services, signaling pricing power and cost management
- Wholesale access revenues and equipment sales, showing diversification beyond core subscriptions
Any material deviation from the company’s reiterated full-year outlook or downward revisions could signal operational challenges related to supply chain disruptions, pricing competition, or slower-than-expected network monetization.
Financial Position and Leverage Considerations
As of June 30, 2026, AT&T held $17.57 billion in cash and equivalents against net debt of approximately $126.7 billion, calculated as total debt less cash balances [F1]. The company’s current ratio stood at 0.97, indicating tight working capital typical of capital-intensive telecom operations reliant on steady subscription cash flows [F1].
This leverage profile underscores the importance of disciplined free cash flow generation to support ongoing capital investments while preserving financial flexibility. Efficient conversion of revenue growth into free cash flow, alongside prudent management of subscriber acquisition and retention costs, will be vital to maintaining investment-grade credit metrics.
In comparison, peers such as Verizon face similar capital intensity and leverage challenges, emphasizing the sector-wide tradeoff between sustaining network leadership and financial prudence.
Disclaimer: This analysis is based solely on publicly available filings as of July 22, 2026. It does not constitute investment advice or research views. The discussion is intended for informational purposes grounded strictly in disclosed data without speculative inference.
Financial snapshot as of 2026-06-30
AT&T’s cash and equivalents totaled $17.57 billion, with current assets of $51.8 billion and current liabilities of $53.4 billion, resulting in a current ratio of approximately 0.97x [F1]. This reflects typical liquidity positioning for a capital-intensive telecommunications operator.
Disclaimer: This is research-only, informational analysis and not investment advice. It may include AI-generated interpretation and general industry context. Always verify important details using primary sources.

Comments