
EastGroup Properties Enhances Industrial Footprint with Strong Lease-Up and Capital Position
Second-quarter 2026 results reflect growth from development pipeline and stable operations amid macroeconomic uncertainties.
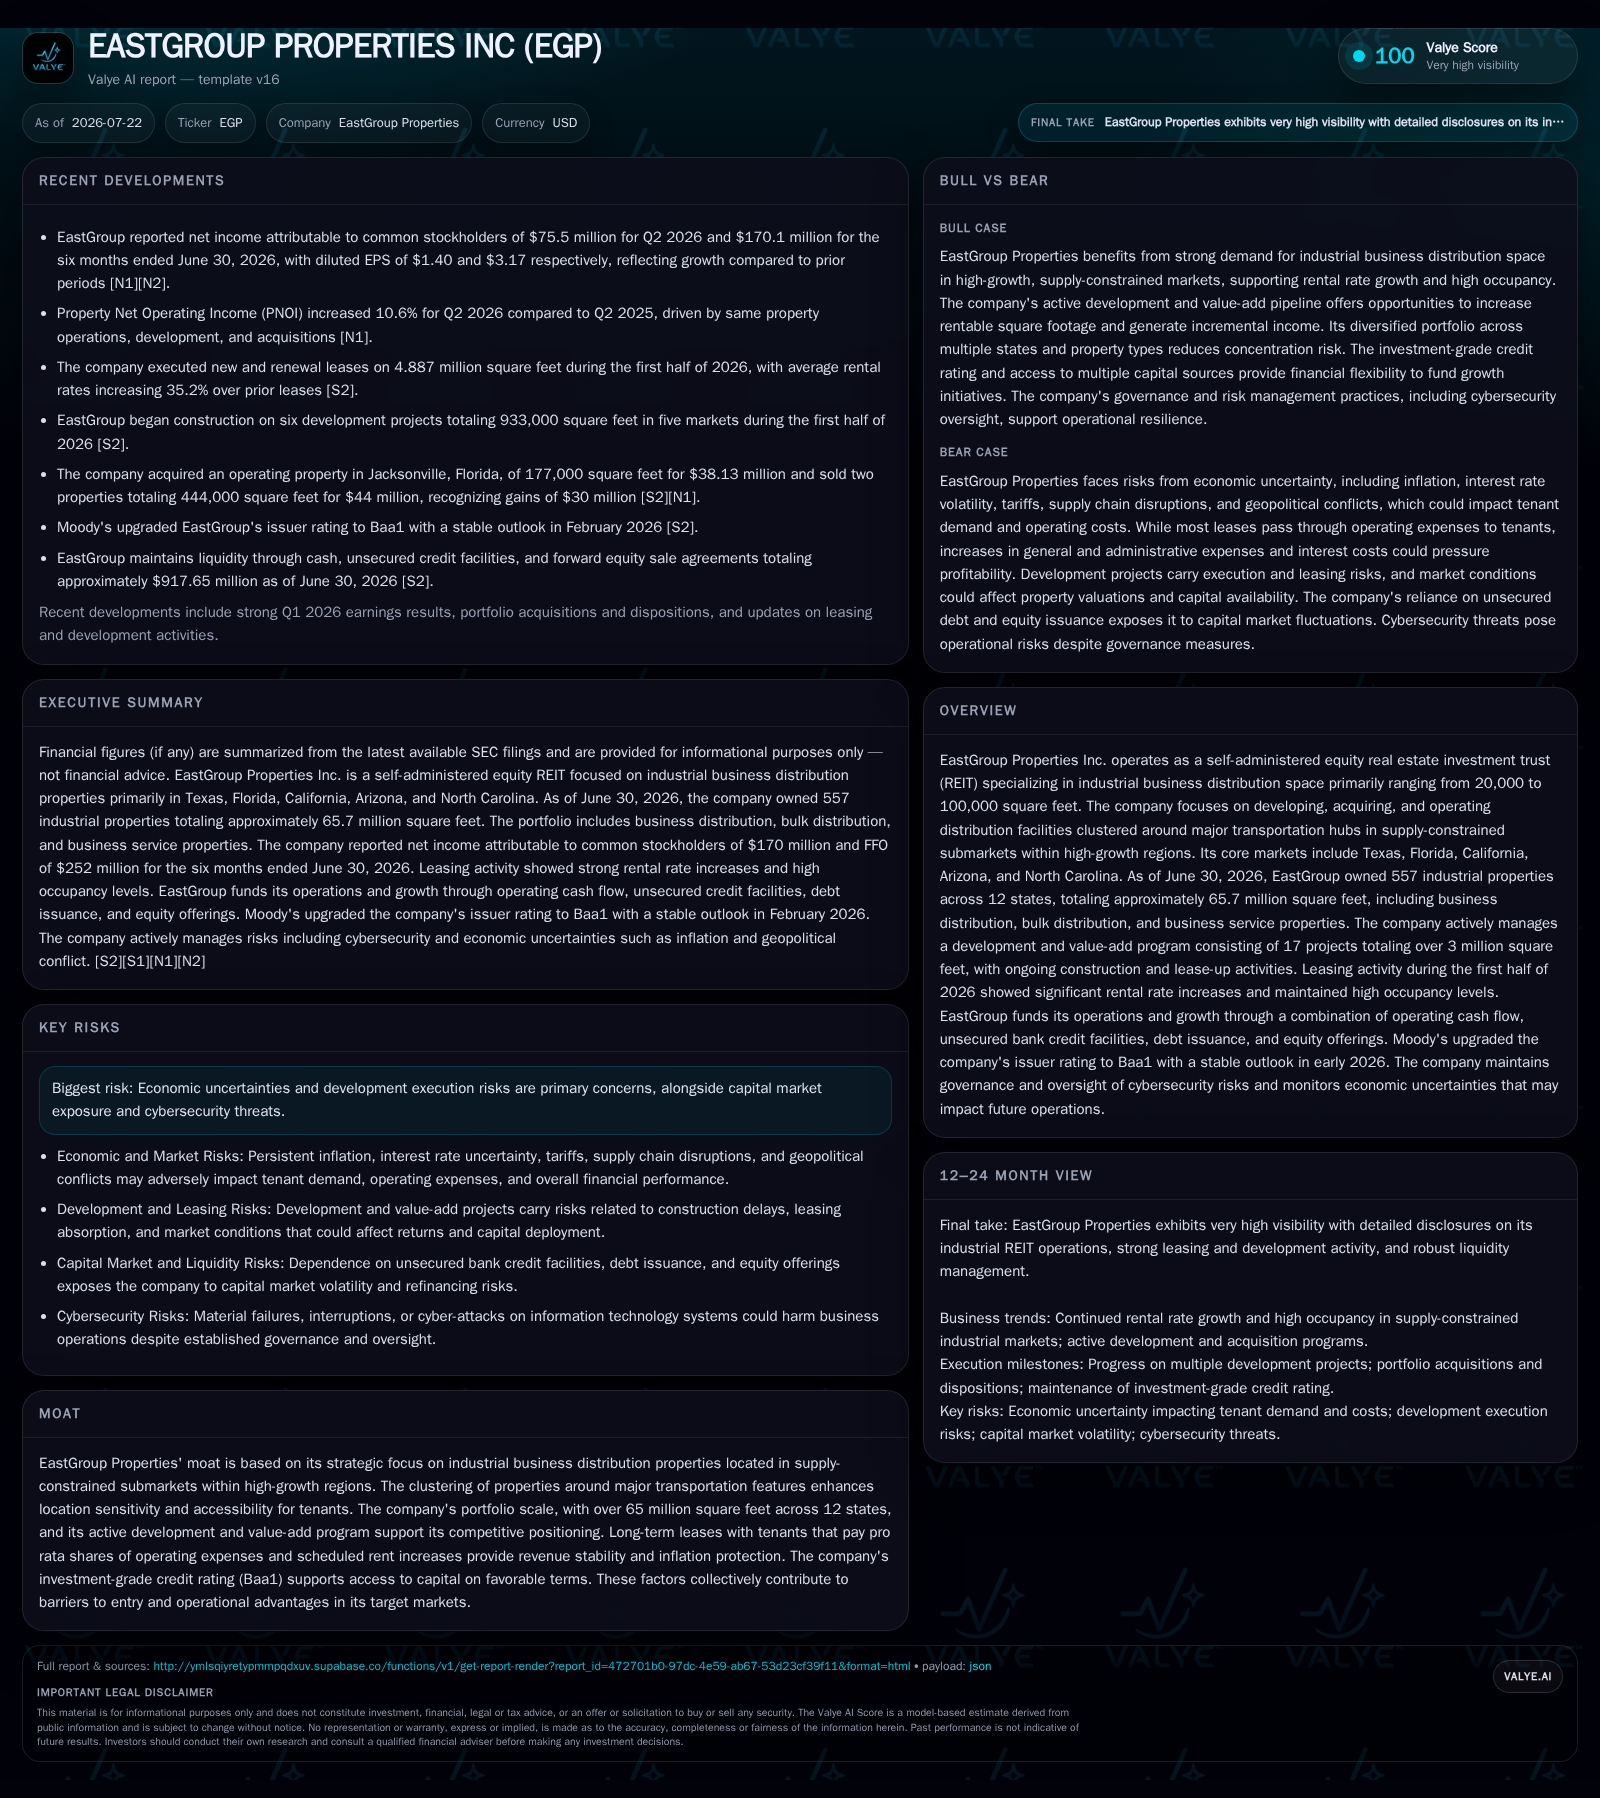
EastGroup Properties Inc. reported solid operational progress in Q2 2026, growing portfolio square footage through strategic acquisitions and advancing its development pipeline clustered in high-growth, supply-constrained markets. The REIT maintains a leveraged yet manageable capital structure highlighted by a recent credit rating upgrade to Baa1, supporting accessible financing for ongoing development and acquisitions. Its lease structures featuring tenant-paid operating expenses and scheduled rent escalations underpin revenue resilience despite inflationary pressures. Key risks include economic volatility and execution challenges on development projects. Upcoming milestones will focus on leasing velocity in newly completed assets and capital deployment efficiency.
Recent Operating Update
EastGroup Properties Inc. reported robust operational results for the quarter ended June 30, 2026, with net income attributable to common stockholders increasing to $75.5 million, or $1.40 diluted earnings per share, compared to $63.3 million in the prior year quarter [S16]. This improvement was primarily driven by a rise in Property Net Operating Income (PNOI) to $142.9 million, reflecting same-property NOI growth of $7.6 million alongside incremental contributions of approximately $6.5 million from new developments and acquisitions net of dispositions [S16]. The company’s lease portfolio benefits from scheduled rent escalations and tenant-paid pro rata operating expenses, which provide resilience against inflationary pressures and operating cost increases.
During the first half of 2026, EastGroup expanded its industrial footprint with the acquisition of a stabilized 177,000-square-foot industrial property in Jacksonville for $38.1 million, enhancing its presence in a supply-constrained, high-demand market [S19]. Concurrently, the company actively managed its portfolio through dispositions generating gross proceeds of $44 million and recognizing gains exceeding $30 million, reflecting disciplined capital recycling to optimize portfolio composition and fund growth initiatives [S12]. As of June 30, 2026, EastGroup’s portfolio comprised 557 industrial properties totaling approximately 65.7 million square feet across 12 states, with a strategic concentration in Texas, Florida, California, Arizona, and North Carolina—markets characterized by strong demographic growth and limited industrial land availability [S2].
The company’s development and value-add pipeline includes 17 projects aggregating over 3 million square feet with a forecasted investment of approximately $487 million. As of late July 2026, these projects were about 21.7% leased, indicating ongoing lease-up activity and future NOI growth potential upon stabilization [S12]. Six projects transitioned from development to operating status during the first half, contributing to portfolio expansion and rental income diversification. EastGroup’s focus on supply-constrained submarkets near major transportation hubs underpins its competitive positioning by supporting high occupancy rates and rental rate growth.
Business Model Overview
EastGroup operates as a self-administered equity REIT specializing in industrial business distribution properties, primarily targeting facilities sized between 20,000 and 100,000 square feet. The company’s revenue model centers on leasing industrial warehouse, bulk distribution, and business service spaces under predominantly long-term leases. These leases typically require tenants to pay their pro rata share of operating expenses—including real estate taxes, insurance, and common area maintenance—thereby mitigating EastGroup’s exposure to inflation-driven cost increases [S2]. Scheduled rent escalations embedded in lease agreements further enhance revenue stability and provide a natural hedge against inflation.
The company’s leasing strategy emphasizes tenant retention and occupancy stability, focusing on location-sensitive customers who require proximity to major transportation infrastructure for efficient logistics and supply chain operations. This tenant base primarily consists of middle-market logistics operators, e-commerce distributors, and manufacturers requiring flexible, functional industrial space.
EastGroup supplements its leasing income with development and redevelopment activities, creating new leasable inventory or upgrading existing assets to capture higher rental rates and improve tenant attraction. Capital expenditures (CapEx) are allocated between maintenance to preserve asset quality and strategic value-add projects designed to enhance property competitiveness and extend lease terms.
Key operating metrics include occupancy rate, leasing velocity (new leases signed), average lease term, rental rate per square foot, and tenant retention rate [S1]. These metrics drive net operating income (NOI) growth and underpin funds from operations (FFO), a critical measure of cash flow available for distribution to shareholders
Industry Structure & Competitive Position
EastGroup competes within the industrial REIT sector alongside large-scale operators such as Prologis, Duke Realty, and Rexford Industrial. While these peers often have broader geographic footprints, EastGroup differentiates itself through a focused strategy of geographic clustering in supply-constrained submarkets with limited new industrial land availability. This concentration in high-growth regions supports robust occupancy rates and affords modest pricing power relative to peers with more dispersed portfolios.
The company’s portfolio composition—dominated by business distribution properties with a meaningful bulk distribution component—aligns with market demand for flexible, modern industrial space near key transportation corridors. Lease structures that pass operating expense inflation directly to tenants provide a competitive advantage over other commercial real estate sectors with gross lease formats, enhancing EastGroup’s revenue predictability.
EastGroup’s capital structure benefits from a recent Moody’s credit rating upgrade to Baa1 with a stable outlook, facilitating access to unsecured debt markets at favorable rates [S4], [S9]. The company’s debt maturity profile balances near-term principal repayments totaling approximately $140 million through 2027 with longer-dated maturities extending into the early 2030s at a weighted average interest rate of about 3.4%, supporting refinancing flexibility and interest cost management.
Growth Drivers
The industrial real estate sector continues to benefit from secular trends including the expansion of e-commerce and the optimization of supply chains, which drive demand for last-mile and bulk distribution facilities. EastGroup’s focus on mid-sized warehouse spaces tailored to middle-market logistics operators aligns well with these demand drivers.
Supply constraints in key metropolitan fringe areas, particularly in Texas, Florida, California, Arizona, and North Carolina, limit new industrial land availability, supporting rental rate growth and occupancy stability. EastGroup’s development pipeline and value-add projects capitalize on this scarcity by delivering modern, functional industrial space that meets evolving tenant requirements.
Technological advancements such as warehouse automation and enhanced logistics systems increase tenant preference for high-quality, adaptable facilities, which EastGroup addresses through its development and redevelopment initiatives. The company’s lease-up progress in its development pipeline and ongoing acquisition activity targeting stabilized assets reflect management’s confidence in the underlying market fundamentals [S1], [S12].
Risks & Watchpoints
Key risks include macroeconomic uncertainties such as inflation and interest rate volatility, which can increase operating costs not passed through to tenants and elevate borrowing expenses despite interest rate swaps that effectively fix variable-rate debt [S14]. Execution risks in the development pipeline—such as construction delays or cost overruns—could compress expected yields and delay cash flow contributions.
Tenant credit risk remains a consideration given EastGroup’s exposure to logistics, manufacturing, and distribution sectors that may be affected by supply chain disruptions or geopolitical trade tensions. The company’s lease structures and tenant mix help mitigate these risks but require ongoing monitoring.
Cybersecurity is a material operational risk, with EastGroup maintaining a dedicated Cyber Risk Committee comprising senior executives including the CFO and CIO to oversee risk management and mitigation efforts consistent with industry best practices [S1].
What to Watch Next
Investors and analysts should monitor leasing velocity and absorption rates across the 3+ million square feet of active development and value-add projects, as successful lease-up will drive future NOI growth and cash flow stability. Tenant retention rates upon lease expirations will provide insight into market demand and pricing power within EastGroup’s targeted submarkets.
Capital deployment efficiency—balancing investment in new developments versus acquisitions of stabilized properties—will be critical to sustaining growth while preserving liquidity amid evolving capital market conditions. The company’s ability to maintain dividend coverage, particularly given $167 million in dividend payments during the first half of 2026 relative to net income and FFO generation, will also be a key metric to assess payout sustainability [S4], [S15].
Financial Profile Discussion
EastGroup’s liquidity position remains strong, with approximately $918 million of immediate funds available as of June 30, 2026, including $33.4 million in cash and cash equivalents, $675 million in unsecured credit facility availability, and $210 million in gross proceeds from forward equity sale agreements [S4]. Operating cash flow for the first half of 2026 was robust at $302 million, supporting dividend distributions totaling $167 million and capital expenditures of approximately $27.6 million focused on property improvements and development costs [S19].
The company’s financial strategy emphasizes maintaining a balanced capital structure, leveraging selective equity issuances under its ATM program to supplement internal cash flows without excessive dilution [S16]. The recent credit rating upgrade to Baa1 enhances access to unsecured debt markets at competitive rates, supporting ongoing development and acquisition activities [S4], [S9].
This analysis integrates the latest regulatory filings through Q2 2026 with sector-specific insights into industrial REIT operating dynamics, providing a detailed operational and strategic perspective on EastGroup Properties Inc. It is intended solely for informational purposes and does not constitute investment advice or research views.
Disclaimer: This is research-only, informational analysis and not investment advice. It may include AI-generated interpretation and general industry context. Always verify important details using primary sources.

Comments