
Texas Community Bancshares Returns to Profitability on Texas Market Dynamics
TCBS achieved a substantive net income turnaround in FY2025, reflecting both operational recovery and strategic positioning within its regional Texas banking footprint.
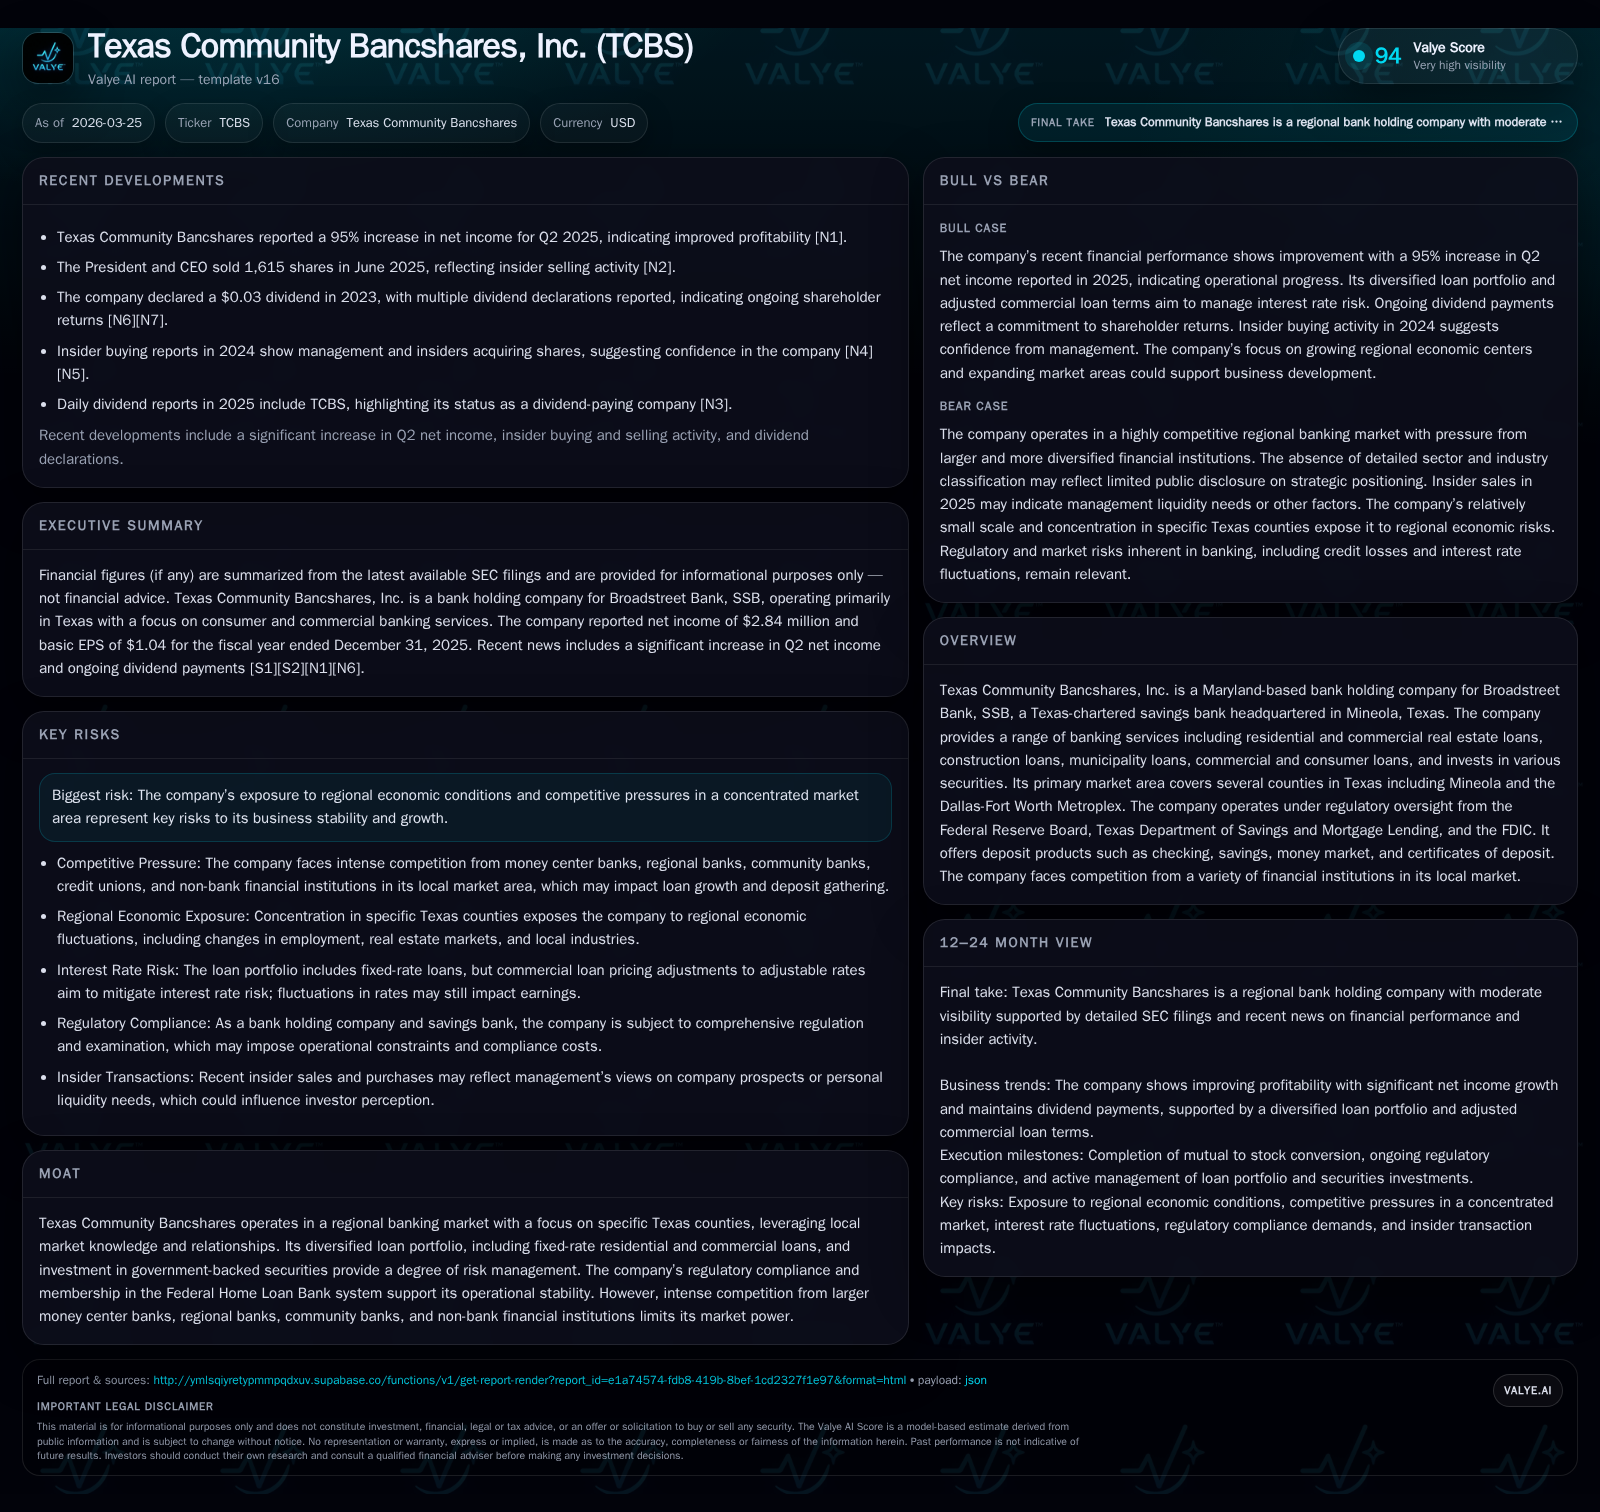
Texas Community Bancshares, Inc. reversed previous multi-year losses to record a net profit of $2.8 million in fiscal 2025, driven by stable loan portfolio management and market tailwinds in its core Texas territories. Operating cash flows dipped amid reduced capex spending, signaling a cautious reinvestment approach. The bank's loan mix remains diversified across residential, commercial real estate, construction, agricultural, and municipal loans, with consistent credit quality oversight supporting performance. Competitive pressures from larger banks and regulatory limitations continue to constrain growth scalability, while capital allocation reflects a blend of dividends and buybacks with a conservative funding profile.
Financial Turnaround: From Losses to Profit in FY2025
Texas Community Bancshares (TCBS) marked a critical inflection point in fiscal 2025 by returning to net profitability with reported net income of $2.84 million — representing a notable year-on-year increase of approximately 318% compared to the prior year's net loss of $1.3 million [F1]. This reversal follows two consecutive years of operating negative results (FY2023: -$0.73M) after an earlier profit phase in FY2022 ($1.75M). Despite the profit rebound the operating cash flow (CFO) trended downward to $1.37 million in 2025 from $1.94 million in 2024, reflecting a near 30% decline [F1]. The deceleration stems primarily from a capitulation in capital expenditures — down more than 67% year-over-year as TCBS curtailed spending levels from a hefty $5.6 million in FY2023 down to under $400K in FY2025 [F1]. This constrained capex outlay likely aided free cash flow generation given CFO softness but illustrates a cautious reinvestment stance during the earnings improvement.
Operating performance was catalyzed by tight expense controls alongside credit stability supporting improved net interest margins within its focused geographical domain.
Historical performance (annual)
| FY | Net ($mm) | CFO ($mm) | Capex ($mm) | Net YoY |
|---|---|---|---|---|
| 2025 | 3 | 1 | 0 | +317.8% |
| 2024 | -1 | 2 | 1 | -78.0% |
| 2023 | -1 | 2 | 6 | -141.8% |
| 2022 | 2 | 3 | 0 |
Source: SEC companyfacts cache [F1].
Capital returns and efficiency (annual)
| FY | Div ($) | Buybacks ($mm) | FCF ($mm) |
|---|---|---|---|
| 2025 | 593000 | 3 | 1 |
| 2024 | 504000 | 2 | 1 |
| 2023 | 368000 | 2 | -3 |
| 2022 | 3 |
Source: SEC companyfacts cache [F1].
Note: Equity figures approximate book equity per year-end; all monetary values are USD millions or thousands as noted [F1]
Loan Portfolio Composition and Historical Growth Drivers
The company’s revenue base is anchored by a diversified loan portfolio emphasizing several key sectors: residential real estate, commercial real estate (CRE), construction loans, municipal loans, agricultural lending, and consumer credit [S1][S13]. Residential lending predominantly centers on one-to-four family homes with fixed-rate structures providing predictable interest income streams amid rate volatility [S6]. CRE exposures include larger loan balances tied closely to property cash flows; underwriting emphasizes debt service coverage ratios (DSCR) above targeted thresholds (typically minimum aggregate DSCR ~1.20x), borrower cash flow strength, and thorough collateral appraisals [S15]. Construction loans carry elevated risk due to timing and market absorption variables but are tightly controlled via internal approval limits (e.g., Board approvals for loans ≥$2.5 million) [S6].
Municipal loans represent roughly 4.8% of total loans at December 31, 2025 ($14.9 million), secured mainly by tax or revenue pledges offering credit enhancement through government-backed cash flows [S9]. Additionally, small consumer portfolios (~1.5% of loans) consist largely of asset-secured personal loans such as used vehicles along with deposit-secured share loans [S9]. TCBS mitigates risk through regular financial statement monitoring for CRE clients (quarterly or semiannual depending on loan size), strict collateral requirements including title insurance and casualty coverage aligned with principal amounts, and environmental assessments where relevant [S6][S15].
Loan growth drivers over recent periods are linked closely to regional economic expansion patterns — including increasing population movement into Mineola and surrounding counties driven by lower cost living and remote-working flexibility that supports residential lending activity [S13]. Nonetheless, overall loan volumes did not shift significantly in absolute terms given operating environment challenges.
Regional Market Focus: Opportunities and Competitive Challenges
TCBS’s operational footprint spans several counties across eastern Texas plus branch offices near Tyler and the Dallas-Fort Worth Metroplex region [S13]. Key hubs include Mineola (Wood County), Edgewood (Van Zandt County), Lindale (Smith County), each benefitting from demographic shifts such as retiree influxes attracted by health care infrastructure and recreational amenities [S13]. The Tyler metro area serves as an economic anchor with diverse employment spread across manufacturing, education (Tyler Junior College), healthcare systems, and consumer retail anchors like Walmart distribution centers [S13]. Major employers within TCBS’s lending catchment include Morton Salt Company mines near Grand Saline and Sanderson Farms’ poultry operations — illustrating industry variety that cushions sectoral concentration risks somewhat.
Despite localized advantages rooted in relationship banking and service customization typical of community-focused institutions, TCBS encounters stiff competition for both loans and deposits from large money center banks with deep pockets as well as other regional community banks and credit unions—making margin capture challenging [S13]. This intensifies pressure on pricing power especially for commercial lending where incumbent players dominate corporate relationships leveraging broader product suites.
Regulatory oversight by the Federal Reserve Board alongside state authorities imposes prudential limits influencing balance sheet expansion strategies—particularly for a smaller player embedded within Texas savings bank regulations [S1]. The firm's membership in the Federal Home Loan Bank system also facilitates access to liquidity buffers enhancing funding flexibility albeit within caps.
Capital Structure, Liquidity, and Credit Quality Trends
Funding composition reveals dominant reliance on stable core deposits aggregating approximately $339 million at year-end 2025 with roughly $49 million advances from Federal Home Loan Bank facilities supplementing liquidity needs [S10][F1]. Deposits show stable mix distributions between noninterest-bearing ($49 million) and interest-bearing balances ($290 million), consistent through recent reporting periods suggesting resilient customer stickiness amidst geographic concentration.
Loan asset quality indicators portray prudent underwriting results: delinquency management protocols initiate borrower engagement promptly at payment delinquencies beyond fifteen days progressing toward collection outreach up to foreclosure processes past ninety days if workout alternatives fail [S6]. At fiscal year-end, classification metrics categorize the vast majority of financing receivables as 'pass' status under regulatory loan grading schemes with limited substandard or special mention exposures across residential, commercial, agricultural portfolios [S19][S24]. Nonperforming assets remain minimal relative to total assets indicating sound risk control although concentration risks inherent in commercial real estate remain monitored via routine DSCR scrutiny and financial covenant enforcement.
The allowance for credit losses approximates conservative provisioning reflective of current macroeconomic conditions without material reserve build-ups seen during earlier stress episodes [F1][S6]. Additionally, tangible collateral including title insurance on mortgage portfolios along with equipment liens backing commercial lines mitigates loss severity potential.
Capital Allocation Priorities: Dividends, Buybacks, and Investments
TCBS’s shareholder return strategy blends incremental dividend growth coupled with substantial share repurchase programs enhancing capital efficiency post-turnaround [F1][S16]. Dividend payments scaled up near $593K in FY2025 compared to $504K the year prior indicating confidence in sustained earnings power [F1]. Simultaneously repurchases accelerated notably reaching over $3.16 million—a doubling relative to FY2024 levels—revealing opportunistic capital deployment aimed at offsetting dilution or improving per-share metrics amid limited organic growth avenues.
Investment back into fixed assets demonstrated restraint following exceptional capex spike three years prior; current expenditures under $400K highlight a deliberate posture towards maintaining rather than aggressively expanding physical footprint or technology infrastructure absent clear strategic initiatives [F1]. Balancing capital returns while ensuring regulatory capital ratios remain robust underpins board-level capital policies aligned with federal oversight norms for regional institutions.[S16]
Guidance Signals and What Future Performance Could Depend On
No explicit future guidance is articulated within recent SEC filings or public disclosures; however analysts should monitor critical operational variables such as the trajectory of commercial real estate loan demand particularly within office/hospitality sub-segments subject to evolving Texan economic trends.
Credit quality dynamics remain pivotal given macroeconomic uncertainty around inflationary pressures impacting borrower cash flows or collateral valuations. Management commentary suggests ongoing vigilance in loan portfolio reviews aligned with risk-adjusted pricing frameworks.
Regional demographic shifts—specifically continued population influx facilitated by remote work trends—could serve as organic growth drivers fostering residential mortgage originations though offset partially by margin compression pressures amid heightened competition.
Capital deployment direction regarding share repurchases versus reserve-building or technological upgrades will reflect management’s balanced approach towards shareholder value creation against prudential bank stewardship imperatives.
Risks Unique to Concentrated Regional Banks Like TCBS
Concentration risk is salient given TCBS’s geographic focus confined largely to eastern Texas counties alongside branch locations nearby Tyler/Dallas metro areas—areas benefiting from specific local economic drivers but vulnerable if these economies deteriorate unexpectedly or real estate cycles reverse abruptly.
Sectoral concentrations notably within commercial real estate expose renewed vulnerability should tenant defaults surge or asset prices soften impacting collateral coverage ratios underpinning loan recoveries.
Competitive intensity extends beyond traditional banks encompassing fintechs or non-bank lenders nibbling at consumer/SME financing niches thereby further compressing yields.
Regulatory capital constraints limit aggressive balance sheet growth relative to larger money center banks possessing deeper capital reservoirs; this restricts rapid scaling opportunities requiring disciplined organic growth initiatives.
Liquidity management tied closely to core deposit stability demands continuous engagement since loss of key depositors could compel reliance on higher-cost wholesale funding sources adversely impacting net interest margins.
Overall TCBS navigates typical small regional banking headwinds compounded by sharply competitive Texan markets but benefits still derive from entrenched client relationships buttressed by disciplined credit culture aligned with regulatory safeguards.
This report is intended solely for informational purposes regarding Texas Community Bancshares’ recent financial performance and strategic positioning based on publicly available data without providing investment advice.
Disclaimer: This is research-only, informational analysis and not investment advice. It may include AI-generated interpretation and general industry context. Always verify important details using primary sources.
Comments