
Transcontinental Realty Investors Encounters Earnings Volatility While Holding Strong Asset Liquidity
The company’s Q2 2026 report highlights revenue growth offset by net losses, underscoring operational challenges despite a solid cash position.
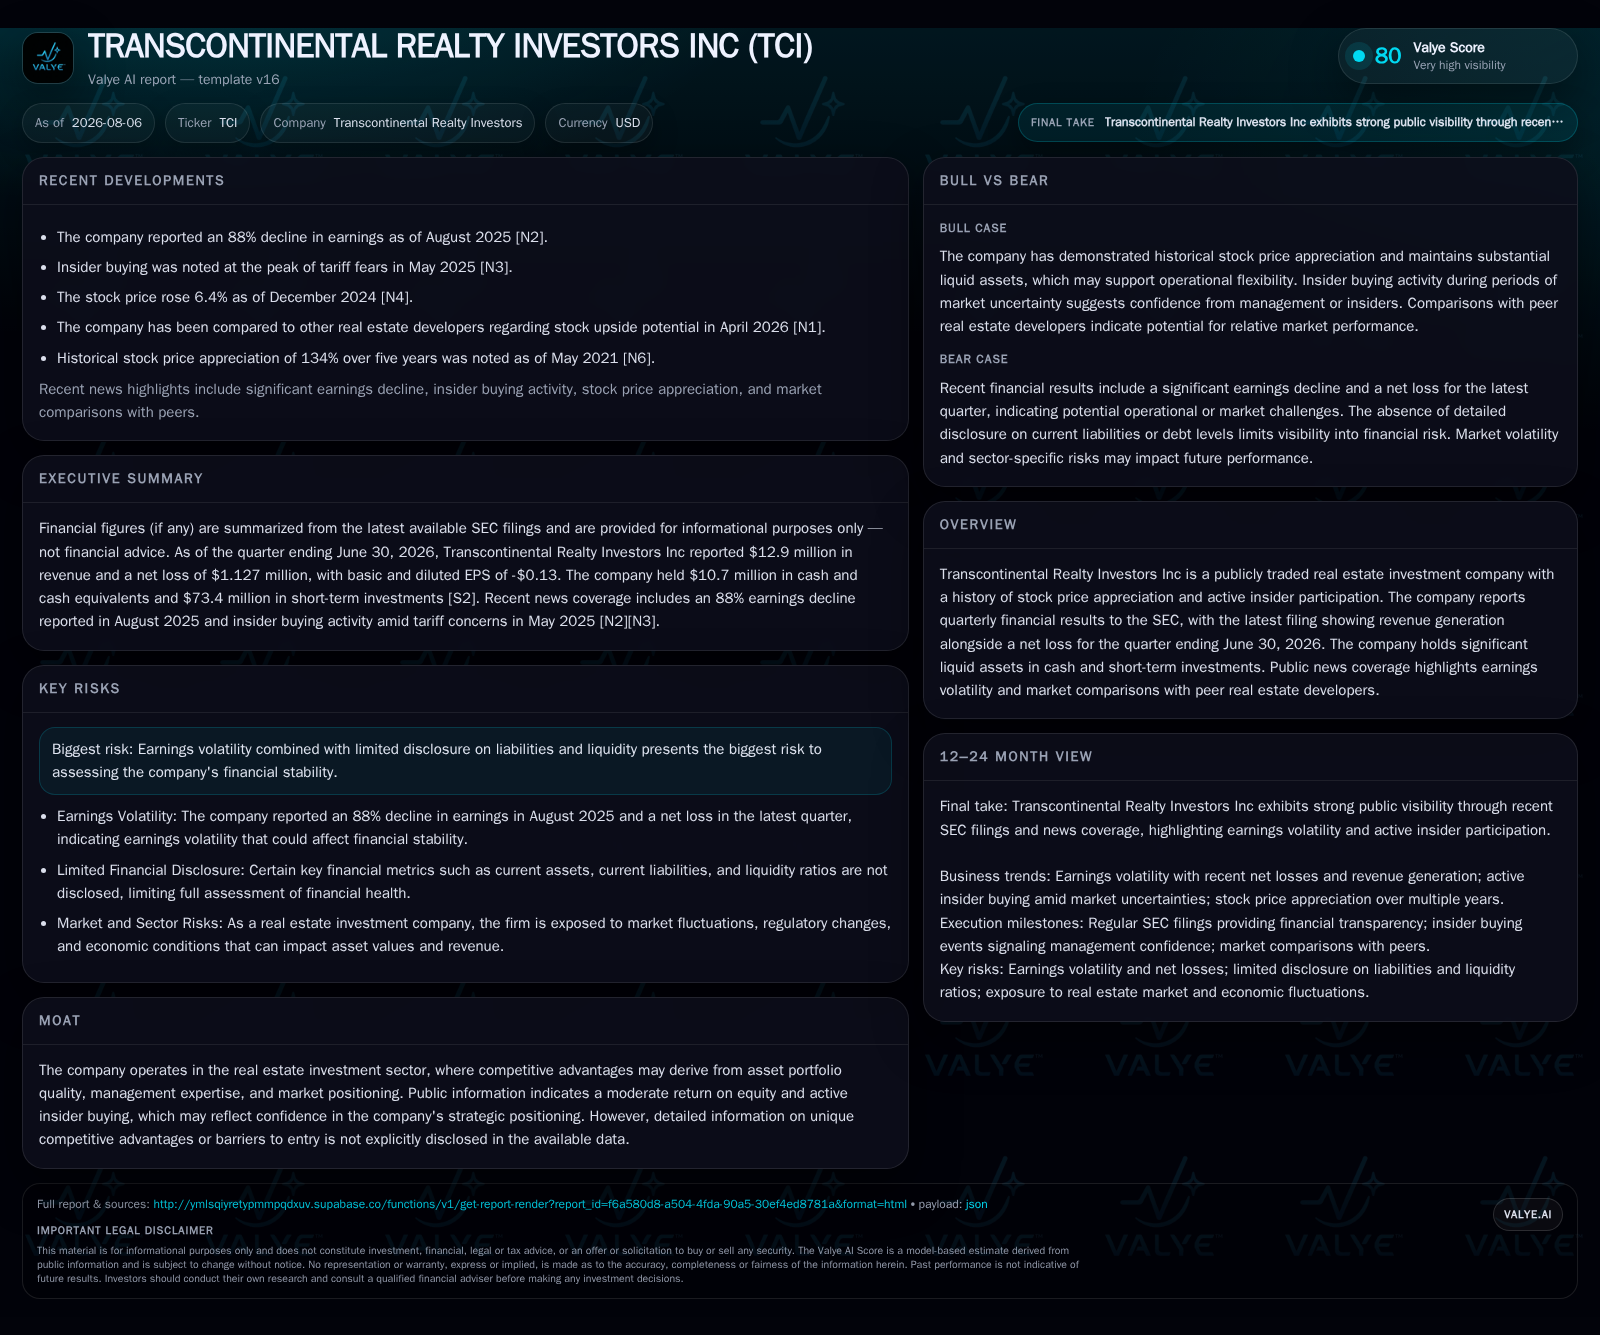
Transcontinental Realty Investors reported revenue generation alongside a net loss for Q2 2026, reflecting volatility that underlines the complexities of managing a leveraged real estate portfolio in current markets. The company maintains over $10 million in cash and equivalents, providing a liquidity buffer against refinancing risks tied to its approximately $211 million debt load as of year-end 2025. Portfolio quality and occupancy dynamics remain crucial to stabilizing Funds From Operations (FFO) and net operating income (NOI), with lease expirations and tenant concentration risks material to the near-term outlook.
Latest Quarterly Signs of Earnings Volatility Despite Revenue Gains
Transcontinental Realty Investors' latest quarterly filing dated August 6, 2026, provides a snapshot of continuing operational challenges despite top-line expansion. The company recorded revenue but also reported a net loss for the quarter ended June 30, 2026 [S2][S3]. This juxtaposition suggests that while property operations generate leasing income, underlying costs or episodic expenses weigh on profitability. In real estate investment trusts (REITs), such volatility often signals fluctuations in Net Operating Income (NOI) or non-cash items affecting accounting profits but not necessarily cash flow.
This divergent pattern indicates unstable operating leverage where fixed financing costs may outpace NOI growth during periods of market softness or tenant turnover. For Transcontinental, sustaining stable Funds From Operations (FFO)—a standard industry metric more representative of recurring cash flow—remains uncertain without improved rent collection or occupancy levels [S3]. The quarterly loss underscores a gap between revenue inflows and expenses that management must address through portfolio or capital structure adjustments.
How Transcontinental’s Asset Portfolio Drives Operating Cash Flows Amid Market Challenges
The core of Transcontinental’s business model lies in owning, managing, and leasing income-producing real estate assets. Rental income is primarily derived from commercial tenants under lease contracts that vary by term length and renewal rates, affecting occupancy stability [S1]. Occupancy rate and lease renewal metrics are critical KPIs here; higher retention limits vacancy-related revenue gaps while supporting same-property NOI growth.
Though detailed segment disclosures are limited, filings indicate the firm’s portfolio contributes recurring leasing revenues that fluctuate with market demand conditions and tenant credit profiles—a common dynamic in publicly traded REITs [S1][S2]. Effective asset management practices, including tenant diversification to mitigate concentration risk, directly influence cash flow predictability. Competitors like Equity Residential or AvalonBay balance similar portfolio strategies but often wield greater scale and geographic diversity, which can reduce earnings volatility via market risk spread.
Operating efficiencies also hinge on prudent capital expenditure oversight (CapEx) to maintain property condition without excessive spending pressure on operating margins. Transcontinental’s ability to improve lease spreads—that is, increasing rents on renewal agreements above expiring lease rates—will be pivotal in countering inflationary cost pressures [S1]. Tenant behavior amid economic cycles can cause sharp swings in occupancy trends, which would materially affect the company’s cash flow profile.
Debt Profile Focus: High Leverage Raises Refinancing and Interest Coverage Questions
Transcontinental's balance sheet features substantial leveraging typical for REITs aiming to amplify returns on equity through debt-financed asset acquisition [F1]. As of the end of 2025, total debt stood at approximately $211.4 million with net debt—total debt minus cash and short-term investments—close to $200.7 million [F1]. Cash & equivalents amounted to about $10.7 million at the end of Q2 2026 [F1], indicative of a relatively modest liquidity cushion given the scale of obligations.
Upcoming debt maturities require close monitoring since delays or unfavorable refinancing terms could increase interest expenses significantly [S2]. Earnings volatility compounds this concern by potentially impairing interest coverage ratios—a key sector metric reflecting ability to service debt from operating earnings.
While some peer REITs manage lower leverage ratios with broader access to capital markets or longer-maturity debt stacks, Transcontinental’s elevated leverage combined with cyclical income swings could constrain financial flexibility absent sustained NOI recovery or asset monetization strategies.
Competitive Context: Trading Off Portfolio Quality Against Sector Benchmarks
In a sector with substantial public comparables such as Equity Residential or AvalonBay Communities, Transcontinental appears smaller in scale but similarly exposed to market cyclicality inherent in property leasing operations [S1]. Peers typically emphasize portfolio diversification across geographies or property types—residential versus commercial—to smooth earnings variability.
The available information provides no explicit advantage indicating unique barriers to entry for Transcontinental; however, active insider buying suggests management confidence in existing strategic positioning. Still, absence of clear competitive differentiation means the company must rely heavily on asset quality maintenance and tenant relationship management to sustain occupancy levels.
No detailed data is available regarding capitalization rates (cap rates), but market benchmarks imply that properties outside premium segments tend towards greater valuation sensitivity during downturns. Transcontinental thus faces typical sector risks from valuation pressures impacting both fair value measurements and potential sale proceeds should capital recycling become necessary.
Growth Outlook Anchored to Occupancy Trends, Lease Renewals, and Potential Acquisitions
Key growth drivers for Transcontinental revolve around improving occupancy rates through lease renewals at accretive rent levels. Increasing lease spreads allows landlords to offset inflation-driven expense increases while enhancing NOI margins [S1]. Strategic acquisitions or redevelopment projects might supplement organic growth if financed prudently amidst cautious capital markets.
Economic growth remains a tailwind for commercial space demand; however, regional market dynamics can vary substantially influencing local occupancy trends [S1]. Moreover, capitalization of acquisition opportunities depends on available liquidity balanced against existing leverage constraints. Enhanced operational efficiencies may also play a role in incremental margin improvements.
Absent detailed disclosures on pipeline assets or development initiatives, external factors like macroeconomic conditions dictate much of near-term growth potential. Monitoring sequential occupancy reports reflected in quarterly filings will be an essential metric signaling momentum.
Key Risks from Tenant Concentration and Macroeconomic Weaknesses to Monitor Closely
Among several risks flagged in the annual filing are those stemming from single or few large tenants representing material percentages of leased space [S5]. Concentration exacerbates vulnerability to tenant defaults or early lease terminations which would materially reduce rental income.
Additionally, ongoing inflationary pressures can escalate operating expenses not fully recoverable via rent escalations within existing lease contracts [S5]. Interest rate volatility further elevates refinancing risk given high debt exposure noted earlier. Regulatory factors potentially affecting property taxation or zoning add another layer of uncertainty which could impact future profitability.
Earnings volatility documented across quarterly cycles adds complexity when forecasting financial health or dividend sustainability—both critical considerations for stakeholder confidence.
What to Watch Next: Operational Momentum and Refinancing Milestones in Focus
Critical near-term monitoring points include subsequent quarterly releases detailing occupancy rates trends and lease renewal success key performance indicators confirming whether recent operating losses represent transitory disruptions versus structural challenges [S2][S3].
Attention should also focus on imminent debt maturity schedules uncovered from public statements or filings informing refinancing timelines. Successful navigation through these refinancing events with manageable cost increments would validate balance sheet resilience despite leverage.
Further disclosure regarding property acquisitions or dispositions would provide insight into management’s tactical allocation between growth pursuits versus deleveraging priorities [S3].
Financial Profile Discussion: Liquidity Cushion Versus High Debt Load
As of June 30, 2026, Transcontinental held approximately $10.7 million in cash and equivalents [F1], underpinning its short-term liquidity position against working capital needs and near-term debt repayments. However, juxtaposed against the sizable year-end 2025 total debt balance estimated at $211.4 million—resulting in net debt around $200.7 million—the company operates with high financial leverage typical but demanding vigilant capital management [F1].
Liquidity sufficiency will be tested against refinancing needs amid volatility in operating results where negative net income suggests sensitivity to rental cycle fluctuations or non-operating expenses impacting profit margins [S2][S3]. Maintaining adequate interest coverage without eroding cash flow stability remains a key challenge going forward.
In sum, Transcontinental's current financial metrics illustrate a firm maintaining decent cash buffers yet exposed to elevated balance sheet risk sourcing from its commitment structure and earnings variability common within mid-sized REITs today.
This analysis draws exclusively on company-reported SEC filings through August 6, 2026 ([S1][S2][S3]) supplemented by firm-wide financial snapshots ([F1]). Commentary integrates real estate investment trust sector context referencing typical operational KPIs vital for interpreting the company's results without speculative assumptions beyond disclosed facts.
Disclaimer: This is research-only, informational analysis and not investment advice. It may include AI-generated interpretation and general industry context. Always verify important details using primary sources.

Comments