
Teradyne's Growth and Margins Balance Cyclical Demand with Supply Chain and Customer Concentration Risks
Teradyne's 2025 results reflect solid top-line growth and disciplined capital returns amid industry cyclicality and regulatory pressures.
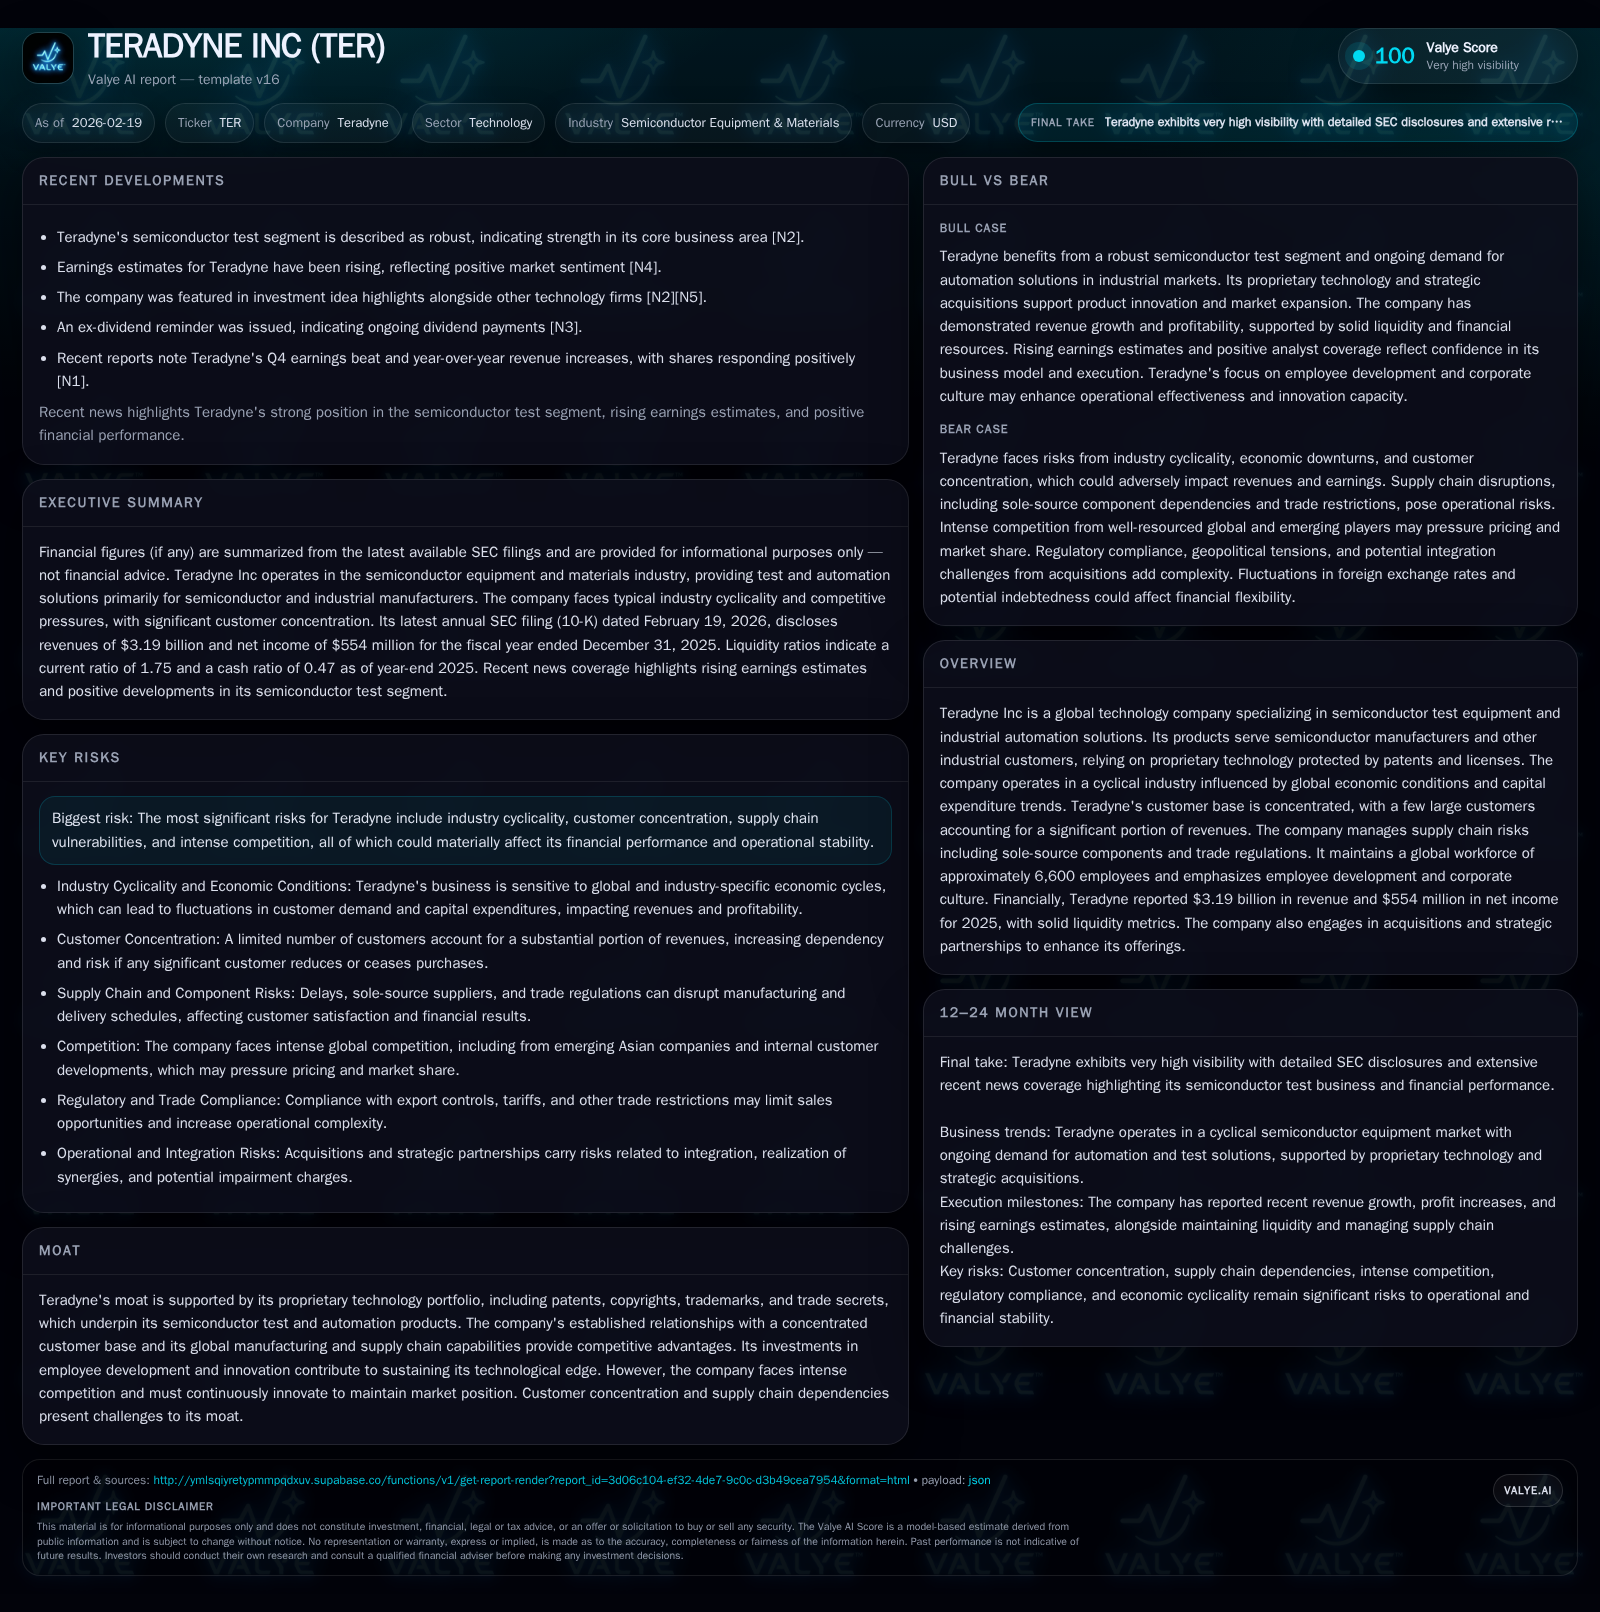
Teradyne Inc generated $3.19 billion in revenue for fiscal 2025, marking a 13.1% increase from 2024 driven by the semiconductor test segment. Operating income rose 9.5%, though net income growth was modest at 2.2%, reflecting margin pressure from supply chain constraints and investment in capacity. The company faces ongoing risks including customer concentration, intellectual property challenges, export controls, and industry cyclicality. Teradyne maintains strong operating cash flow and returned significant capital via dividends and buybacks, underscoring disciplined capital allocation within a volatile market environment.
Introduction
Teradyne Inc operates at the confluence of semiconductor test equipment production and industrial automation solutions—a niche characterized by pronounced cyclicality tied closely to semiconductor capital expenditure trends globally [S14]. The company's reported $3.19 billion revenue for fiscal year 2025 marks a resumption of growth following varied results in preceding years, evidencing recovery aligned with an uptick in chipmaker spending [F1]. This analysis unpacks the underpinnings of Teradyne's recent financial performance, its strategic positioning amid competitive pressures and regulatory challenges, and what underlies its outlook.
Historical Performance Overview
Historical performance (annual)
| FY | Rev ($bn) | Net ($mm) | CFO ($mm) | OpInc ($mm) | Rev YoY | Net YoY |
|---|---|---|---|---|---|---|
| 2025 | 3.2 | 554 | 674 | 650 | +13.1% | +2.2% |
| 2024 | 2.8 | 542 | 672 | 594 | +5.4% | +20.9% |
| 2023 | 2.7 | 449 | 585 | 501 | -15.2% | -37.3% |
| 2022 | 3.2 | 716 | 578 | 832 |
Note: Omitted columns lack sufficient annual XBRL coverage in the provided tags (need ≥2 annual points): Capex. Source: SEC companyfacts cache [F1].
Capital returns and efficiency (annual)
| FY | Div ($mm) | Buybacks ($mm) | FCF ($mm) |
|---|---|---|---|
| 2025 | 76 | 702 | 450 |
| 2024 | 76 | 199 | 474 |
| 2023 | 68 | 397 | 426 |
| 2022 | 70 | 752 | 415 |
Source: SEC companyfacts cache [F1].
Note: Free cash flow approximated as CFO minus Capex
The volatility captured above aligns with semiconductor industry trends marked by cyclical peaks—such as the boom in early-2022—and subsequent downturns triggered by macroeconomic headwinds or inventory corrections [S14]. Revenue declined notably in fiscal year (FY) ’23 before rebounding strongly in FY ‘24-‘25 as chipmakers renewed capital intensity.
Operating income's wide swings reflect the impact of supply chain constraints inflating costs while demand-driven volumes fluctuate. After peaking at $832 million in FY22, operating income fell sharply in FY23 but has since partially recovered [F1]. Net income growth has lagged operating income gains recently due to elevated investments in R&D and capacity buildout aimed at sustaining leadership amid competitive technology cycles.
Operating cash flow demonstrates resilient conversion despite earnings volatility, enabling steady dividends and notably heavier stock repurchases recently as part of capital return strategy [F1]. Capital expenditures have increased commensurately with the need to enhance manufacturing footprint—both through internal capacity expansions (e.g., Cebu site in the Philippines) and external contract manufacturers primarily located across Southeast Asia [S19][S19].
Business Segments and Competitive Positioning
Teradyne’s core revenue driver remains its semiconductor test segment, which accounts for the majority of sales to a concentrated set of large customers [S4][S5]. The firm develops advanced test systems that verify integrated circuits' functionality during production, a critical step as device complexity escalates particularly with nodes moving into sub-10nm processes.
Proprietary technology protected by a portfolio of patents, copyrights, trademarks, and trade secrets forms the backbone of its competitive moat [S9][S23]. These assets enable differentiation through product performance characteristics crucial for discerning semiconductor fabs seeking yield optimization.
Customer concentration presents double-edged exposure: while strong relationships enhance entry barriers for competitors, reliance on top five customers accounting for close to half of revenues entails vulnerability if order timing or spending priorities shift unexpectedly [S5]. Consolidation trends within semiconductor manufacturers further intensify this concentration risk.
Globally distributed manufacturing leveraging contract partners like Flex Ltd., Plexus Corp., and SAM Meerkat enables geographic cost efficiency but exposes supply chain risk especially amid component shortages or tariffs impacting key regions such as Malaysia and Thailand [S19][S6][S8]. Trade regulations—particularly U.S.-imposed export controls targeting technology flows to Chinese entities—have materially affected customer access in key markets [S22][S17][S26], compelling caution around sales pipeline visibility.
Industry Dynamics and Risks
Teradyne operates within a cyclical semiconductor equipment market vulnerable to macroeconomic conditions impacting capital budgets among chipmakers [S14]. Peaks correspond with surges in fab expansion or new process technology adoption; troughs reflect inventory corrections or broader economic slowdowns.
Supply chain volatility remains a persistent headwind given sole-source components and specialized parts needed for high-precision test systems [S9][S6]. Inflationary pressures on wages and materials add cost burdens not always fully passable onto customers due to competitive pricing pressures.
Competitive intensity involves legacy players enhancing their platforms alongside emerging Asian companies investing keenly in test technologies [S4]. Rapid technological evolution demands ongoing substantial R&D expenditure—as well as timely product cycle execution—to protect market share [S10][S29]. Any delays or failures would adversely affect revenues.
Regulatory risks surrounding export controls pose structural challenges for accessing certain markets or customers particularly within China’s semiconductor ecosystem [S22]. Additionally, evolving environmental compliance costs related to chemical usage mandated under directives like RoHS/WEEE represent incremental operational expenses [S24].
Human capital considerations include attracting specialized engineering talent globally amid intense competition within high technology labor pools—a factor critical to maintaining innovation velocity [S23][S20].
Future Growth Prospects
While explicit company forward guidance is unavailable from current disclosures [N10][N11], growth drivers are inferred from sector dynamics and strategic initiatives:
Semiconductor Test Segment Strength: With an anticipated sustained adoption of advanced node manufacturing (sub-10nm/7nm), demand for state-of-the-art test systems is expected to remain robust given increasing complexity requiring more sophisticated validation [N11].
Expansion in Industrial Automation & Robotics: Teradyne’s diversification into collaborative robotics (e.g., Universal Robots platform) taps growing factory automation alongside rising AI integration prospects that can augment system capabilities but entail deployment execution challenges [N12][N28].
Capacity Augmentation: Capital investments targeting internal manufacturing expansions coupled with secured relationships with contract manufacturers aim to alleviate supply bottlenecks enhancing shipment fulfillment reliability [F1][S19].
Acquisitions: Selective inorganic growth aims to broaden technical capabilities or market segments addressing automation adjacent spaces though integration complexities pose execution risks [N12][S29].
Constraints include cyclical demand fluctuations inherent to semiconductor capex patterns; geopolitical tensions influencing trade policies; potential intensification of competitor innovation; as well as possible supply chain interruptions given sole-source dependencies or localized disruptions.
Returns & Capital Allocation Strategy
Teradyne exhibits disciplined capital management balancing shareholder returns against reinvestment needs:
Approximate Return on Equity (ROE) stands near a healthy ~20% based on trailing net income over shareholder equity—reflecting efficient use of equity capital despite cyclicality-induced margin variability [F1].
Operating cash flows have remained stable around $670 million despite year-to-year earnings swings, underpinning FCF generation (~$450 million most recent year) sufficient to support both organic investments and shareholder distributions without liquidity strain [F1][S7][S25].
Annual dividend outlays hold steady near $76 million; dividend policy appears intended as consistent income component rather than aggressive payout expansion given growth investment needs [F1][N14].
Share repurchases accelerated markedly during FY25 ($702 million), representing a sizable use of cash likely intended to offset dilution from employee stock programs while signaling confidence in underlying business fundamentals amidst sector cyclicality [F1][N12].
This balanced approach supports operational resilience while enhancing per-share metrics during periods of volatile earnings.
Key Metrics To Monitor Going Forward (Analysis)
Given absence of explicit forward guidance disclosed publicly so far this year ([N10],[N11]), investors and analysts should watch closely:
- Quarterly backlog updates relative to historical volatility levels signaling order momentum or softness amid industry cycles.
- Semiconductor customer capex announcements globally influencing Teradyne’s order book strength.
- Supply chain lead times for critical components reflecting ability to meet demand surges promptly.
- R&D expenditure trends indicating commitment level toward evolving technology nodes and robotics innovation.
- Impact evolution of export controls on Chinese market access which historically contributed meaningful revenue portions.
- Margin progression as inflationary pressures ease or persist alongside pricing power dynamics.
- Share repurchase activity pace which may reflect management confidence or opportunistic capital deployment amidst valuation shifts.
Conclusion
Teradyne stands as a technologically entrenched player within semiconductor equipment manufacture balanced by diversification into industrial robotics automation—a strategy that leverages synergies while mitigating single-segment cyclicity risks. Fiscal ’25 results highlight recovery from prior downturns achieved through top-line expansion tempered by margin headwinds tied largely to external supply chain forces.
Nevertheless, vulnerabilities remain rooted in concentrated customer dependence, international trade restrictions especially vis-à-vis China, intellectual property contestations, and broad market cyclicality inherent in semiconductor capex-driven industries.
Financially robust with strong liquidity metrics allowing proactive capital allocation including increased buybacks alongside prudent capex spend, Teradyne exemplifies cautious navigation through industry ups-and-downs backed by enduring proprietary advantages supported by its global footprint across R&D engineering talent hubs and manufacturing partnerships.
While innovations such as AI-enabled testing platforms offer promising avenues for future progress, execution risk combined with external macro-political uncertainties will continue shaping Teradyne’s near-to-medium term trajectory. Ongoing surveillance over order visibility indicators plus regulatory developments will be essential for contextualizing next phase earnings trends.
This report synthesizes information available as of February 2026 without providing investment recommendations or forecasts beyond disclosed data points.
Disclaimer: This is research-only, informational analysis and not investment advice. It may include AI-generated interpretation and general industry context. Always verify important details using primary sources.
Comments