
Titan Machinery Navigates Profitability Pressure Amid Market Cyclicality and Operational Complexity
Titan Machinery’s multi-segment agricultural and construction equipment business faces profitability headwinds despite revenue growth, challenged by capital intensity, pricing pressure, and geographic exposure in a cyclical market.
Titan Machinery’s business model integrates equipment sales, parts, service, and rentals across key agricultural and construction markets in the US, Europe, and Australia. While recent revenue topped expectations, profitability remains elusive with a net loss in Q2 2027. The company’s operating costs and capital needs, combined with market cyclicality and regional economic variability, complicate margin improvement. Competitive pressures and liquidity constraints further challenge operational flexibility. Sustainable profitability hinges on operational leverage realization, cost control, and managing market demand volatility.
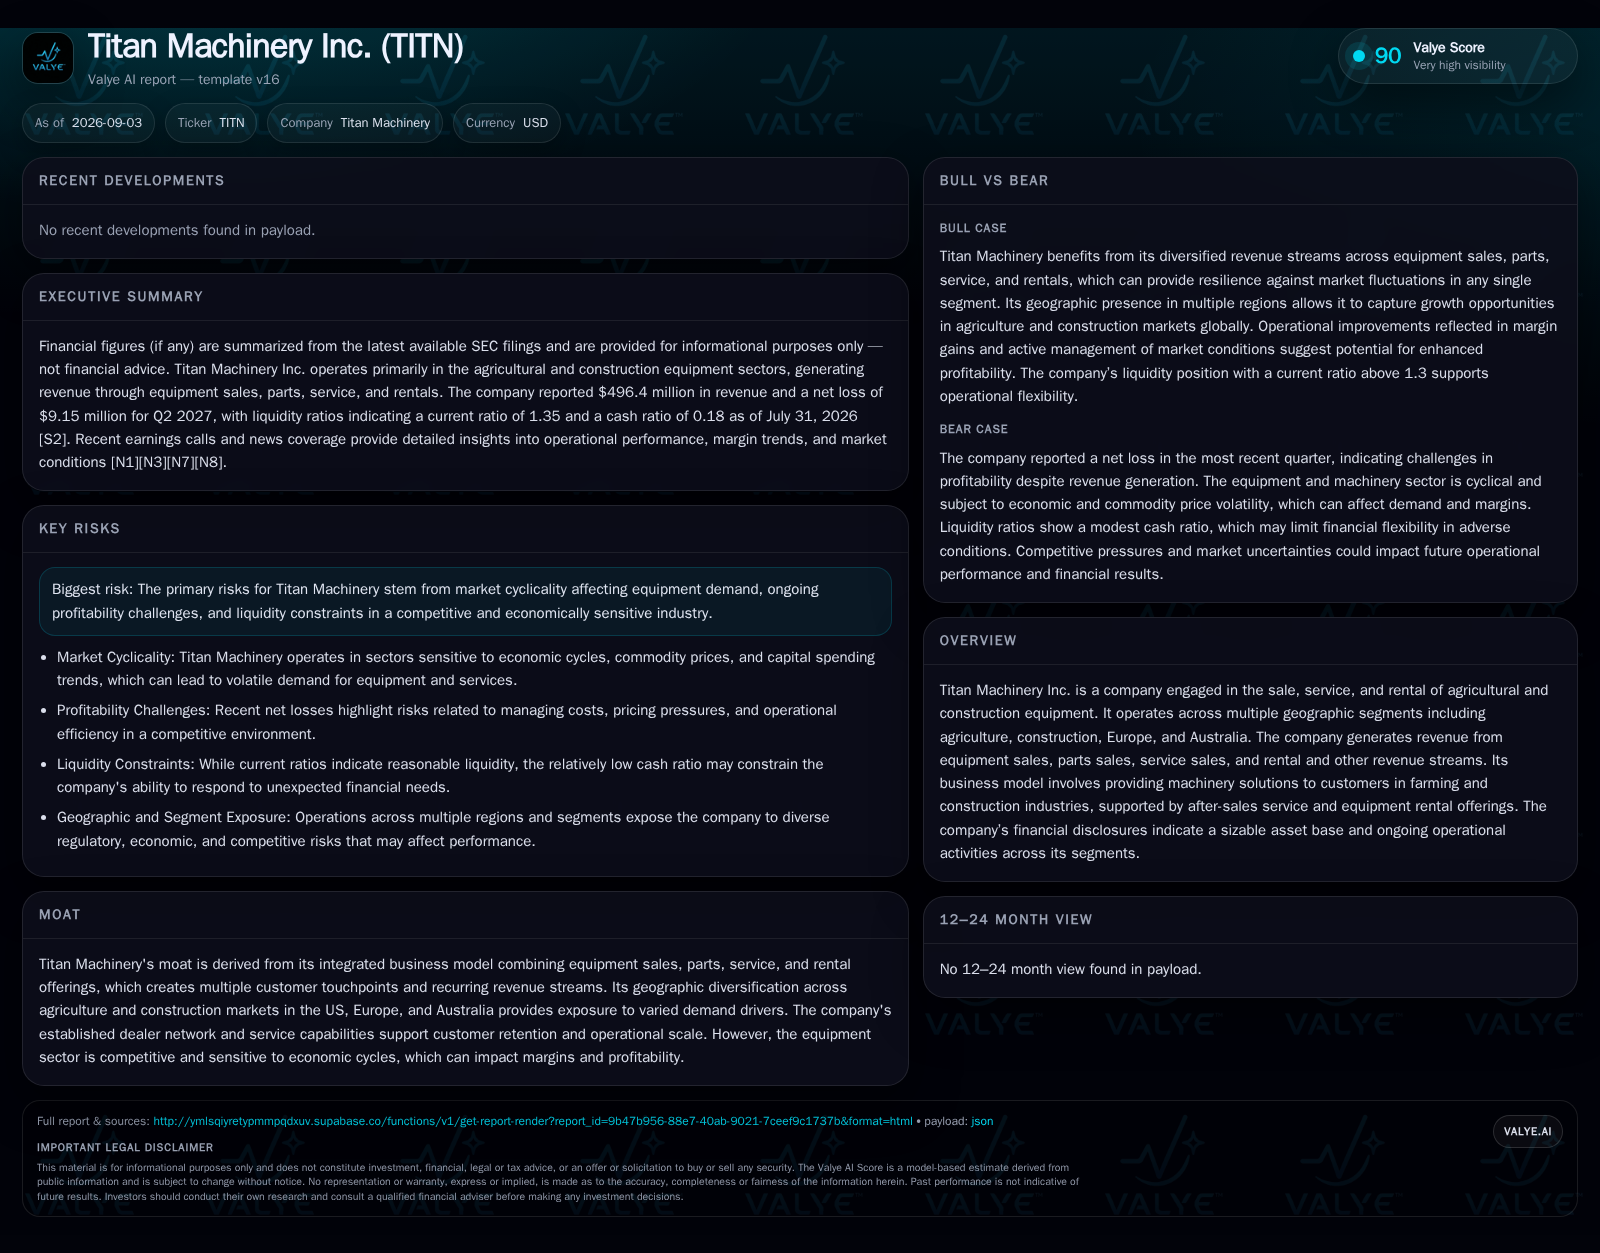
Titan Machinery Inc., a distributor and service provider for agricultural and construction equipment, operates a complex, capital-intensive business across multiple continents. Despite generating $496.4 million in revenue in Q2 2027, the company reported a net loss of $9.15 million, reflecting persistent challenges in converting sales growth into profitability. Its integrated model encompassing equipment sales, parts, service, and rental activities creates diversified income streams but also exposes the company to operational and capital demands. Market cyclicality, regional economic variability, and competitive pressures further complicate margin expansion. Titan’s financial and operational trajectory will largely depend on executing cost efficiencies, managing capital intensity, and navigating demand volatility across its key markets.
Revenue Strength Accompanied by Profitability Challenges and Capital Intensity
Titan Machinery reported revenue of $496.4 million but incurred a net loss of $9.15 million in Q2 2027, with earnings per share of -$0.40, signaling difficulty in balancing revenue growth with cost control [S2][N3]. The company’s current ratio of 1.35 suggests adequate short-term liquidity, yet its cash ratio of 0.18 points to limited readily available cash buffers [S2]. These figures reflect a business operating with a sizable asset base but under margin pressure.
Operating across agriculture, construction, Europe, and Australia, Titan’s multi-segment operations diversify revenue sources but also expose it to complex market dynamics and regional economic variability [S1]. Recent earnings calls highlight ongoing margin pressures despite revenue beats, pointing to operational challenges in managing costs, pricing, and capital allocation amidst market cyclicality [N1][N3][N8].
Capital-Intensive Equipment Distribution with Mixed Revenue Streams
Titan’s business model centers on selling new and used agricultural and construction machinery, supported by parts sales, after-sales service, and equipment rental. Equipment sales typically contribute the largest revenue share but are subject to significant capital intensity and inventory risk. Parts and service generate more recurring, higher-margin revenue, while rentals offer utilization-based income. This blend can smooth revenue volatility but requires balancing fixed and variable costs across segments.
Pricing power is constrained by OEM competition, customer price sensitivity, and cyclical demand. Fixed costs include facility operations, service personnel, and inventory carrying, creating operating leverage potential if volumes rise sustainably. However, capital expenditures to maintain inventory and service infrastructure are substantial, limiting free cash flow in downturns. Operating leverage gains depend on efficient cost management and stable or growing equipment demand.
Navigating Competition Amid OEMs, Dealers, and Rental Providers
Titan competes with OEM-affiliated dealers, independent distributors, and specialized rental companies. Its integrated model of sales, parts, service, and rental creates multiple customer touchpoints, which can foster retention and cross-selling opportunities if executed well. Its geographic diversification into Europe and Australia adds exposure to different competitive landscapes and customer preferences.
Durable advantage hinges on service quality, dealer network strength, and operational scale. However, capital intensity and margin pressure limit pricing flexibility. Switching costs for customers vary: while service and parts create some stickiness, equipment buyers may switch brands or dealers based on pricing and availability. Competitive pressure from OEMs’ direct sales initiatives and rental alternatives poses ongoing threats to Titan’s market share and pricing.
Operational Efficiency and Market Recovery Drive Margin Expansion
In a favorable scenario, Titan leverages its diversified revenue streams and geographic footprint to capture a rebound in agricultural and construction equipment demand. Improved market conditions lift equipment sales volumes, enabling better absorption of fixed costs and unlocking operating leverage. Concurrently, management’s focus on cost discipline and service optimization enhances margins in parts and rental segments.
Confirming evidence would include sustained revenue growth across segments, margin improvement in gross profit and operating income, and positive cash flow generation. Early signs might appear in order announced awards growth, higher rental utilization rates, and improved parts/service retention metrics. Falsification would occur if cyclical downturns deepen, cost pressures intensify, or competitive pricing erodes profitability despite volume gains.
Modest Growth with Continued Margin Pressure in a Cyclical Industry
The most plausible mid-path sees Titan achieving modest revenue growth tempered by persistent margin headwinds. Cyclical demand in agriculture and construction equipment remains uneven, limiting volume expansion. Pricing pressure from OEMs and competitors persists, constraining margin recovery. Parts, service, and rental revenue grow steadily but not enough to offset equipment sales volatility.
Margins improve incrementally through operational improvements but remain below historical highs due to cost inflation and capital intensity. Liquidity remains sufficient but tight, requiring careful cash management. Confirmation would come from stable revenue trends with flat to slightly improving margins and manageable losses or break-even operating income. Falsification arises if profitability deteriorates sharply or revenue declines significantly.
Demand Contraction and Margin Compression Trigger Financial Strain
A downside path involves a market downturn triggered by prolonged economic weakness or adverse commodity cycles, sharply reducing equipment demand. Lower sales volumes exacerbate fixed cost burdens, compressing margins. Pricing competition intensifies as dealers and OEMs seek share, further pressuring profitability. Capital constraints limit inventory replenishment and service capacity, eroding customer satisfaction and retention.
Evidence for this scenario includes declining revenue, widening net losses, deteriorating liquidity ratios, and negative operating cash flows. Early warning signs include rising inventory days, increased discounting, and service revenue declines. Falsification would be sustained or improving revenue and margins despite macroeconomic challenges.
Key Metrics to Monitor Operational Health and Market Dynamics
Investors should closely watch equipment sales volumes and average selling prices to assess demand and pricing trends. Parts and service revenue growth and margin trends provide insight into recurring income quality and operational efficiency. Rental utilization rates and pricing also indicate asset productivity and market conditions.
Liquidity metrics such as the current ratio and cash ratio remain critical, as does free cash flow generation to fund working capital and capital expenditures. Operating income margins and net profit/loss trends reveal cost management effectiveness. Geographic segment revenue contribution and growth rates help evaluate exposure to differing economic cycles. Customer retention rates and service contract renewals, if disclosed, would offer additional signals of competitive positioning.
Disclaimer: This is research-only, informational analysis and not investment advice. It may include AI-generated interpretation and general industry context. Always verify important details using primary sources.

Comments