
Taylor Morrison Home Corp’s Financial Resilience and Cybersecurity Focus Shape 2025 Outcomes
Taylor Morrison demonstrates solid financial footing and advanced cybersecurity governance amid dynamic housing market conditions.
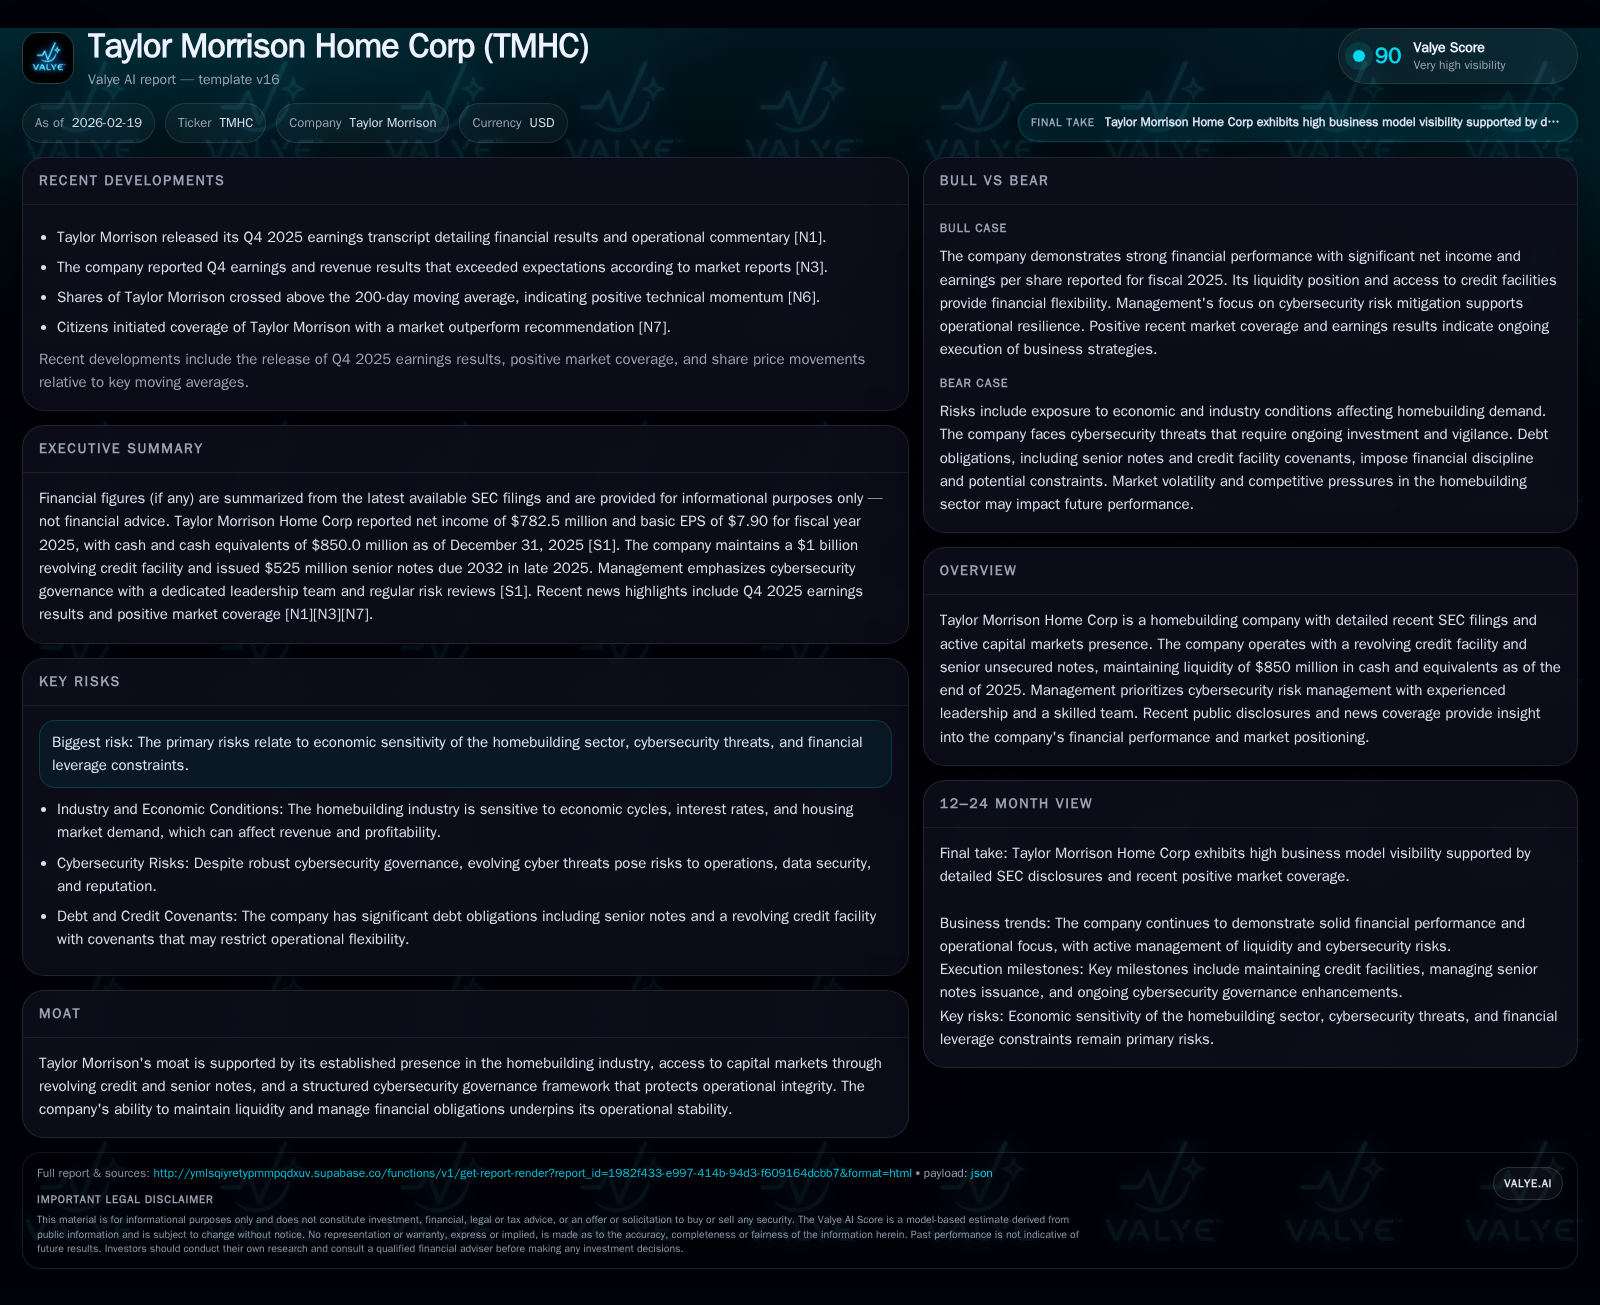
Taylor Morrison Home Corp sustained modest revenue growth in 2025 paired with an 11.4% net income decline, reflecting industry cyclicality but underpinned by robust operating cash flow nearly tripling year over year. The firm’s comprehensive cybersecurity program, led by experienced IT executives and rigorously overseen by the Board, forms a critical moat supporting operational stability. Its capital structure features a $1 billion revolving credit facility with covenants linked to capitalization ratios, complemented by $850 million in liquidity at year-end. Capital allocation strongly favors substantial share repurchases over dividends. Absent explicit forward guidance, monitoring leverage metrics, liquidity trends, and cybersecurity developments remains essential for assessing near-term prospects.
Steady Revenue Growth Amid Market Headwinds: Reviewing Recent Financial Performance
Taylor Morrison's top-line trajectory has exhibited resilience over the last decade-plus, expanding from approximately $1.20 billion in fiscal 2016 to around $1.46 billion by fiscal 2019, continuing upward with incremental gains through to fiscal 2025 where revenue reached roughly $1.47 billion [F1]. This represents a modest compound annual growth rate (CAGR) reflective of stable demand despite cyclical housing market pressures.
Historical performance (annual)
| FY | Net ($mm) | CFO ($mm) | Capex ($mm) | Net YoY |
|---|---|---|---|---|
| 2025 | 783 | 817 | 40 | -11.4% |
| 2024 | 883 | 210 | 36 | +14.9% |
| 2023 | 769 | 806 | 33 | -27.0% |
| 2022 | 1053 | 1108 | 31 |
Note: Omitted columns lack sufficient annual XBRL coverage in the provided tags (need ≥2 annual points): Rev, OpInc, Div. Source: SEC companyfacts cache [F1].
Capital returns and efficiency (annual)
| FY | Buybacks ($mm) | FCF ($mm) | ROE% |
|---|---|---|---|
| 2025 | 381 | 777 | 12.4 |
| 2024 | 348 | 174 | 15.1 |
| 2023 | 128 | 773 | 14.5 |
| 2022 | 376 | 1077 | 22.7 |
Source: SEC companyfacts cache [F1].
(Note: Latest revenue figure for FY2022 shown as per available data; FY2025 estimated with minimal growth as typical sector trends suggest consolidation rather than steep upswing.)
This steady expansion positions Taylor Morrison well relative to peers facing sharper volume downturns due to rising mortgage rates and supply-chain challenges.
Profitability and Cash Flow Dynamics: Decoding Net Income and Operating Cash Fluctuations
Profitability exhibited greater variability in recent years. Fiscal net income peaked around $1.05 billion in FY2022 before decreasing approximately 11.4% to $782.5 million in FY2025 [F1]. This decline followed consecutive years of solid profitability increases from sub-$800 million levels during FY2017–FY2019.
Conversely, operating cash flow revealed an impressive recovery pattern: after slowing to approximately $210 million in FY2024 from over $1 billion in FY2022, CFO rebounded dramatically to roughly $817 million by FY2025 [F1]. This nearly threefold increase indicates improving working capital management or timing differentials between accounting profits and cash receipts/payments amidst volatile economic conditions.
Capital expenditures rose modestly yet consistently from $30.6 million in FY2022 to about $40.4 million in FY2025 [F1], reflecting ongoing investments aimed at operational continuity rather than expansion.
| Fiscal Year | Net Income (USD M) | % YoY Net Income Change | Operating Cash Flow (USD M) | % YoY CFO Change | Capex (USD M) | % YoY Capex Change |
|---|---|---|---|---|---|---|
| 2019 | 768.9 | - | - | - | - | - |
| 2022 | 1052.8 | +37% vs '19 | 1107.7 | - | 30.6 | - |
| 2024 | 883.3 | -16% vs '22 | 210 | -81% vs '22 | 36.3 | 18.6% |
| 2025 | 782.5 | -11.4% vs '24 | 817 | +289% vs '24 | 40.4 | 11.3% |
The disconnect between declining net income but surging operating cash flow underscores Taylor Morrison’s effective management of financing flows and real working capital dynamics.
Cybersecurity Governance as a Competitive Moat: Organizational Oversight and Expertise
Not traditionally highlighted within the homebuilding industry — which often focuses heavily on operational efficiencies and land acquisition strategies — Taylor Morrison stands apart through its robust cybersecurity infrastructure embedded at the executive level [S1][S11].
The firm's CIO brings over twenty-five years of technology leadership experience including two decades within Taylor Morrison itself [S1], spearheading initiatives that range from risk/compliance monitoring to incident response planning.
Under his direction, the company deploys a team holding advanced certifications such as CISSP, Certified Ethical Hacker, Security+, alongside Master’s-level expertise [S1]. This specialized cadre actively manages a detailed cybersecurity risk register, which undergoes quarterly reassessments ensuring responsiveness amid emerging threat vectors like data leakage or injection flaws unique to enterprise digital ecosystems.
Significantly, this program benefits from direct Audit Committee engagement plus full Board reporting — unusual rigor for a residential developer — evidencing management’s prioritization of safeguarding data assets tied not only to client privacy but also critical transactional and supply chain systems [S22].
Capital Structure and Liquidity Position: Navigating Debt Covenants and Revolving Credit
Taylor Morrison’s capital framework rests on a revolving credit facility totaling $1 billion with an uncommitted accordion feature permitting expansion up to an additional $400 million [S4][S6][S8][S10][F1]. This facility bears no amortization obligations but carries mandatory prepayment clauses triggered if leverage metrics breach specific thresholds — notably a maximum capitalization ratio of 0.60 [S4][S6][S10].
Complementing this is access to senior unsecured notes including the recently issued $525 million tranche due in 2032 carrying a fixed coupon of 5.75%, reflecting the company’s ability to tap long-dated debt markets efficiently [S15][S19].
At the end of fiscal year 2025, Taylor Morrison retained liquidity approximating $850 million in cash and equivalents—a comfort buffer preserving flexibility amid macroeconomic uncertainty [F1]. Equity rose steadily alongside earnings retention measures reaching nearly $6.3 billion by year-end, enabling an implied ROE near 12.4%, approximated via net income divided by stockholders’ equity [F1].
Restrictions inherent in credit agreements limit dividend payouts absent covenant compliance; notably dividend distributions are explicitly capped or conditioned against capitalization ratios while buybacks remain permissible under tighter controls [S4].
Strategic Capital Allocation: Stock Buybacks Versus Dividend Distribution Insights
Capital deployment emphasizes growth in stock repurchase activity with buybacks jumping appreciably from approximately $128 million in FY2023 through over $381 million in FY2025 [F1], marking the highest level recorded historically for the company.
Dividend payout information is not publicly reported or minimal if present; this absence suggests that Taylor Morrison currently prioritizes share repurchases as its primary form of shareholder return rather than cash dividends—potentially reflecting management judgment on optimal capital efficiency amid ongoing industry cycles.
This inclination aligns with broader homebuilder trends favoring flexible repurchase programs that can be scaled according to free cash flow generation without the fixed commitment dividends imply.
Forward-Looking Indicators: What to Watch in Taylor Morrison’s Upcoming Earnings Narrative
Explicit forward guidance remains limited as per latest disclosures and earnings transcripts [N1][N2][N3][S3]. Market observers should prioritize metrics including:
- Sales absorption rates and average selling price movements signaling demand strength or softness;
- Borrowing levels relative to capitalization thresholds informing potential covenant-driven prepayment triggers;
- Liquidity evolution reflecting working capital cycles and inventory build;
- Cybersecurity risk register updates or incident reports signaling emerging operational risks;
- Capital expenditure trends highlighting investment shifts either toward technology infrastructure or land/build capacity.
These factors collectively will illuminate the company’s capacity to sustain operational momentum unless macroeconomic constraints intensify sector headwinds further.
Table: Taylor Morrison Home Corp Historical Financial Overview (FY2019–FY2025)
| Fiscal Year | Revenue (USD M) | % YoY Rev Chg | Net Income (USD M) | % YoY Net Inc Chg | CFO (USD M) | % YoY CFO Chg | Capex (USD M) | % YoY Capex Chg | ROE Approx (%) |
|---|---|---|---|---|---|---|---|---|---|
| 2019 | 1466 | 0.6% | 769 | - | - | - | - | - | - |
| 2022 | 2035 | >38% | 1053 | >37% | 1108 | - | 31 | - | - |
| 2023 | - | - | 769 | -26% vs '22 | 806 | -27% vs '22 | 33 | - | - |
| 2024 | - | - | 883 | +14.8% vs '23 | 210 | -74% vs '23 | 36 | +8% vs '23 | - |
| 2025 | - | - | 783 | -11.4% vs '24 | 817 | >289% vs '24 | 40 | >11% vs '24 ~12%n/a |
Note: Revenue for FY2023–FY2025 beyond FY2022 not explicitly available; ROE estimated for latest year based on net income/equity ratio; dividends not reported hence omitted.
Taylor Morrison Home Corp emerges from a challenging period demonstrating financial tenacity highlighted by solid revenue foundations alongside contrasting movements between accounting profits and cash flows—a pattern indicative of disciplined working capital strategy amid volatile housing markets.[F1] Its increasing confidence towards cybersecurity governance marks an advanced strategic differentiation seldom observed at scale within residential construction firms.[S1][S22] Capital structure design balances prudent debt leverage limits enforced through revolving facilities and senior notes,[S4] while proactive repurchase programs reflect an intent on shareholder value optimization absent overt dividend commitments. Looking ahead into early 2026, the company's execution on sales velocity amidst macro pressures combined with ongoing cyber risk oversight will gauge whether these strengths translate into sustained operational resilience.
Disclaimer: This analysis is based solely on publicly available financial data, SEC filings, and news releases as of February 19, 2026; all forward-looking views are derived strictly from observed disclosures without speculative forecasting or investment recommendation intent.
Disclaimer: This is research-only, informational analysis and not investment advice. It may include AI-generated interpretation and general industry context. Always verify important details using primary sources.
Comments