
Taylor Morrison Draws on Strong Liquidity to Weather Homebuilding Market Volatility
Q1 2026 financials showcase Taylor Morrison's ability to maintain profitability and liquidity amid economic cyclicality in residential construction.
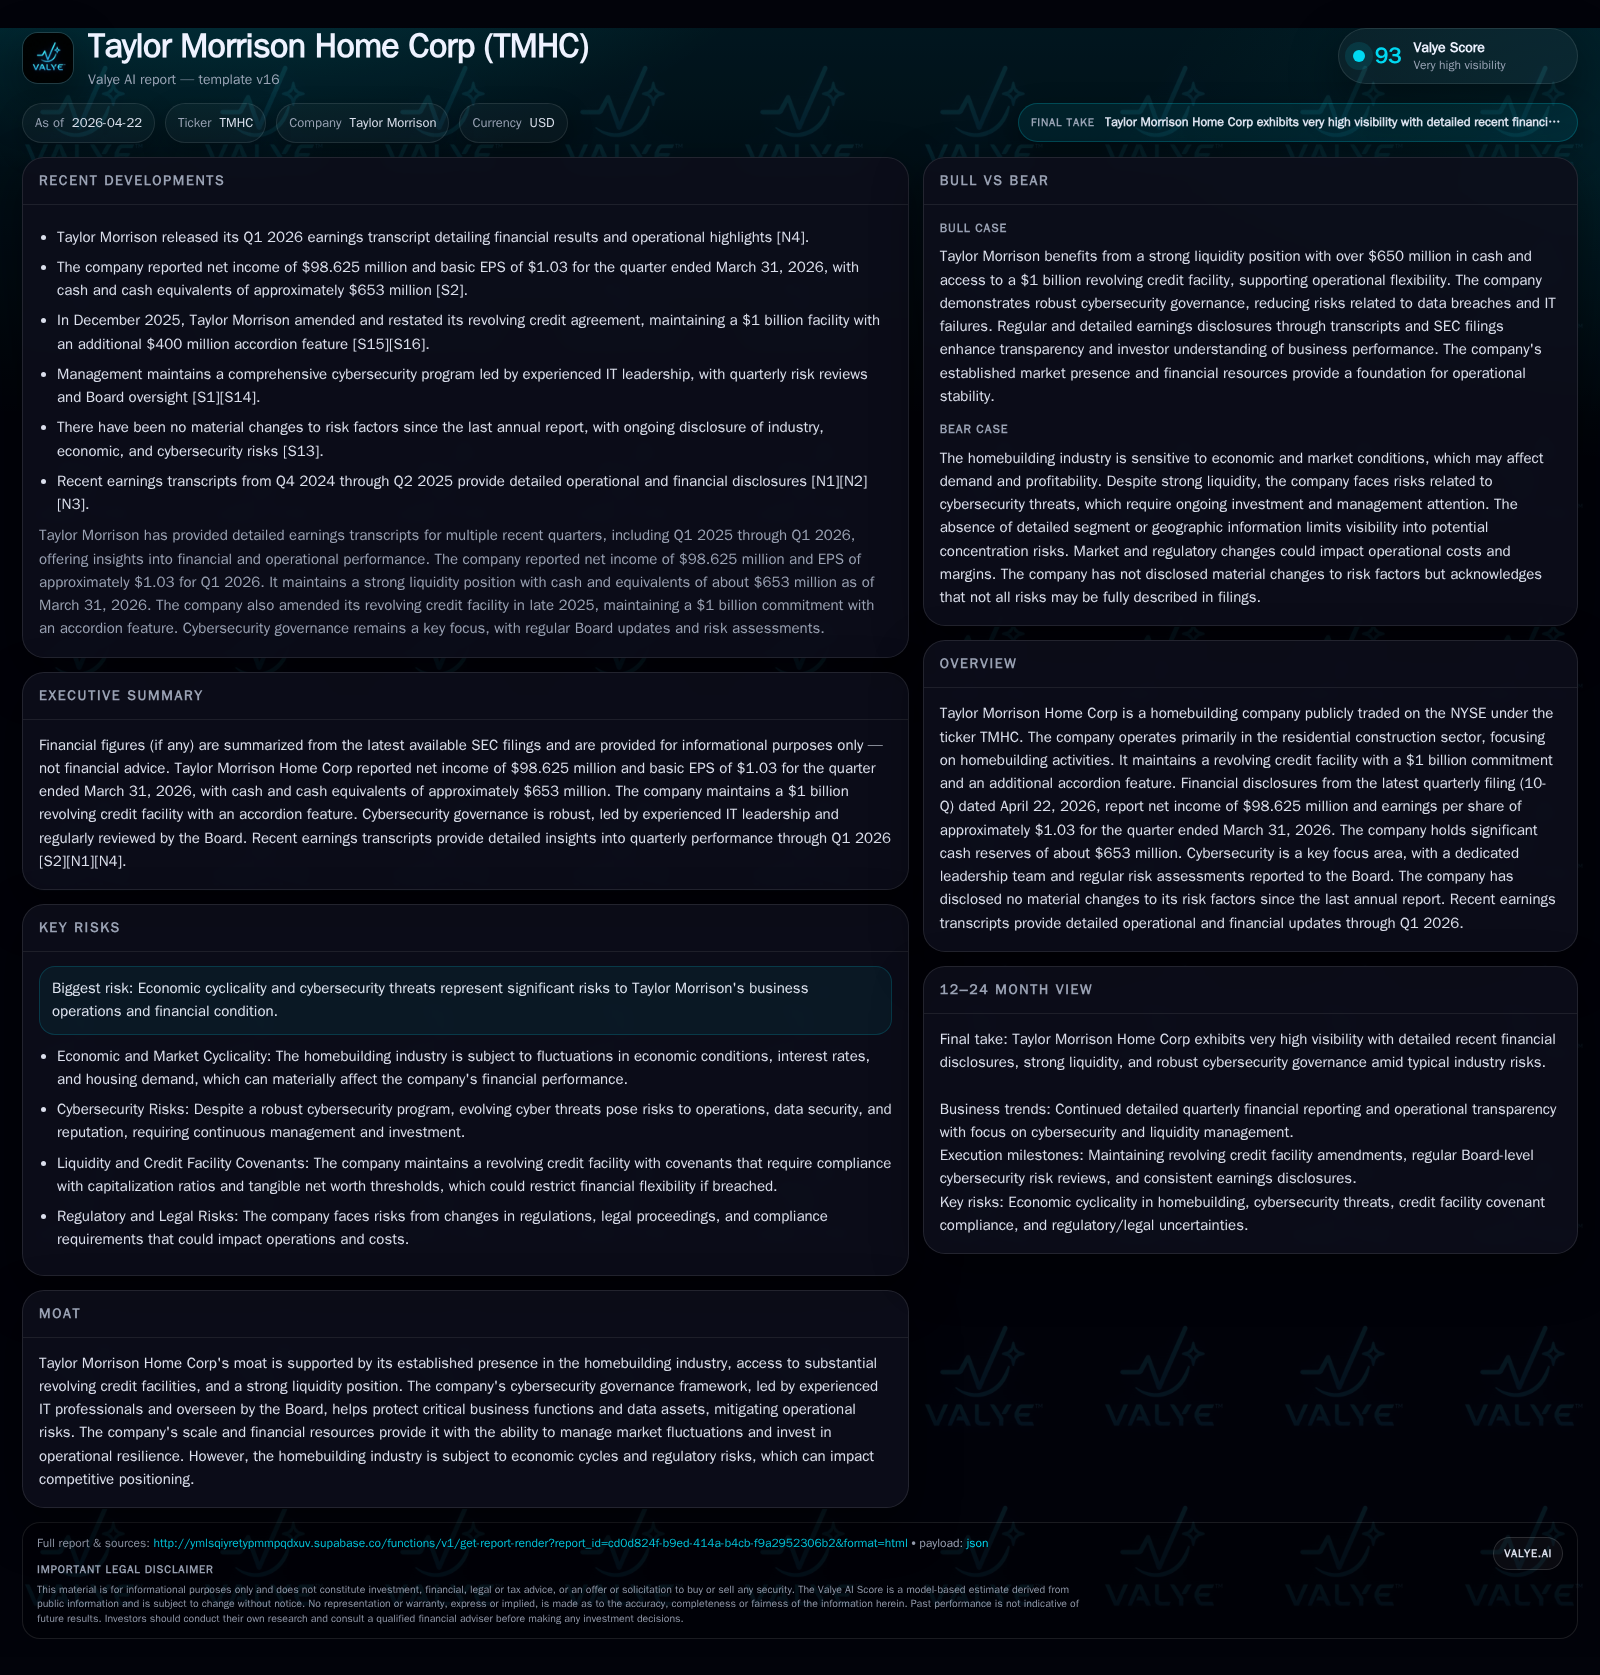
Taylor Morrison Home Corp reported solid Q1 2026 results with net income of $98.625 million and EPS near $1.03, supported by a robust cash position of $653 million and a $1 billion revolving credit facility. The company’s business model leverages its product quality, scale, and extensive geographic footprint to sustain demand despite industry cyclicality. Market pressures include fluctuating construction costs and regulatory hurdles, but Taylor Morrison’s operational discipline and cybersecurity governance lend resilience. Investors should watch forthcoming backlog data and margin trends for signs of demand stabilization or contraction.
Q1 2026 Operating Update: Strength Amid Cyclical Pressures
Taylor Morrison Home Corp’s quarterly filing dated April 22, 2026 ([S2], [S3]) reveals that the company navigated the first quarter with stable financial performance despite headwinds common to the residential construction sector. Reported net income was $98.625 million with approximately $1.03 earnings per share for the quarter ended March 31, 2026. Notably, the firm holds a strong liquidity buffer of nearly $653 million in cash and equivalents at quarter-end alongside a committed revolving credit facility of $1 billion, which also includes an uncommitted accordion feature allowing extension up to an additional $400 million if needed ([S8], [S25]). This stockpile of liquidity provides TMHC with flexibility to sustain operations and invest selectively amid market uncertainty.
The Q1 transcript ([N4]) details management’s focus on operational discipline as pricing pressures from input cost inflation challenge margins industry-wide. Nevertheless, Taylor Morrison’s earnings steadiness suggests effective cost controls and backlog management have mitigated some volatility effects. Importantly, there were no material revisions to risk disclosures relative to the February annual report ([S15]), underscoring consistency in management’s view on continuing cyclicality risks.
Business Model Deepening: Product Quality and Customer Value Proposition
TMHC’s core revenue generation stems from developing and selling new residential homes across diverse U.S. regions ([S1], [S7]). Their model encompasses acquiring land strategically, designing communities with attention to customization options for buyers, orchestrating construction phases efficiently, and managing sales through a direct channel model that reduces intermediaries.
This customer-centric approach enables them to offer homes that balance quality finishes with flexible design footprints—an attribute increasingly valued among millennial buyers aiming for tailored living spaces. The company stresses differentiating through end-to-end control of the value chain from land acquisition to closing, which supports pricing power when market conditions allow ([S1]). While competitive pressures limit unconditional premium pricing, TMHC leverages brand reputation built over years to command relative price stability versus local custom builders or national peers.
Industry Dynamics and Competitive Landscape
Within the homebuilding sector, Taylor Morrison faces intense competition from large-scale public builders such as D.R. Horton (DHI) ([N7]) and KB Home (KBH) ([N8]). These peers similarly contend with cyclical demand tied closely to macroeconomic indicators like mortgage rates and consumer confidence.
The industry structure is capital intensive, requiring access to financing for land development as well as working capital support during long build cycles. TMHC's scale affords some economies in procurement and labor contracting but does not eliminate sensitivity to raw materials price swings or skilled labor shortages that are currently industry-wide challenges ([N4]). Regulatory barriers vary regionally but add further complexity particularly around land use approvals and environmental compliance.
Pricing power is tempered under these conditions although geographic breadth moderates downside exposure—weakness in one market can be partially offset by strength elsewhere within TMHC’s portfolio ([S7]).
Growth Drivers and Headwinds: What Shapes Demand and Margins
The company’s growth prospects depend fundamentally on housing demand cycles that have structural constraints due to supply shortages nationally but remain vulnerable to interest rate fluctuations affecting affordability ([S1], [S2]). Expansion into new markets or introducing diversified product lines like attached homes or active adult communities offer incremental growth pathways though execution risk persists.
Cost inflation for lumber, steel, labor wages, and regulatory compliance pressures compress margins if not passed through fully via pricing increases. TMHC’s ability to sustain volume while controlling cancellations is crucial for margin stability. The Q1 earnings call indicated management vigilance around these dynamics—balancing cautious ordering against maintaining adequate inventory turnover rates is key ([N4]).
Risk Profile Focus: Cybersecurity and Economic Cyclicality
A standout aspect of TMHC’s risk governance is its structured cybersecurity program outlined extensively in the 10-K ([S1], [S23]). The IT security team is led by a CIO who brings over two decades’ experience at Taylor Morrison, supported by a Director of Information Security with expertise in threat modeling. Certifications held by security staff include CISSP, CEH, Security+, among others.
Quarterly cyber risk assessments feed into Board-level oversight ensuring ongoing mitigation budgets are authorized to address threat evolution proactively. Cybersecurity is critical not only due to potential data breaches but given the reliance on integrated IT systems underpinning project management and customer interface platforms.
Economic cyclicality remains prominent in risk factors; mustering liquidity—as evidenced in Q1—and controlling leverage provides resilience but does not insulate fully against sudden downturns that depress housing starts or trigger cancellations ([S15]).
Near-Term Catalysts: Milestones and Market Signals to Monitor
Going forward, observers should closely monitor changes in order backlog figures released quarterly as early demand indicators alongside cancellation rates reported in forward quarters ([S2]). Inventory turnover velocity signals adjustments in build strategy responsiveness.
Updates on credit utilization under the revolving facility could reveal capital spending plans or shifts in liquidity usage reflecting market sentiment ([S25]). Margin trends reported over subsequent quarters will directly illustrate whether cost pressures persist or abate.
Macroeconomic variables such as mortgage rate movements remain uncontrollable external drivers but their interaction with TMHC's operational execution will dictate near-term performance trajectories.
Financial Overview: Liquidity, Profitability, and Capital Structure
Historical performance (annual)
| FY | Net ($mm) | CFO ($mm) | Capex ($mm) | Net YoY |
|---|---|---|---|---|
| 2025 | 783 | 817 | 40 | -11.4% |
| 2024 | 883 | 210 | 36 | +14.9% |
| 2023 | 769 | 806 | 33 | -27.0% |
| 2022 | 1053 | 1108 | 31 |
Source: SEC companyfacts cache [F1].
Capital returns and efficiency (annual)
| FY | Buybacks ($mm) | FCF ($mm) | ROE% |
|---|---|---|---|
| 2025 | 381 | 777 | 12.4 |
| 2024 | 348 | 174 | 15.1 |
| 2023 | 128 | 773 | 14.5 |
| 2022 | 376 | 1077 | 22.7 |
Source: SEC companyfacts cache [F1].
Annually [F1] shows revenues relatively flat around $1.46 billion since FY2019 with FY2025 net income at $782.5 million marking an -11.4% decline from FY2024 possibly reflecting margin compression despite top-line stability. Operating cash flow surged unusually by nearly threefold (+289%) in FY2025 reaching over $817 million versus prior periods indicating improved cash conversion efficiency.
Capital expenditures have remained moderate (~$40 million annually), supporting asset base renewal without dilutive expansion burdens.
Equity levels expanded steadily from $4.63 billion at FY2022 to about $6.29 billion at FY2025 demonstrating retained earnings accumulation notwithstanding share repurchases which totaled just over $381 million in FY2025.
TMHC maintains investment grade financing terms evidenced by the structure of its credit agreements offering unsecured lending capacity without amortization requirements but including covenants designed for conservative leverage control ([S4], [S6]) . Interest expense outlook benefits from relatively low margin placements depending on credit ratings achieved which TMHC sustains currently.
This analysis is based solely on publicly available information including SEC filings through April 22, 2026, news transcripts dated April 22, 2026, and company facts data current as of March 31, 2026.
Disclaimer: This is research-only, informational analysis and not investment advice. It may include AI-generated interpretation and general industry context. Always verify important details using primary sources.
Comments