
Tennant Company’s Earnings Tumble: Unpacking Operational Shifts and Capital Priorities
A sharp decline in Tennant's profitability contrasts with steady revenue gains alongside active shareholder returns.
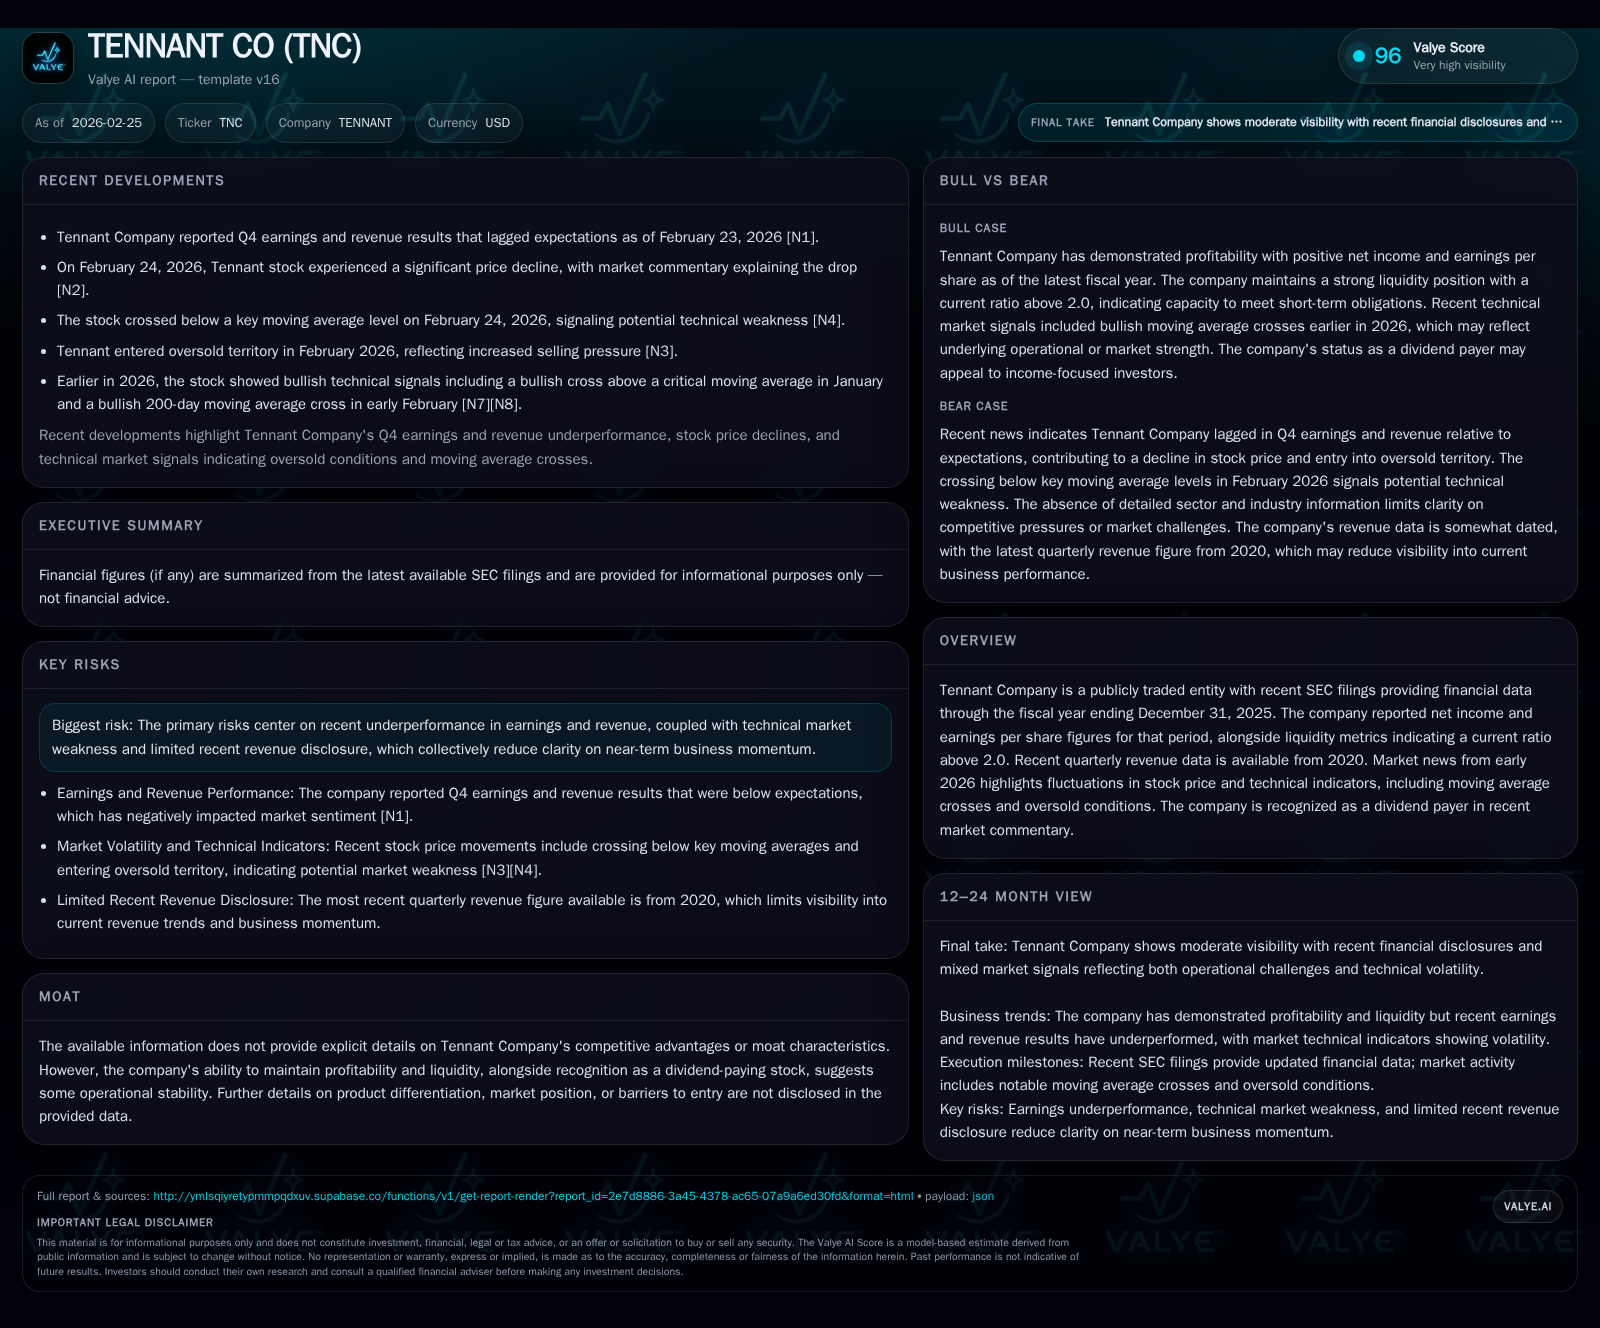
Tennant Company reported a 40% drop in operating income and nearly 48% net income decline in fiscal 2025 despite a modest 3.4% revenue growth year-over-year, signaling operational and margin pressures. The company maintained disciplined capital allocation through substantial dividends and an accelerated share buyback program, reflecting a prioritization of shareholder returns amid earnings challenges. Market reactions have been volatile, with technical signals indicating oversold status and bearish momentum, warranting close monitoring of upcoming financial disclosures and potential restructuring efforts.
Revenue Growth Momentum and Operating Income Volatility Since 2019
Tennant Company's fiscal performance through December 31, 2025, reveals a nuanced narrative of sustained revenue growth amid pronounced operating income volatility. Revenues increased from approximately $286 million in FY2018 to $295 million in FY2019, culminating in a steady trajectory that saw total revenue reach around $707 million by FY2024 before registering a modest yet positive 3.4% growth to about $731 million in FY2025 [F1]. This incremental revenue rise underscores steady demand or pricing power in the company's markets.
However, this top-line expansion belies a sharp contraction at the operating level: operating income plunged from $114.3 million in FY2024 down to approximately $68.3 million in FY2025—representing a severe decline of just over 40%. This divergence signals margin compression potentially fueled by cost pressures or operational inefficiencies [F1][S1]. Such swings suggest a challenging unit economics environment where topline stability is not translating into equivalent profit gains.
Historical performance (annual)
| FY | Net ($mm) | CFO ($mm) | OpInc ($mm) | Capex ($mm) | Net YoY |
|---|---|---|---|---|---|
| 2025 | 44 | 65 | 68 | 22 | -47.7% |
| 2024 | 84 | 90 | 114 | 21 | -23.6% |
| 2023 | 110 | 188 | 139 | 23 | +65.2% |
| 2022 | 66 | -25 | 87 | 25 |
Note: Omitted columns lack sufficient annual XBRL coverage in the provided tags (need ≥2 annual points): Rev. Source: SEC companyfacts cache [F1].
Capital returns and efficiency (annual)
| FY | Div ($mm) | Buybacks ($mm) | FCF ($mm) |
|---|---|---|---|
| 2025 | 22 | 89 | 43 |
| 2024 | 21 | 20 | 69 |
| 2023 | 20 | 22 | 166 |
| 2022 | 19 | 5 | -50 |
Source: SEC companyfacts cache [F1].
Note: Revenue data for some years matches latest XBRL filings; some YoYs omitted due to unavailable sequential data points.
Drivers Behind the Year-Over-Year Decline in Profitability for FY2025
The precipitous dip in both operating and net incomes during FY2025 seems rooted primarily in escalating operational costs coupled with product mix or pricing challenges [N1][S1][S2]. The fourth quarter earnings announcement flagged missed estimates on both top-line and bottom-line fronts [N1], implying downward pressure not fully visible earlier in the fiscal year.
Potential cost headwinds may encompass increased raw material inputs or labor expenses that Tennant was unable to offset through price increases or productivity improvements, leading to margin erosion—a phenomenon consistent with "margin compression" common in manufacturing sectors when external inflationary pressures collide with competitive pricing dynamics [S1][N1].
Moreover, partial disclosure regarding segment-level dynamics curtails deeper understanding of whether particular business units faced outsized hurdles or if global supply chain disruptions played contributory roles [S1][S2]. This opacity amplifies uncertainty around near-term profitability trajectories.
Managing Cash Flows: From Operating Activities to Capital Expenditures
Despite declining earnings, Tennant demonstrated resilience in cash flow management albeit with notable weakening trends: operating cash flow fell by roughly 27.5% year-over-year to an estimated $65 million for FY2025 [F1][S11]. This reduction reflects softness likely stemming from lower net income but may also indicate less favorable working capital cycles during the period.
Capital expenditures remained relatively steady near $21-22 million annually over recent years—consistent with maintenance capex levels rather than aggressive growth investments [F1][S11]. Such disciplined spending suggests management's focus on preserving financial flexibility while navigating profit headwinds.
A simplified free cash flow calculation (operating cash flow minus capex) yields approximately $43 million for FY2025, confirming positive but tempered cash conversion efficacy amid challenging earnings conditions [F1].
Capital Allocation Strategy: Dividends, Stock Repurchases, and Equity Implications
Contrasting the earnings challenges, Tennant has maintained a strong commitment to rewarding shareholders through dividends and significant acceleration of share repurchase activity [F1][S21][S22]. Dividend payments rose modestly from about $21.4 million in FY2024 to $21.9 million in FY2025—a sign of consistent income distribution despite profit declines.
More strikingly, share repurchases escalated drastically from roughly $19.6 million to $88.5 million within the same period, illustrating an assertive approach toward returning capital and bolstering per-share metrics amidst headwinds [F1][S23]. This buyback surge could reflect management's confidence in intrinsic value or a strategic effort to support stock price and offset dilution.
Equity levels stood at approximately $601.6 million at year-end FY2025, yielding an implied return on equity near 7.3% (net income/equity)—a contraction from prior periods but still reflecting ongoing profitability relative to invested capital [F1]. This metric flags efficiency strain but also significant asset backing that could underwrite eventual recovery if operating leverage improves.
Near-Term Outlook and Market Signals Informing Investor Sentiment
Market reception following the February 2026 quarterly report was notably negative, triggering sharp stock price declines accompanied by technical breakdowns below key moving average thresholds such as the widely watched two hundred-day moving average [N4][N6]. These events are commonly interpreted as bearish signals by institutional investors, often catalyzing further selling activity.
Simultaneously, indicators flagged the stock as oversold—a condition that can precede either stabilization via bargain hunting or continued volatility depending on fundamental developments [N5]. Previous bullish crossovers highlighted earlier optimism but recent reversals underscore waning momentum [N7].
Given limited visibility into growth initiatives or restructuring plans disclosed thus far, these mixed technical cues intensify uncertainty about short-term share price directionality and investor sentiment.
Risk Landscape: Earnings Pressure, Market Volatility, and Disclosure Gaps
Formal risk disclosures emphasize several relevant elements impacting Tennant’s outlook including pronounced earnings underperformance relative to guidance expectations [S4][N1], ongoing market volatility reflected through price actions discussed above, and limited granular information on geographic or product segment concentration effects constraining full assessment of revenue resilience [S6].
The absence of explicit moat characteristics within public disclosures heightens perceived risk premiums for investors seeking durable competitive advantages or sustainable pricing power [F1]. Given these factors alongside a compressing operating margin profile, stakeholders must weigh balancing optimistic cash flows against structural profitability pressures.
What to Watch: Key Milestones and Financial Metrics Moving Forward
Absent detailed forward guidance in recent filings, monitoring upcoming quarterly disclosures will be paramount for gauging recovery trajectories—especially Q1 FY2026 results expected later this year [N3]. Investors should prioritize signs of stabilization or improvement in operating margins, incremental revenue drivers by business line if revealed, and any announced efficiency programs aiming to contain costs.
Continued scrutiny of capital allocation patterns remains critical; sustained aggressive buybacks paired with dividend maintenance will reveal management's conviction regarding valuation versus reinvestment opportunities [S23]. Additionally, any updates related to strategic board appointments or corporate governance shifts following recent cooperation agreements may offer insight into broader shareholder engagement influencing future direction [S22].
In sum, clear communication regarding growth catalysts and margin management will be essential for resolving current ambiguity shaping investor perspectives.
This analysis relies solely on publicly available SEC filings and credible market news sources as of February 25, 2026 ([F1], [S#], [N#]). It does not constitute investment advice or recommendations.
Disclaimer: This is research-only, informational analysis and not investment advice. It may include AI-generated interpretation and general industry context. Always verify important details using primary sources.

Comments