
TotalEnergies SE's Strategic Shift: Balancing Upstream Gains and Renewable Ventures in 2026
TotalEnergies’ 2025 financial results reveal a complex interplay of upstream production growth, LNG portfolio expansion, and calibrated renewable investments underpinned by capital discipline.
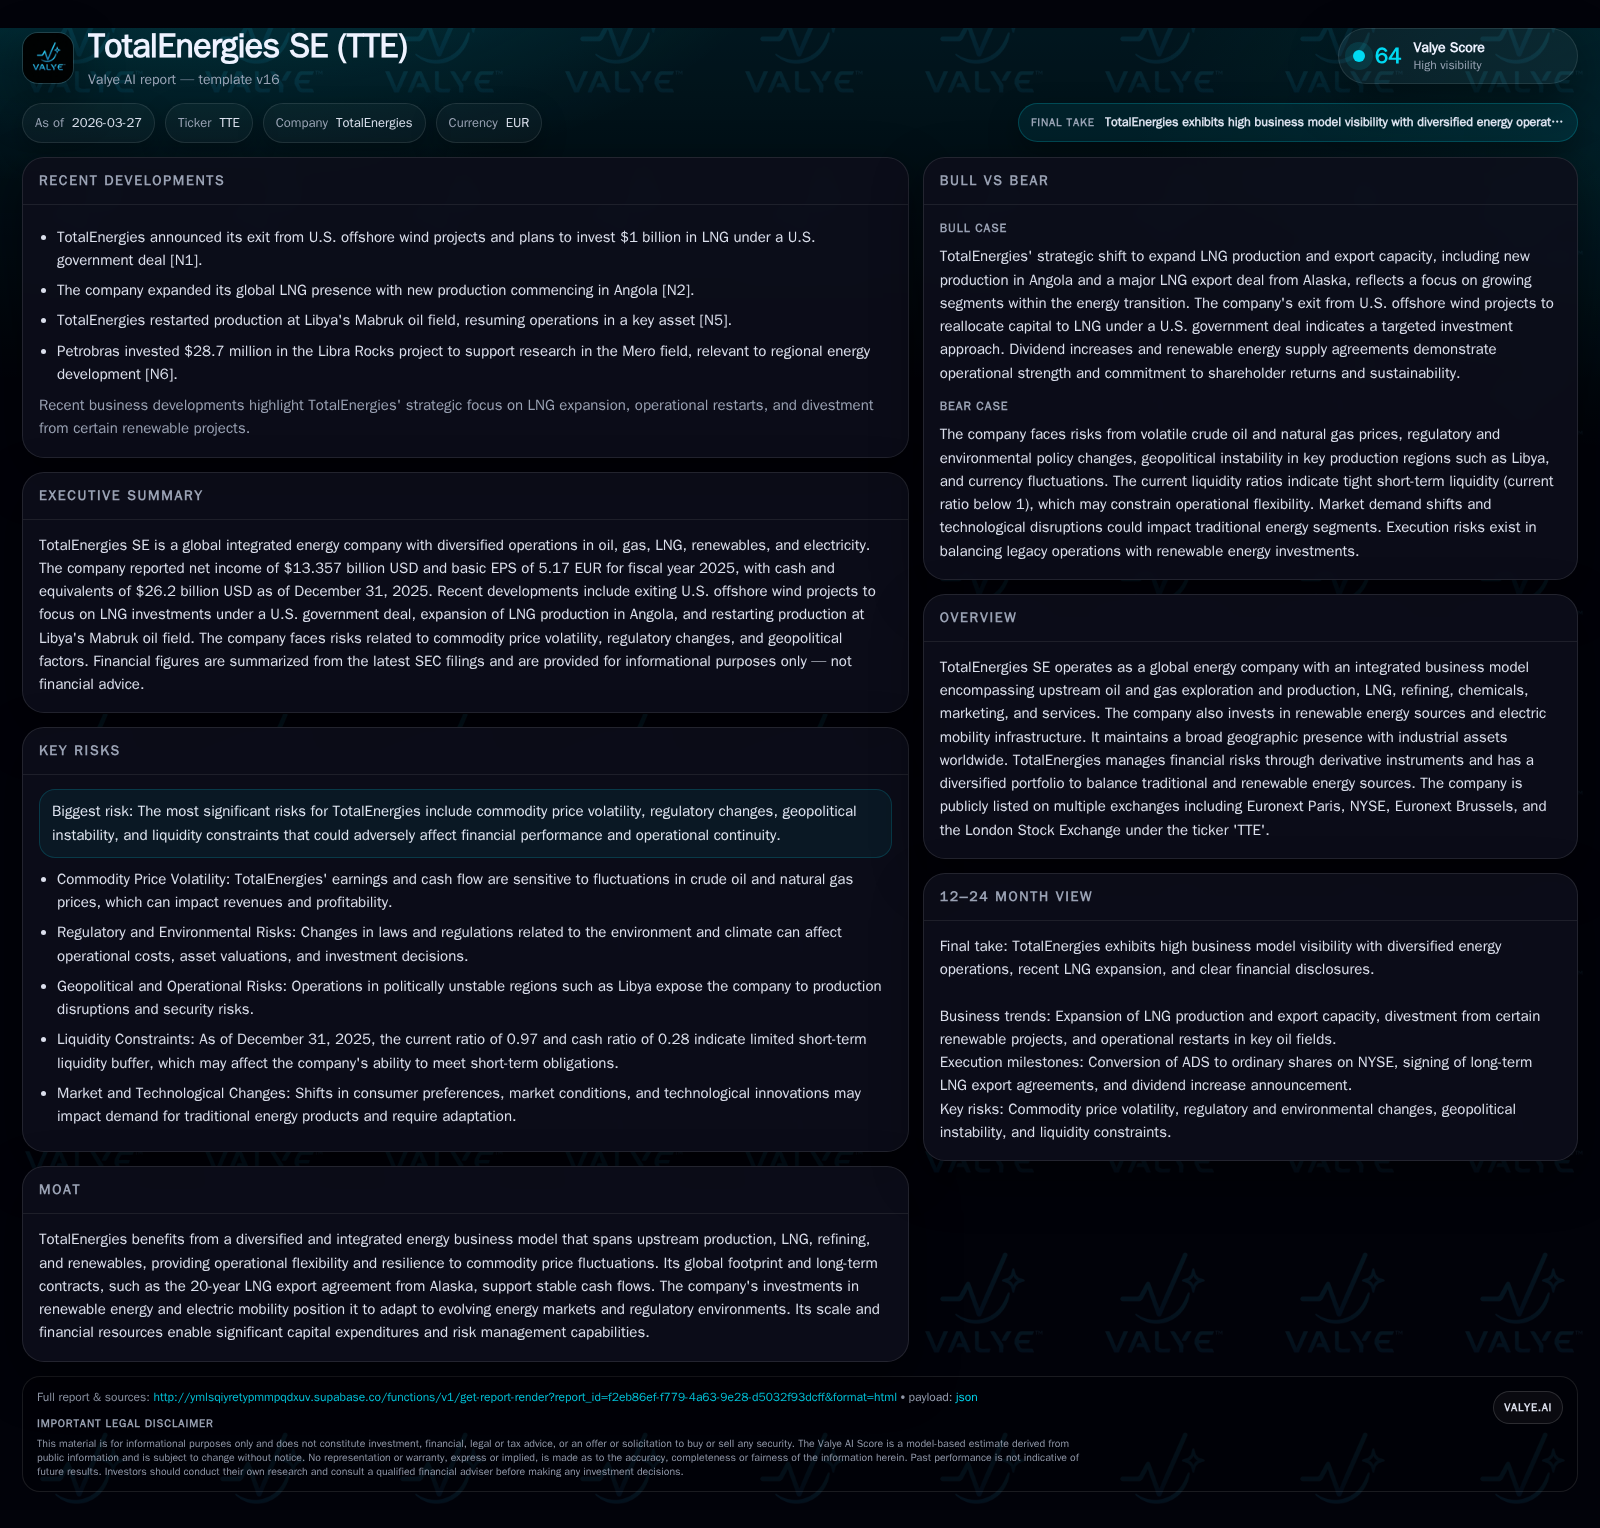
In 2025, TotalEnergies demonstrated revenue resilience driven by increased upstream output and LNG project progress, even as net income declined by 16.7% year-over-year due to margin pressures and market volatility. Strategically, the company is retreating from U.S. offshore wind projects to reallocate $1 billion toward LNG infrastructure partnering with the U.S. government, reflecting a measured portfolio optimization. Capital allocation remains balanced with dividend growth and share buybacks supported by strong cash flow generation. Going forward, milestones in renewables integration and traditional energy expansion will be critical to watch amid persistent commodity and regulatory risks.
Historical Performance and Earnings Drivers Through 2025
TotalEnergies closed fiscal year 2025 with robust top-line stability but notable pressure on profitability. Total revenues remained near prior levels, reflecting approximately $149 billion as per the latest SEC XBRL data [F1], supported primarily by increased upstream oil and gas production volumes. However, net income contracted by nearly 16.7% year-over-year to about $13.36 billion [F1], signaling margin compression likely attributable to fluctuating commodity prices amid geopolitically sensitive markets.
This divergence between revenue growth drivers and earnings decline highlights operational challenges faced despite higher output from areas such as Angola and Libya, where production ramp-up efforts intensified during the period [N4][N6][N9]. The company’s integrated model spanning upstream exploration through downstream refining helped sustain revenues amid pricing volatility but could not fully offset cost pressures.
Historical performance (annual)
| FY | Net ($bn) | Net YoY |
|---|---|---|
| 2025 | 13.4 | -16.7% |
| 2024 | 16.0 | -25.5% |
| 2023 | 21.5 | +2.2% |
| 2022 | 21.0 |
Source: SEC companyfacts cache [F1].
Capital returns and efficiency (annual)
| FY | Div ($bn) | ROE% |
|---|---|---|
| 2025 | 8.5 | 11.4 |
| 2024 | 8.2 | 13.3 |
| 2023 | 7.9 | 18.0 |
| 2022 | 10.5 | 18.4 |
Source: SEC companyfacts cache [F1].
Note: Revenue YoY % not explicitly available; dividend payment increase based on values (FY24-FY25) [F1].
Operational Highlights: Upstream Production and LNG Portfolio Growth
Strategic production ramp-ups served as a cornerstone of TotalEnergies’ operational advances in 2025. The restart of Libya’s Mabruk oil field signaled recovery in a geopolitically complex zone that historically challenges consistency, contributing materially to total output [N9]. Concurrently, newly commenced production in Angola expanded upstream volumes further amid Africa’s established oil basins [N6]. These efforts reflect deliberate geographic diversification aimed at smoothing regional risk exposure.
On the LNG front, TotalEnergies solidified long-term off-take agreements exemplified by a landmark 20-year contract to export two million tons per annum from Alaska’s LNG project—an agreement that combines infrastructure investment with contractual stability under U.S government collaboration frameworks [N12][N5]. This aligns with sector-specific trends emphasizing contractual tenure in LNG transactions as pivotal to secure cash flow predictability.
These operational pillars illustrate the company's approach to balancing scale growth in traditional hydrocarbon assets while leveraging its LNG portfolio for steadier medium-term earnings streams amidst volatile global market conditions [S2].
Strategic Retreat from Offshore Wind: Redirecting Investments
March 2026 marked TotalEnergies’ strategic disengagement from the U.S. offshore wind sector—characterized by prolonged development cycles and evolving regulatory environments—to reallocate capital towards more mature LNG infrastructure projects valued at approximately $1 billion under a U.S government partnership [N5].
This move exemplifies an asset portfolio optimization strategy prioritizing high-return investments with clearer contractual underpinnings over nascent renewables ventures facing uncertain gestation periods.
By consciously scaling back offshore wind exposure, TotalEnergies underscores its commitment to capital discipline amidst energy transition imperatives—pivoting selectively rather than across-the-board—to reinforce its gas value chain integral to bridging fossil fuels and low-carbon pathways.
Capital Allocation Dynamics: Dividends, Buybacks, and Cash Flow Priorities
Capital returns remain central within TotalEnergies' shareholder value proposition framework for FY25 alongside maintaining liquidity buffers suitable for cyclical sector risks. The company proposed a €3.40 per share dividend representing a substantive increase of approximately 5.6%, reflecting consistent cash flow generation sufficient to sustain payout growth [F1][S5][S6][S15].
Share repurchase programs continue alongside dividends indicating balanced deployment of excess operating cash flow—helped by upstream volume enhancements—even as leverage considerations temper aggressive capital returns.
With equity capital standing around $117.5 billion at December 31, 2025, an approximate return on equity of 11.4% reflects moderate efficiency gains consistent with industry peers contending with market headwinds [F1].
Liquidity analysis reveals current assets tallying about $89.47 billion against current liabilities near $92.56 billion yielding a ratio close to 0.97—a position underscored by prudent management of working capital cycles given the exposures inherent in multinational energy operations [F1][S4]. The company employs derivative instruments such as interest rate swaps and currency hedges extensively to mitigate financial risks related to fluctuations in rates and exchange rates—a best practice within large integrated oil firms managing global currency flows [S4][S9][S10].
Future Outlook: Milestones in Renewable and Traditional Energy Integration
Looking ahead into 2026, TotalEnergies projects a dual-track approach combining continued fossil fuel base business strength with cautious but targeted renewable expansions that avoid overextension into premature technologies or geographies.
Concrete examples include signing renewable electricity supply contracts powering major industrial users such as Airbus in Germany and the UK plus delivering solar capacity totaling one gigawatt intended for Google's Texas data centers over a contractual horizon extending fifteen years—reflecting scaled commercial progress in low-carbon segments with stable counterparties [S2][N2][N3][S1].
However, regulatory uncertainty around carbon pricing mechanisms and variable commodity pricing dynamics remain critical risks potentially capping upside earnings potential despite these initiatives [S11].
Financial Health Snapshot: Liquidity, Debt Profile, and Risk Considerations
TotalEnergies maintains an active stance on liquidity management supported by cash & equivalents over $26 billion at year-end FY25—a strategic buffer fostering operational continuity amid commodity price cycles [F1]. Funding strategies include recent bond issuance totalling around $3.5 billion across maturities in early 2030s supported by legal opinions validating bilaterally enforceable guarantees underpinning credit ratings [S22].
Risk management integrates derivative hedging structures addressing FX exposures between USD/EUR alongside interest rate swaps mitigating benchmark rate fluctuation impacts on cost of debt servicing—consistent with sophisticated treasury practices prevalent among supermajors [S4][S10].
Yet geopolitical tensions especially impacting Middle East North Africa regions where significant assets reside plus evolving environmental regulations impose substantial operational risk layers requiring vigilant scenario planning embedded within enterprise risk frameworks documented in regulatory filings [S11].
What Investors Should Monitor Next
Key performance indicators for monitoring through H1/FY26 encompass quarterly upstream production volumes versus guidance particularly relating to ramp-ups from key African licenses; milestone progress delivering full capacity from Alaska LNG linked contracts; adjustments in revenue mix signaling shifts toward low-carbon offerings; alongside forthcoming regulatory updates especially those influencing European carbon pricing regimes affecting refining margins.
Watchlists should also flag reported quarterly cash flow margins illustrating capital discipline efficacy supporting dividends/share repurchases amid volatile price environments evidenced by recent earnings misses below analyst consensus post Q4 ’25 announcement reinforcing need for improved transparency on margin recovery tactics [N4][N7][N8][N11].
Concurrently assessing government partnership evolutions augmenting LNG market positioning could reveal incremental upside or exposure requiring strategic recalibration.
This report synthesizes publicly available information without projecting future company valuations or recommending investment actions. Readers are encouraged to consult official filings directly for detailed disclosures referenced herein.
Disclaimer: This is research-only, informational analysis and not investment advice. It may include AI-generated interpretation and general industry context. Always verify important details using primary sources.
Comments