
Union Pacific's Q1 2026 Performance and Strategic Growth Posture
Union Pacific's latest quarterly results highlight operational resilience and strategic focus on safety, service, and volume growth amid industry challenges.
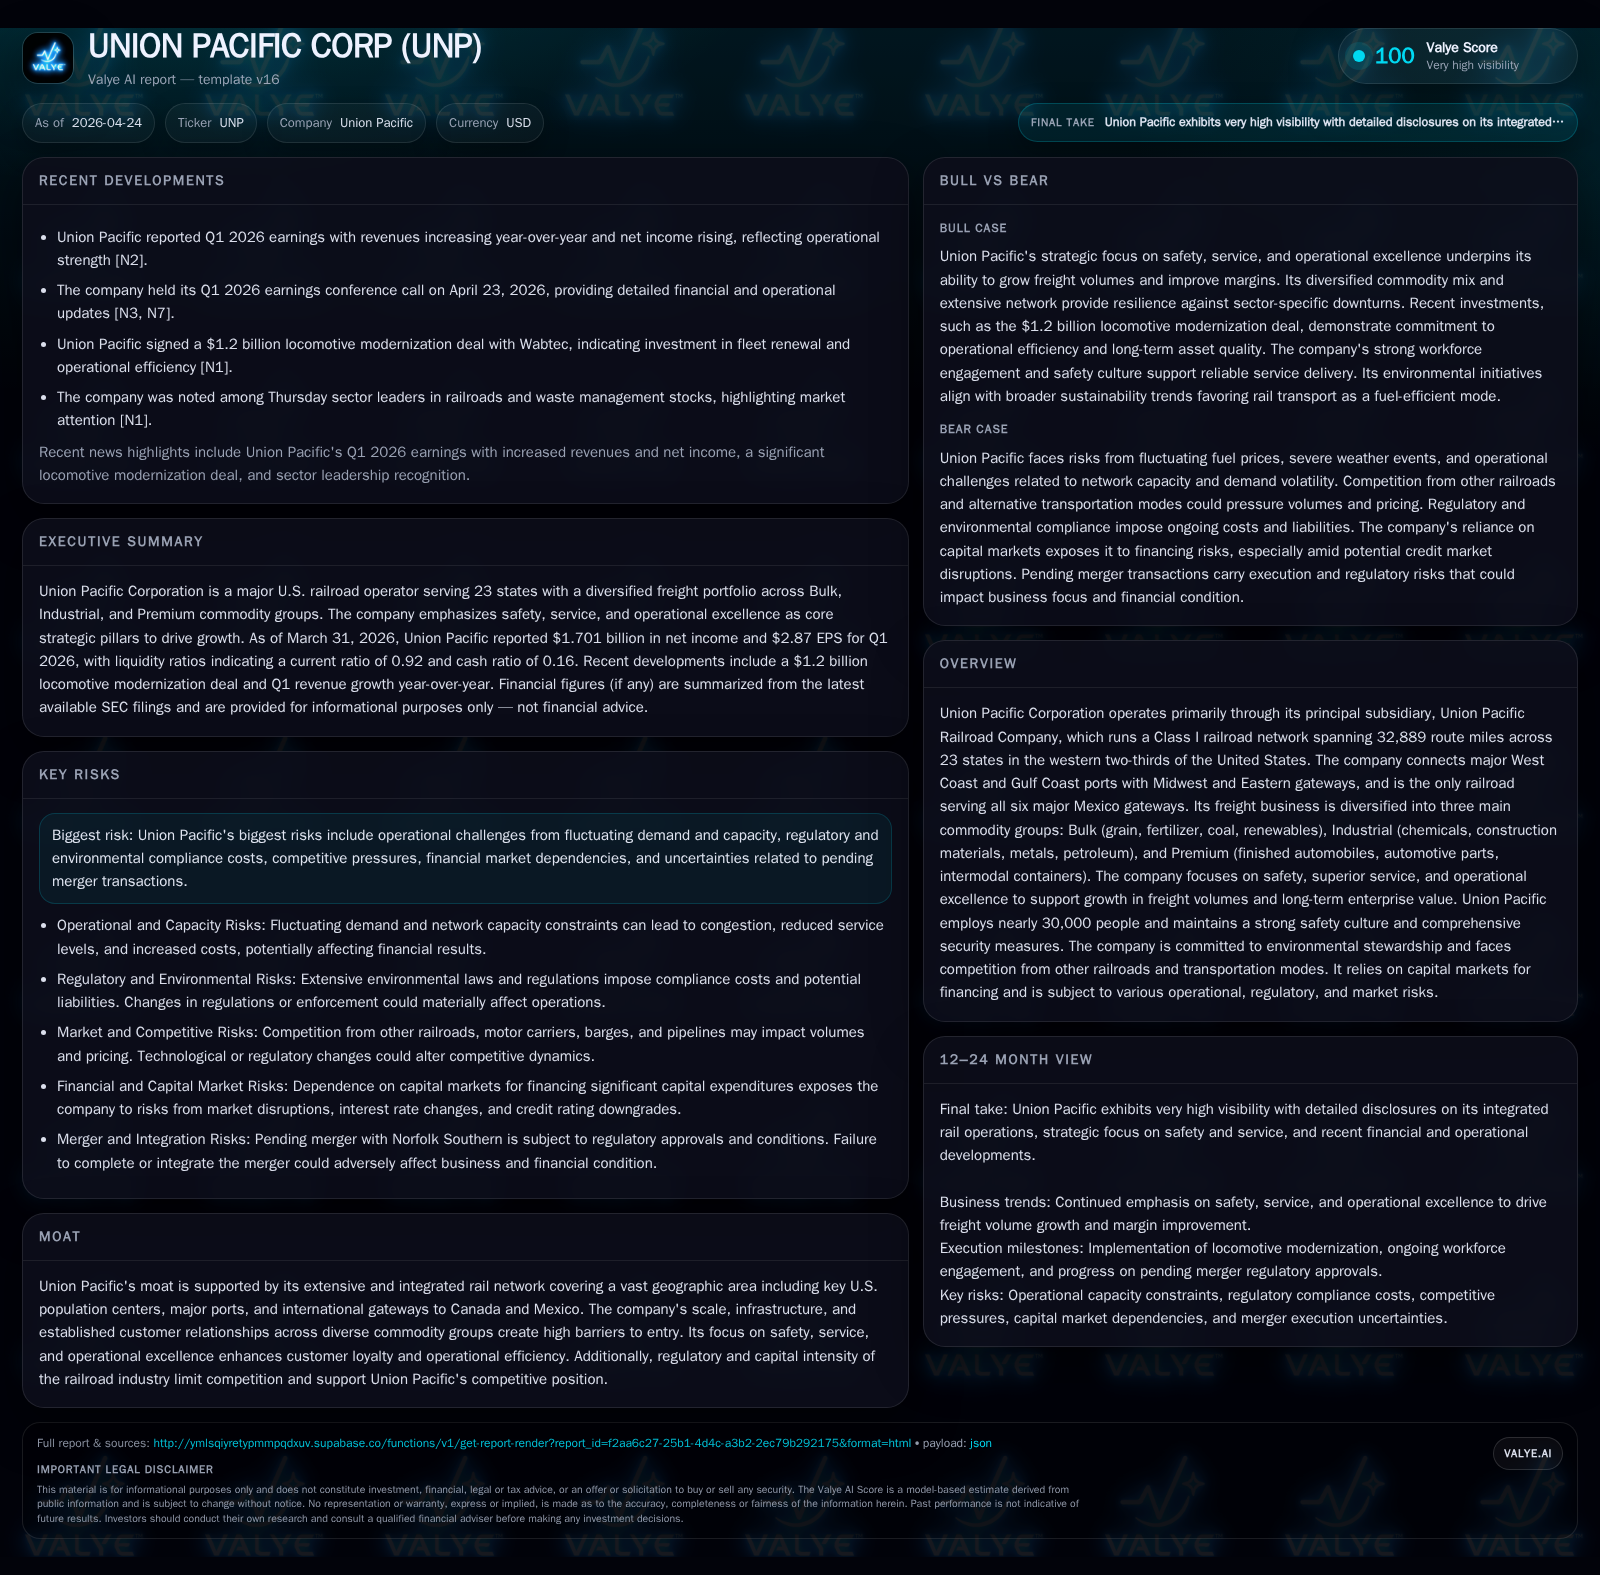
In Q1 2026, Union Pacific posted year-over-year revenue gains and operational improvements underscoring the company’s commitment to safety and customer service. Its freight model leverages a vast rail network spanning western U.S. states and key international gateways, differentiated by diversified commodity groups and exclusive Mexico access. While demand volatility and capacity constraints persist as growth headwinds, management emphasizes operational excellence to drive margin expansion and volume gains. The company maintains a robust financial profile with disciplined capital allocation supporting its long-term strategic initiatives.
First Quarter 2026 Results: Revenue, Volumes, and Operational Highlights
Union Pacific Corporation’s Q1 2026 SEC filings ([S2],[S3]) reveal a revenue increase compared to prior year periods that signals firm near-term business momentum in freight volumes despite broader macroeconomic uncertainties. Union Pacific highlighted operational resilience featuring improved safety outcomes—personal injury rates declined by more than 20% year-over-year—and sustained commitments to service excellence that underpin customer trust on its expansive rail network. Management commentary emphasized the success of targeted strategies driving volume expansion across its diversified commodity portfolio while acknowledging ongoing capacity pressures. Revenue gains were driven across Bulk (grain, coal), Industrial (chemicals, construction materials), and Premium segments (automotive shipments and intermodal containers). Operationally, UP continues to focus on maintaining fluidity by leveraging buffer resources to absorb fluctuations caused by seasonal factors or weather events affecting velocity of shipments. This approach is essential given the company’s exposure to peak shipping seasons with cyclical commodity volumes particularly noted in agriculture and intermodal traffic ([S1],[N2]). ## Union Pacific’s Freight Business Model: Diversified Commodities and Customer Value The backbone of Union Pacific’s revenue stream lies in its classification as a Class I railroad operating over roughly 32,889 route miles across 23 western U.S. states ([S1],[S6],[S7]). The company operates an integrated freight system linking major West Coast and Gulf Coast ports with Midwestern and Eastern markets while uniquely serving all six significant Mexico gateways—an exclusive feature enhancing cross-border trade facilitation. Its freight business is strategically divided into three broad commodity groups:
- Bulk (~33% of freight revenues in 2025): Includes grain products critical for export terminals primarily in the Pacific Northwest and Gulf Coast; fertilizer; coal shipments mainly from Powder River Basin; renewables; these commodities display marked seasonality tied to harvest cycles ([S7],[S26]).
- Industrial (~37% of freight revenues): Covers chemicals (with roots in Midwest industrial complexes), construction materials like steel and cement fueled by infrastructure investments, petroleum/LPG influenced by refinery utilization rates, metal ores, forest products vital for housing markets ([S7],[S13]).
- Premium (~30%): Encompasses finished automobiles produced at assembly plants accessible via UP's network west of the Mississippi; automotive parts expedited through dedicated boxcars; domestic & international intermodal containers routed through coastal ports—a high-margin segment reliant on reliable timing ([S7]). Union Pacific creates customer value not just through physical transport but via tailored service arrangements ensuring promised delivery levels aligned with customers’ competitive needs—especially crucial in automotive supply chains where just-in-time demands prevail. The geographic reach connecting key industrial hubs amplifies switching costs for customers given limited alternative regulatory-approved routes ([S1], analysis). ## Navigating Industry Structure: Competitive Moat, Regulation, and Network Scale UP possesses a formidable competitive advantage grounded in the scale of its rail infrastructure spanning Western U.S. population centers along with critical port access points for international trade (,[S1],[S9]). This brownfield network is capital intensive to build or replicate due to land use rights and regulatory constraints that effectively limit new entrants. Regulatory oversight by bodies such as the Surface Transportation Board also constrains pricing freedom but underpins a stable competitive environment. Industry concentration—with UP among the seven Class I railroads—results in oligopolistic dynamics where barriers such as high fixed costs combined with required compliance adherence curtail rivalry but maintain customer option sets limited. However, motor carriers continue imposing service timeliness competition especially in shorter haul routes while barges challenge particularly bulk grains near waterways ([S28],). Ongoing capital investment is necessary not only for maintenance but capacity expansions given surging demand volatility documented in recent quarters. Environmental regulations pose growing compliance costs; hazardous materials transport mandates operational rigor given risk exposure ([S9],[S19],[S20]). Railroads also face reputational risks linked to accidents involving toxic inhalation hazards or crude oil shipments which can have costly litigation or remediation implications. ## Growth Drivers: Volume Expansion, Safety Focus, and Service Excellence Management articulates strategy pivots around achieving industry-leading safety records as foundational to securing sustainable growth. Safety culture improvements yield fewer operational disruptions reducing variability in throughput velocity—directly benefiting service assurance metrics crucial for sectors like automotive manufacturing ([S1],[S27]). Service excellence is pursued via detailed customer engagement ensuring UP delivers precisely agreed freight specifications enhancing win-win market positions. Operational excellence implies efficient resource deployment including buffer assets allowing responsiveness during demand surges tied to seasonal peaks or macroeconomic shifts ([S22],[S2]). Innovation investments targeting improved yard operations or technology-enabled logistics oversight are implicitly driving margin improvements. Growth prospects stem from:
- Enhancing operating ratios through productivity gains.
- Leveraging exclusive Mexico gateway presence amid growing cross-border trade flows catalyzed by USMCA dynamics.
- Expanding premium intermodal volumes aligned with consumer goods demand cycles. These drivers align well with industry trends favoring modal shift from trucks due to fuel efficiency advantages of rail despite longer transit times (, analysis). ## Operational Constraints: Capacity Fluctuations, Demand Volatility, and Environmental Risks Despite favorable fundamentals, Union Pacific faces structural constraints inherent in balancing designed network capacities against fluctuating demand patterns ([S15],[S4]). Sharp downturns in commodity shipments necessitate costly asset idling or workforce adjustments inflating unit costs negatively impacting margins. Conversely demand surges beyond track or terminal handling thresholds induce congestion lowering train velocity thus compromising promised service levels potentially harming customer relationships ([S15]). Weather events ranging from floods to wildfires exacerbate these interruptions unpredictably requiring contingencies increasing cost bases. Transporting hazardous materials also introduces heightened liability risks from incidents potentially exceeding insurance coverage limits thereby threatening financial performance alongside reputational damage ([S9],[S19],[S20]). Environmental remediation obligations represent contingent expenses influenced by evolving legal interpretations potentially materializing unforeseen liabilities. Ongoing regulatory scrutiny around fuel surcharges amid antitrust litigations remains a latent uncertainty though management currently views pending litigation as unlikely materially adverse ([S9],[S10],[S11], analysis). ## Strategic Priorities and What Investors Should Monitor Next Forward-looking indicators outlined during the Q1 MD&A discussion emphasize sustained volume growth across core segments accompanied by disciplined capacity expansions including yard enhancements or track upgrades aimed at relieving bottlenecks ([S2],[N2]). Monitoring trends in bulk agricultural shipments post-harvest cycles will provide early signs of demand stability or softness. Safety KPIs such as personal injury rate reductions or derailment incident declines remain leading service quality proxies critical for unlocking margin upside ([S2],[S27]). Regulatory developments impacting the pending merger agreement with Norfolk Southern will be material execution milestones potentially reshaping competitive dynamics though completion timing remains uncertain ([S24]). Capital expenditure pacing consistent with prudent leverage targets while funding growth projects will be an important barometer alongside quarterly updates on operating ratio trajectories signaling if operational excellence initiatives are translating into returns. ## Latest Financial Position: Liquidity, Leverage, and Cash Flow Analysis From a financial perspective backed by [F1] metrics consolidated as of quarter-end March 31, 2026: Union Pacific holds approximately $735 million in cash & equivalents. Historically UP delivered robust operating income near $9.85 billion in FY 2025 reflecting incremental YoY improvement (+1.4%) alongside net income growth (+5.8%), indicative of margin enhancement efforts bearing fruit after absorbing fluctuating commodity cycles over previous years ([F1]). Operating cash flow generation remained strong at around $9.29 billion supporting dividend payments (~$3.24 billion) while enabling continued share repurchases amounting close to $2.68 billion demonstrating balanced capital returns policy consistent with investment-grade credit profiles. Capital expenditures rose nearly 10% YoY reaching over $3.79 billion reflecting reinvestment priorities targeting network upgrades to support reliability and capacity expansions needed for anticipated volume growth ([F1]). These financial trends reinforce Union Pacific’s ability to fund strategic initiatives without compromising liquidity even as it navigates regulatory complexities linked to pending mergers or environmental obligations. ### Historical performance (annual) | FY | Net ($bn) | CFO ($bn) | OpInc ($bn) | Capex ($bn) | Net YoY | | --- | :---: | :---: | :---: | :---: | :---: | | 2025 | 7.1 | 9.3 | 9.8 | 3.8 | +5.8% | | 2024 | 6.7 | 9.3 | 9.7 | 3.5 | +5.8% | | 2023 | 6.4 | 8.4 | 9.1 | 3.6 | -8.8% | | 2022 | 7.0 | 9.4 | 9.9 | 3.6 | | Source: SEC companyfacts cache [F1]. ### Capital returns and efficiency (annual) | FY | Div ($bn) | Buybacks ($bn) | FCF ($bn) | | --- | :---: | :---: | :---: | | 2025 | 3.2 | 2.7 | 5.5 | | 2024 | 3.2 | 1.5 | 5.9 | | 2023 | 3.2 | 0.7 | 4.8 | | 2022 | 3.2 | 6.3 | 5.7 | Source: SEC companyfacts cache [F1]. | Balance Sheet Item | Mar-31-2026 (USD) | Dec-31-2025 (USD) | |-------------------------|---------------------|---------------------| | Cash & Equivalents | $735 million | N/A | | Total Debt | N/A | $33.49 billion | | Current Assets | $4.22 billion | N/A | | Current Liabilities | $4.60 billion | N/A | | Current Ratio | ~0.92 | N/A | Union Pacific maintains a strong financial foundation enabling continuation of its strategic growth agenda backed by disciplined cost management amidst volatile market conditions. --- This analysis is based exclusively on information sourced from publicly filed SEC documents as of April 23–24, 2026 ([S1]-[S29], [F1]) supplemented by cited market news sources without any extrapolation beyond disclosed data points or speculative forecasts.
Disclaimer: This is research-only, informational analysis and not investment advice. It may include AI-generated interpretation and general industry context. Always verify important details using primary sources.

Comments