
Univest Financial’s Q2 2026 Trajectory Reveals Pressure Points on Margin and Growth
Q2 2026 results highlight emerging challenges in revenue growth and margin stability amid evolving credit conditions for Univest Financial.
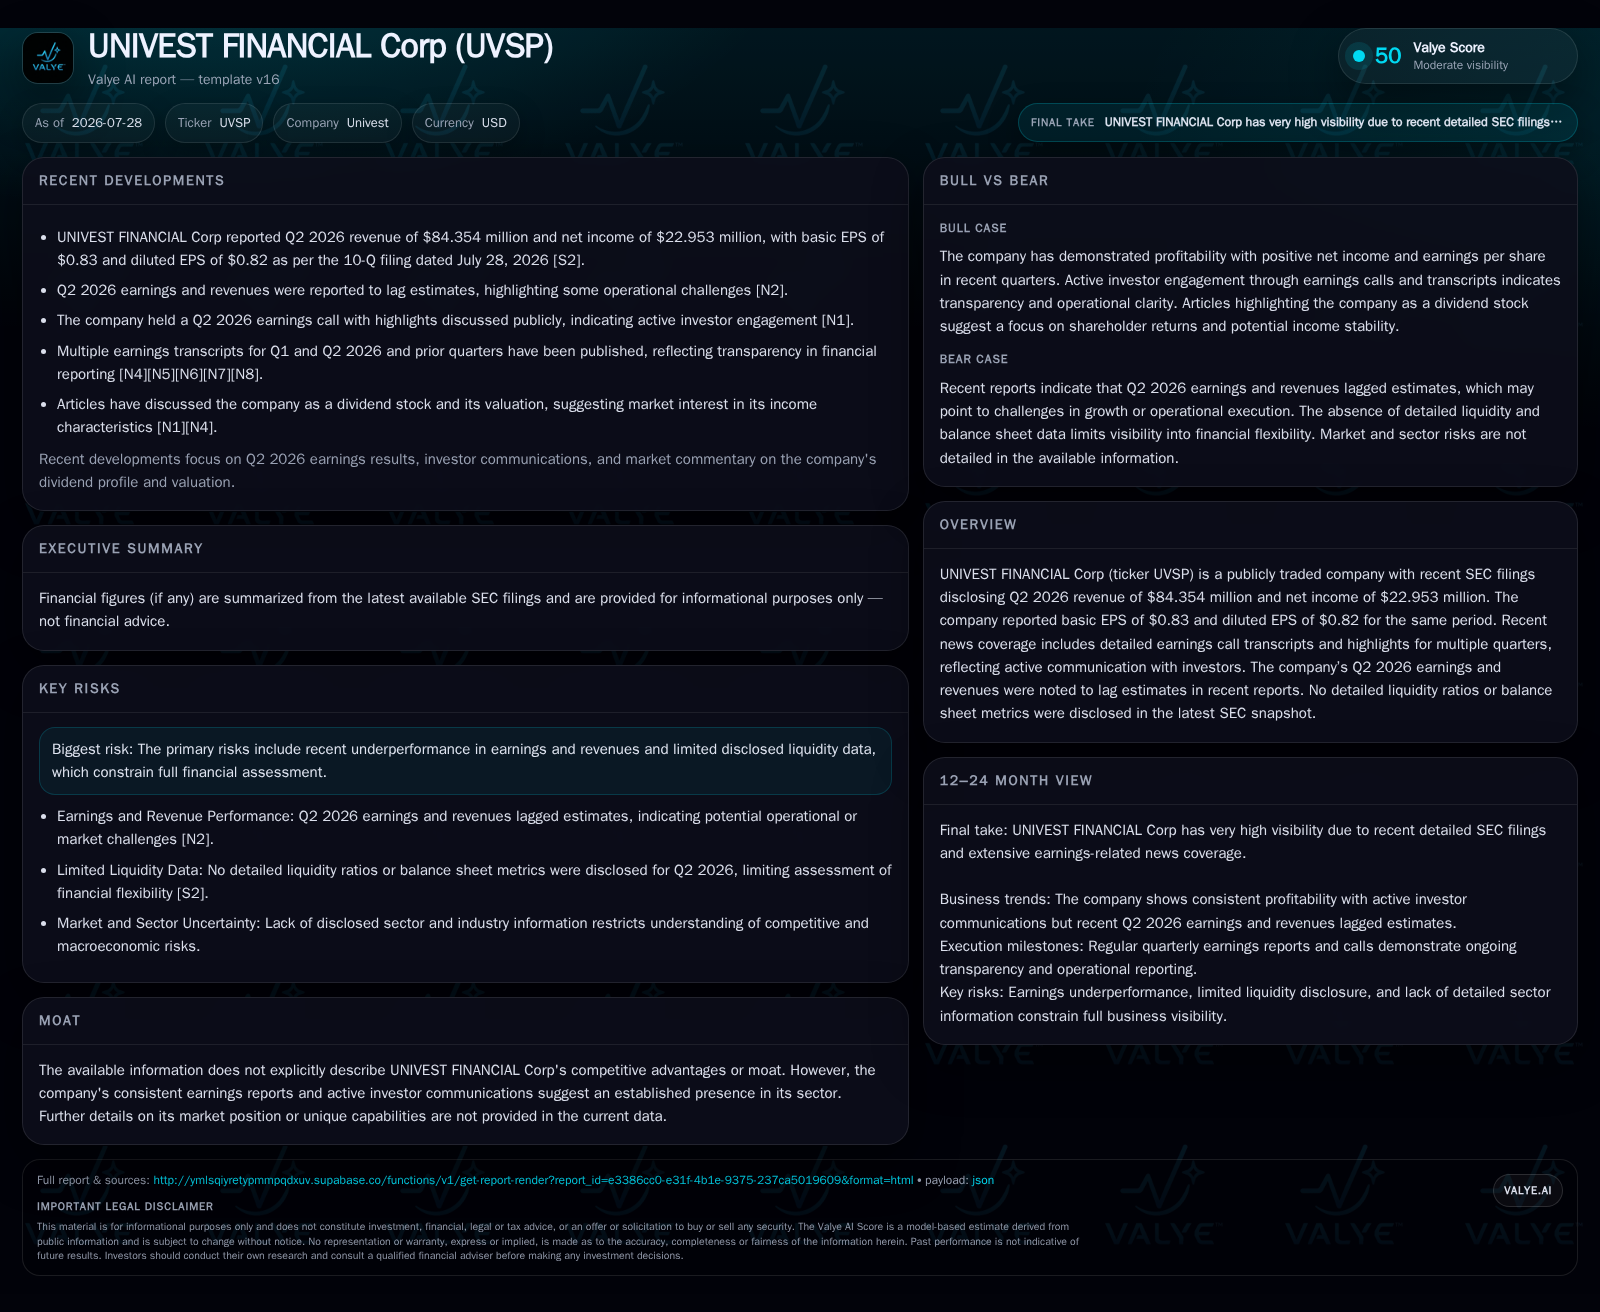
Univest Financial reported Q2 2026 revenue of $84.4 million with net income of $23 million, undershooting analyst estimates in both categories. The core banking operations, driven by loans and deposit balances, face margin compression linked to interest rate dynamics and competitive deposit pricing. Non-interest income from wealth management and insurance contributes steadily but has yet to offset tightening net interest margins. Operating efficiency and credit provision trends suggest near-term constraints despite stable asset quality. Growth potential remains tied to regional economic strength and expansion of fee-based services.
Quarterly Update Exposes Margin Contraction Amid Flat Revenue Growth
Interest income on loans and leases stood at $102.183 million over the first six months—a slight increase from the prior year—indicating steady loan portfolio growth or repricing [S2]. However, this was partially offset by compression in the net interest margin (NIM), a critical banking KPI reflecting the difference between interest earned from lending activities versus the cost of funding through deposits or borrowings. The margin squeeze suggests competitive deposit pricing or shifts in asset/liability mix diminishing spread economics.
Revenue Mix Analysis: Core Loans Versus Fee Income Dynamics
Univest’s business model is centered on traditional regional banking archetypes: generating most revenues through net interest income derived from an actively managed loan portfolio funded largely by retail and commercial deposits [S1]. In addition to interest earnings from loan products—which include commercial loans, residential mortgages, and consumer lending—the bank supplements revenues via non-interest streams such as wealth management advisory fees and insurance commissions.
The contribution of these fee-based activities has grown incrementally but still represents a smaller portion relative to core lending activities. This diversification moderates reliance on net interest margins but currently lacks sufficient scale or growth velocity to fully counterbalance pressure on lending spreads. Tracking non-interest income as a percentage of total revenue will be key to assessing future resilience.
Operational Leverage Across Branch Network and Digital Channels Insights
Maintaining an extensive branch network comprising roughly 52 properties across Pennsylvania, Maryland, New Jersey, and neighboring regions anchors Univest’s community banking relationships [S1]. These physical assets support deposit gathering and loan originations but inherently carry fixed costs including real estate maintenance and staffing.
The company continues investing in digital banking capabilities offering online and mobile services nationwide via its website platform—a critical counterbalance to traditional branch overheads [S1]. Balancing operational expenses against revenue growth defines the efficiency ratio—operating expenses divided by total revenue—a vital productivity metric revealing cost control effectiveness.
Given the evidence, Univest confronts moderate cost pressures typical for regional banks balancing legacy branch infrastructure with necessary technology investments. Enhancing scalability through digital adoption remains an ongoing execution priority.
Competitor Benchmarking Illuminates Efficiency Opportunities and Constraints
Univest’s efficiency ratio likely reflects these sector-wide tradeoffs: costs are structurally influenced by branch footprint scale while revenue trajectory depends on local economic dynamics. Improving operational leverage through targeted expense reduction or deeper fee-income penetration could enhance profitability relative to peers.
Growth Prospects Linked to Regional Economic Trends and Product Diversification
Growth drivers for Univest hinge primarily on favorable economic conditions within its served markets that stimulate both loan demand—commercial expansions, residential mortgages—and deposit accumulation through community ties sustained by branches plus increasing digital accessibility [N1][S1].
Cross-selling wealth management solutions and insurance services provides additional avenues to boost non-interest income while deepening customer stickiness.
Risk Landscape: Credit Quality Focus and Regulatory Compliance Challenges
Recent filings reveal a slight reversal from prior years’ provision write-backs into a small positive provision for credit losses during Q2 ($23 thousand before tax) indicating increased caution around borrower risk profiles amid uncertain economic environments [S2]. This elevates vigilance over asset quality metrics such as non-performing loans ratio or allowance for loan losses coverage.
Additional sector-wide risks impacting Univest stem from fluctuating interest rates that influence NIM stability; regulatory compliance demands that amplify operational costs; competitive threats from larger national banks offering scale advantages; fintech entrants creating alternative payment or lending channels; liquidity risk balancing deposit outflows; market risk exposure within held-to-maturity investment securities; cybersecurity challenges threatening operational integrity; plus reputational risks attached to client experience or compliance lapses [S1]
What Investors Should Track: Upcoming Milestones and Market Signals
Investors should focus on metrics delivered in upcoming quarterly releases such as trajectory in loan origination volumes including credit quality tiers; changes in deposit balances reflecting competitive standing; shifts in non-interest income via wealth management/insurance sales effectiveness; movements in efficiency ratio indicating operating discipline; coupled with any management commentary clarifying strategic priorities following recent earnings call disclosures [N1][S3]
Macro-level indicators like regional employment gains or real estate market conditions remain relevant demand signals for core banking activities.
Financial Profile Discussion: Capital Adequacy and Liquidity Underpinning Stability
From a balance sheet standpoint at June 30, 2026, Univest held $79.490 million in cash and due from banks plus $115.835 million in interest-earning deposits with other banks—a notable decline versus end-2025 levels suggesting repositioning of liquid assets possibly into loans or securities yielding higher returns [S2]
While detailed tier 1 capital ratios or regulatory capital adequacy metrics were not explicitly disclosed in this quarter's filing excerpt, the company's disclosure consistency over time implies maintenance above regulatory minimums essential for operational continuity [S2].
Total liabilities and debt issuance details were not specifically updated in the latest quarter filing; prior annual data indicated debt levels around $210 million, but current figures are not confirmed and should be interpreted cautiously [F1]
Liquidity management appears balanced with adequate cash reserves targeting depositor withdrawal demands while pursuing yield-enhancing asset deployment. Sustaining this equilibrium remains vital to mitigating funding cost escalation risks inherent in regional bank operations.
This analysis integrates timely operating results with contextual business model assessment informed by sector-specific KPIs common among regional banks. While Univest Financial shows resilience through diversified income streams and stable credit positioning, emerging pressures highlight ongoing challenges around margin preservation amid competitive funding markets and operational scaling. Detailed monitoring of quarterly financial indicators alongside strategic execution progress will inform further evaluation of the company’s adaptation capacity within its defined markets.
Disclaimer: This report is for informational purposes only and does not constitute investment advice or a research view regarding any security or company.
Disclaimer: This is research-only, informational analysis and not investment advice. It may include AI-generated interpretation and general industry context. Always verify important details using primary sources.

Comments