
Virginia National Bankshares Corp’s Local Bank Model Strengthens Amid Earnings Growth
Virginia National Bankshares leverages localized relationship banking to sustain steady profit growth and strong capital metrics.
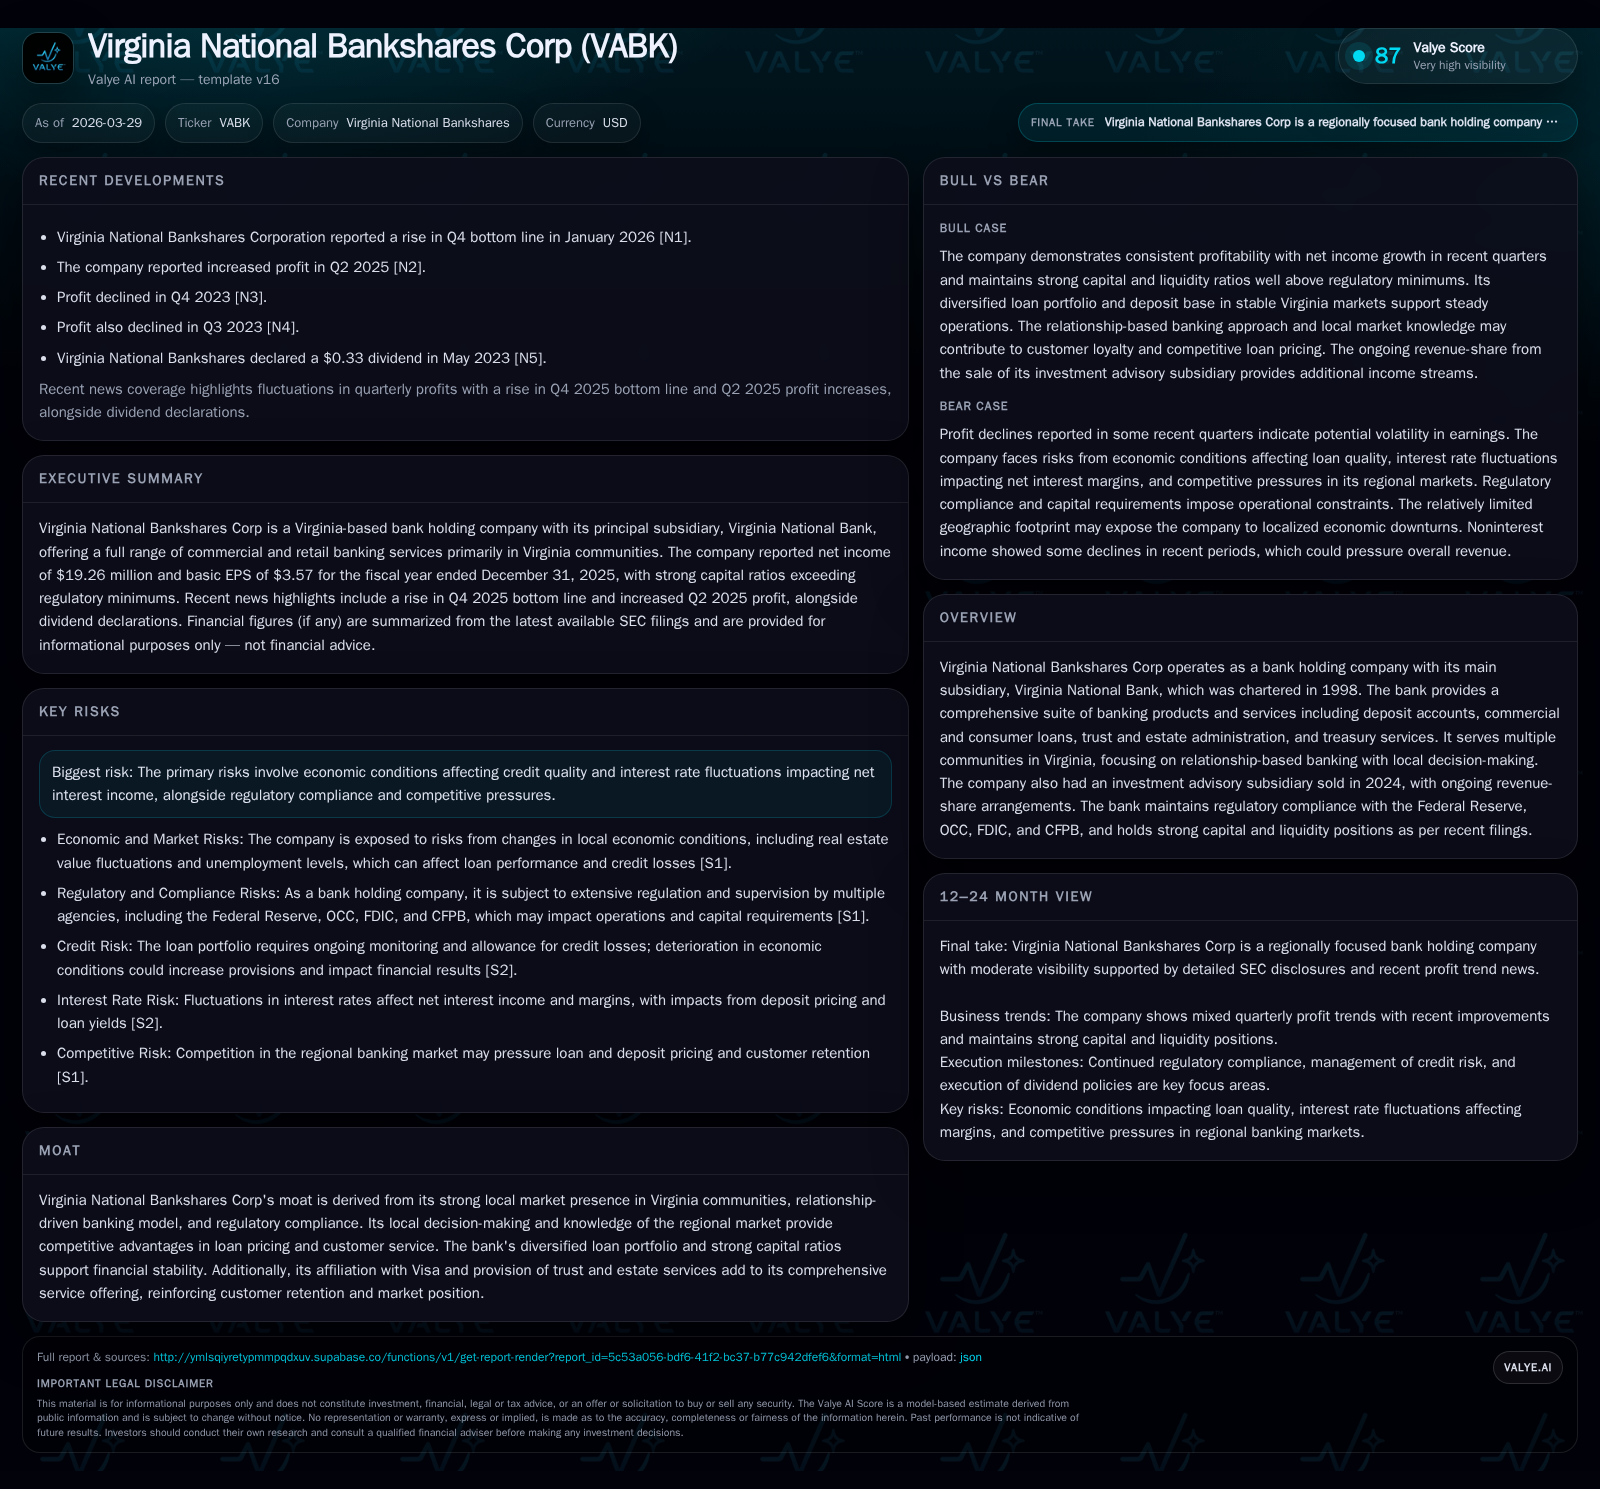
Virginia National Bankshares Corp, through its subsidiary Virginia National Bank, has grounded its competitive advantage in a relationship-driven, locally focused banking model serving multiple Virginia communities. The company's stable net income growth of 13.5% in 2025 alongside strong operating cash flow expansion demonstrates operational resilience. Maintaining robust capital adequacy and liquidity underpins the bank's capacity to navigate interest rate fluctuations and credit risks typical of regional banks. The 2024 divestiture of its investment advisory arm refocused the company on core banking services while preserving ancillary revenue streams via a multi-year revenue-sharing agreement.
Evolution of Virginia National Bankshares’ Growth Through Localized Strategy
Virginia National Bankshares Corp (VABK) operates primarily through its wholly owned Virginia National Bank subsidiary, chartered in 1998. Its enduring moat stems from penetrating Virginia’s communities such as Charlottesville, Richmond, Winchester, and Manassas with a business model rooted in relationship-based banking. This approach emphasizes local decision-making enabling swift responses tailored to client needs—a crucial differentiator against larger national institutions [S1][S6]. The bank’s diversified loan portfolio comprising commercial loans (21.1%), real estate mortgages including construction/land loans, and consumer segments further stabilizes earnings by spreading credit risk within familiar regional markets [S11]. Regulatory supervision by the OCC, Federal Reserve, FDIC, and CFPB ensures adherence to compliance standards that support institutional stability.
A strategic corporate reorganization was completed in 2013 transforming the bank into a bank holding company structure [S1]. Notably, in April 2024 the company divested Masonry Capital Management LLC, an investment advisory subsidiary formed in 2018. Though no longer consolidated within VABK’s operations post-sale, an annual revenue-share arrangement persists for six years under the terms of the divestiture agreement [S1]. This allowed VABK to sharpen focus on core banking while retaining ancillary financial benefits.
2025 Financial Results: Income and Cash Flow Trends Underlying Stability
Virginia National Bankshares demonstrated solid financial performance through FY2025 with net income reaching $19.26 million—a 13.5% increase year-over-year from $16.97 million in FY2024 [F1]. This uptick reflects steady net interest income growth driven by effective asset-liability management amidst a rising rate environment [S2][S6]. Operating cash flows expanded sharply by approximately 39.5% to $21.33 million from $15.29 million the previous year indicating greater operational efficiencies [F1]. Simultaneously, capital expenditures declined by about 20.6%, reflecting conservative investment in fixed assets following prior expansions [F1].
These metrics underscore sustainable profitability supported by low non-performing asset levels as detailed below along with controlled expense management [S17][S19]. The bank’s capability to generate free cash flow—operating cash flow minus capex—approximated $20.75 million for 2025 further fortifying financial flexibility.
Capital Structure and Liquidity: Strengths and Strategic Management
Shareholders' equity increased to approximately $184.16 million at year-end 2025 from $160.30 million in December 2024 representing a gain of more than 15% [F1][S4][S13]. Strong capital accumulation is reflected in robust Tier 1 capital ratios near double digits well exceeding Basel III minimums; for example common equity Tier 1 capital stood at approximately 18.65% as of mid-2025 [S14]. The leverage ratio surpassed the regulatory threshold comfortably at over 12% indicative of prudent balance sheet management.
Liquidity is maintained through an accessible credit position totaling $408 million negotiated under multiple facilities including collateral-dependent Federal Home Loan Bank (FHLB) advances which stood at $61 million as of mid-2025 [S4][S10]. Additional sources include federal funds lines with five correspondent banks ($119 million total) and a secured line through the Federal Reserve discount window ($3.2 million) providing contingency funding options [S4]. Such layered liquidity buffers underpin readiness to meet loan demand or unexpected deposit withdrawals while optimizing funding costs.
The bank also supports subordinated debt instruments via Fauquier Statutory Trust II which issued floating rate capital securities maturing in 2036; these obligations carry coupon resets referencing Term SOFR plus margin following LIBOR cessation with debt outstanding near $3.5 million mid-2025 [S4]. These instruments augment regulatory capital without senior claim priority.
Navigating Interest Rate Pressures and Credit Risks in Regional Markets
Interest rate volatility presents both opportunities and headwinds for VABK’s net interest margin (NIM). The bank reported fully taxable equivalent NIM around +3.34% mid-2025 compared to lower prior periods reflecting rising yields on assets relative to liabilities [S20][S24]. However, cost of funds also increased moderately requiring vigilant balance sheet positioning.
Credit risk remains tightly controlled via rigorous underwriting coupled with regular reviews assessing borrower creditworthiness within its geographic footprint consisting chiefly of Virginia counties plus proximate areas in Maryland and West Virginia within a roughly 100-mile radius from branch locations [S11][S12]. Non-performing assets remain low; nonaccrual loans totaled only $2.6 million mid-2025 representing less than 0.22% of total loans highlighting strong asset quality [S17][S19]. Allowance for credit losses remained steady at approximately $8.35 million or around two-thirds of one percent of total loans accommodating expected loss provisioning conservatively [S19].
Management acknowledges the need to monitor local economic factors such as unemployment levels, real estate valuations, and sectors sensitive to inflationary pressures as potential risk modifiers moving forward [S15]. Furthermore, systematic assessment of environmental variables influencing loan pools aids maintaining credit resilience.
The Impact of Divesting Investment Advisory and Its Revenue Implications
The sale of Masonry Capital Management LLC on April 1, 2024 marked a deliberate strategic pivot concentrating resources on core commercial and retail banking operations [S1]. While relinquishing direct operational control over advisory services reduced complexity and potential compliance burdens linked to asset management activities, it provided a clear revenue stream via a six-year revenue-share contract ensuring continuing income without associated expenses post-sale.
This transaction aligns with broader industry trends where community banks streamline business lines toward lending/deposit excellence rather than diversified financial services requiring different skill sets and regulatory frameworks. VABK thus benefits from enhanced focus on relationship banking strengths central to its market niche.
Investor Returns: ROE, Dividends, Repurchases, and Capital Deployment
Based on FY2025 figures showing net income of $19.26 million against shareholders’ equity near $184.16 million results in an approximate return on equity (ROE) of about 10.5%, indicating acceptable profitability for regional banking peers [F1]. This ROE level reflects consistent earnings generation supported by efficient capital utilization.
Dividends declared during mid-2025 stood at approximately $3.72 million over six months suggesting an ongoing commitment to shareholder distributions balanced against retained earnings for organic growth [S13]. Share repurchases have been modest but consistent: totaling approximately $559,000 aggregated over fiscal years ending December 31, 2024 reflected prudent deployment aimed at enhancing per share value while preserving capital for lending activities [F1].
Management's approach illustrates disciplined capital allocation combining capital returns with maintaining sound regulatory capital cushions necessary for safety and expansion capacity.
Future Outlook: Growth Catalysts and Regulatory Considerations to Watch
Looking forward, VABK faces evolving prospects shaped principally by local economic trends within Virginia regions served along with continuing Federal Reserve interest rate guidance impacting spreads earned on loans versus deposit costs [S2][S15]. Regulatory oversight remains rigorous but stable; ongoing compliance efforts are pivotal given jurisdictional checks from multiple agencies including Federal Reserve Board supervision as a bank holding company plus OCC chartering rules applicable to its principal national bank subsidiary.
Key milestones for investors monitoring future quarterly filings would include:
- Trends in net interest margin under varying Fed policy scenarios,
- Credit quality changes particularly nonaccruals or loan modifications,
- Deposit mix evolution especially uninsured deposit proportions impacting liquidity planning,
- Capital ratio maintenance aligned with Basel III/Prompt Corrective Action benchmarks,
- Impact realization from divestiture synergies beyond advisory unit exit,
- Any material changes in market competition affecting pricing power or customer retention abilities. These factors combined will clarify VABK’s ability to sustain its steady growth trajectory while balancing risk controls integral to community-focused banking operations.
Summary Table: Key Financial Metrics and Historical Performance
Historical performance (annual)
| FY | Net ($mm) | CFO ($mm) | Capex ($) | Net YoY |
|---|---|---|---|---|
| 2025 | 19 | 21 | 582000 | +13.5% |
| 2024 | 17 | 15 | 733000 | -11.9% |
| 2023 | 19 | 14 | 1171000 | -17.8% |
| 2022 | 23 | 23 | 546000 |
Source: SEC companyfacts cache [F1].
Capital returns and efficiency (annual)
| FY | Buybacks ($) | FCF ($mm) | ROE% |
|---|---|---|---|
| 2025 | 559000 | 21 | 10.5 |
| 2024 | 559000 | 15 | 10.6 |
| 2023 | 13 | 12.6 | |
| 2022 | 22 | 17.6 |
Source: SEC companyfacts cache [F1].
This table distills key financial performance indicators evidencing Virginia National Bankshares’ trajectory marked by rebounding profitability post-2023 contraction alongside expanding cash flows and strengthening equity base supporting future lending capacity [F1].
Disclaimer: This report is prepared solely for informational purposes reflecting data disclosed by Virginia National Bankshares Corp in public filings as of March 29, 2026 ([F1], various SEC filings). It does not constitute investment advice or recommendations relating to securities or other investments.
Disclaimer: This is research-only, informational analysis and not investment advice. It may include AI-generated interpretation and general industry context. Always verify important details using primary sources.
Comments