
Wendy's Co Battles Margin Pressures Amid Strategic Franchise Initiatives
Wendy's confronts commodity cost headwinds and earnings declines while leveraging franchise model refinements and supply chain collaboration to stabilize growth.
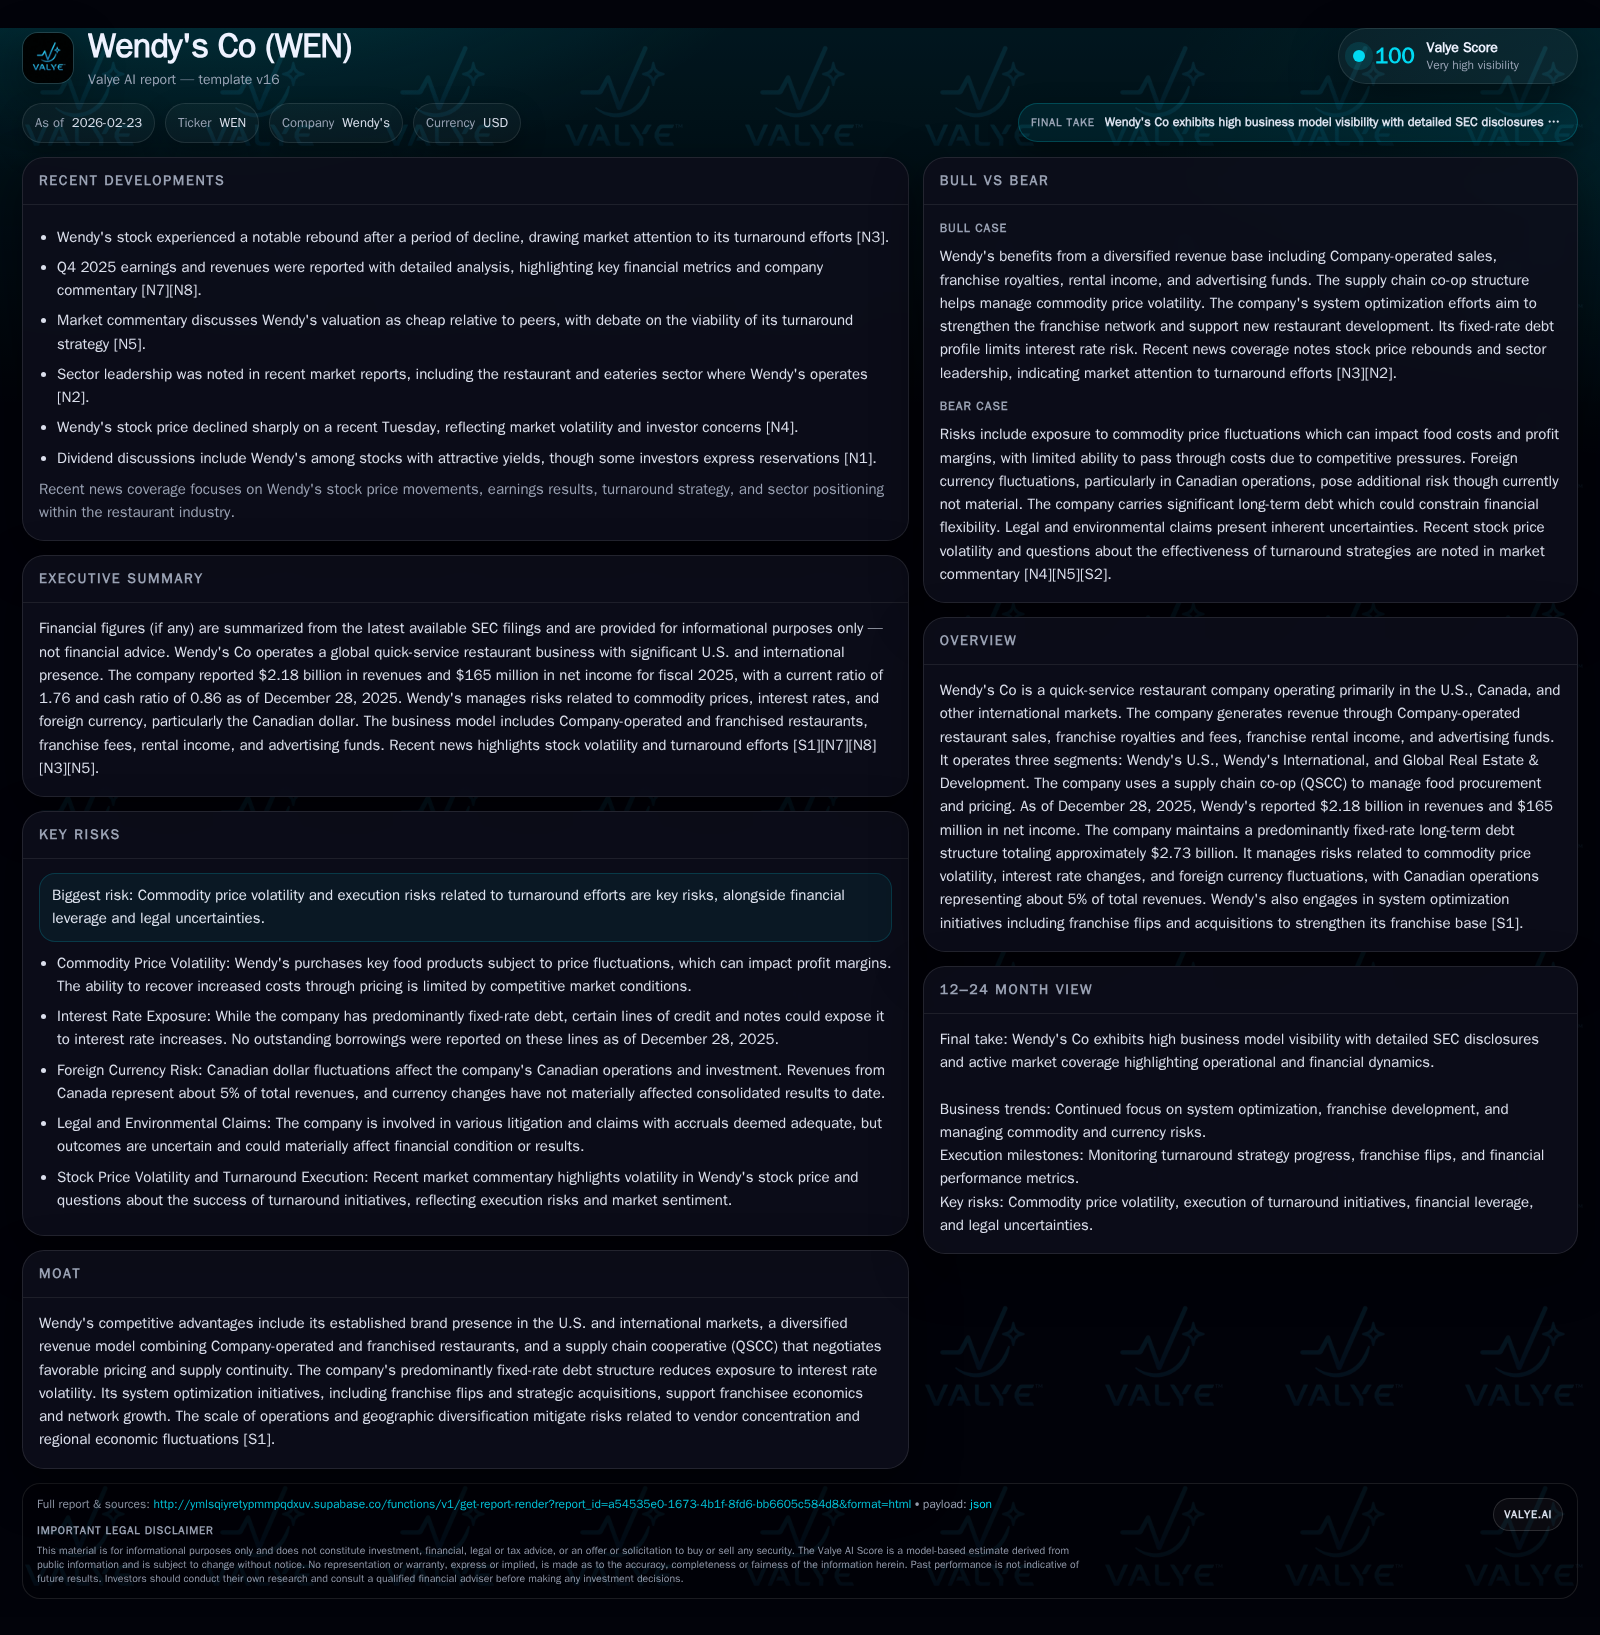
Wendy’s fiscal 2025 results reflect a revenue decline of 3.1% and a sharper net income drop of 15.1%, largely driven by margin pressures from volatile commodity prices amid a competitive QSR landscape. The company’s QSCC supply chain cooperative plays a central role in mitigating purchasing risks, while strategic franchise flips and acquisitions underpin system optimization efforts aimed at improving network economics. Despite operating income contraction, Wendy’s maintains robust free cash flow generation and pursues disciplined capital returns through dividends and aggressive share repurchases. Its fixed-rate long-term debt offers stability against interest rate fluctuations, though legal contingencies and execution risks remain as notable uncertainties. Forward-looking, the company targets turnaround momentum supported by supply chain efficiencies and enhanced franchise economics but must navigate ongoing cost inflation and competitive dynamics.
Recent Performance Trends and Revenue Drivers
Fiscal year 2025 saw Wendy’s posting revenues of approximately $2.18 billion, marking a 3.1% decrease compared to 2024's $2.25 billion [F1]. This reversal after modest prior growth stems from both company-operated restaurant sales softness and slight declines in franchise royalties and fees amidst challenging market conditions. Net income contracted more sharply by 15.1% to $165 million from $194 million the prior year [F1], indicating significant margin compression beyond mere top-line softness. Segmentally, the U.S. division dominates revenues (~91%), with Canadian and other international operations constituting roughly 9%, reflecting restrained exposure to geopolitical or currency risks but limited incremental growth from abroad [S4][S14]. Rising operational expenses, notably in food commodity costs, curbed profitability gains despite ongoing system development efforts.
Historical performance (annual)
| FY | Rev ($bn) | Net ($mm) | CFO ($mm) | OpInc ($mm) | Rev YoY | Net YoY |
|---|---|---|---|---|---|---|
| 2025 | 2.2 | 165 | 345 | 343 | -3.1% | -15.1% |
| 2024 | 2.2 | 194 | 355 | 371 | +3.0% | -4.9% |
| 2023 | 2.2 | 204 | 345 | 382 | +4.1% | +15.3% |
| 2022 | 2.1 | 177 | 260 | 353 |
Note: Omitted columns lack sufficient annual XBRL coverage in the provided tags (need ≥2 annual points): Capex. Source: SEC companyfacts cache [F1].
Capital returns and efficiency (annual)
| FY | Div ($mm) | Buybacks ($mm) | FCF ($mm) |
|---|---|---|---|
| 2025 | 130 | 201 | 243 |
| 2024 | 204 | 77 | 261 |
| 2023 | 209 | 190 | 260 |
| 2022 | 107 | 52 | 174 |
Source: SEC companyfacts cache [F1].
Note: Operating income declined by about 7.5% in FY2025; capital expenditures rose by approximately 8% YoY [F1].
Commodity Price Volatility and Supply Chain Mitigations via QSCC
Wendy's faces persistent volatility in prices for core food inputs such as beef, chicken, eggs, dairy, pork, and grains—commodities that have experienced uneven inflation due to agricultural supply chain disruptions [S14][N1]. To address this challenge, the company leverages its Quality Supply Chain Cooperative (QSCC), an independent procurement alliance negotiating contracts across the Wendy’s system primarily in the U.S. and Canada [S14]. QSCC balances securing favorable pricing with maintaining flexible contracts that avoid rigid purchase commitments—a sector-standard approach enabling agility amid fluctuating input costs.
While QSCC mitigates abrupt cost spikes by aggregating demand powerfully across franchisees and company stores alike, Wendy’s still experiences compressed profit margins when passing increased costs downstream is constrained by competitive pricing pressures in the QSR industry [N1]. Additionally, Wendy's predominantly fixed-rate long-term debt structure aids financial stability by insulating interest expenses from recent rate hikes [S14][S17]. This corporate finance prudence buffers some earnings volatility stemming from higher commodity-driven operational costs.
Franchise Model Evolution and Global Footprint Insights
Wendy’s operates through three key reporting segments: U.S., International, and Global Real Estate & Development [S4][S9]. Revenue arises from both direct company-operated outlets—primarily within the U.S.—and franchised restaurants globally that contribute royalties, fees, rental income, and advertising fund contributions.
Strategic initiatives include franchise flips whereby company-operated restaurants are sold or restructured back to franchisees to enhance capital efficiency while maintaining brand control [S9][N8]. These moves seek to optimize network returns by calibrating ownership models tailored to regional market dynamics and franchisee economics.
Further system optimization transpires through targeted acquisitions enhancing real estate holdings or capability expansions within the global footprint [S9]. Such maneuvers aim at strengthening localized presence outside core U.S markets (Canada accounting for ~5% of revenue), affording geographic diversification and scaling synergies across suppliers.
However, successful execution depends on sustaining franchisee support amid evolving business conditions—highlighted as a risk factor given execution complexity during ongoing turnaround efforts [N8]. Maintaining favorable franchise economics remains vital to fortify growth potential.
Interest Rate Management and Debt Structure Stability
As of fiscal year-end December 28, 2025, Wendy’s long-term debt stood at approximately $2.73 billion, primarily comprised of fixed-rate senior secured notes under structured securitized financing facilities with maturities staggered through the late-2030s [S5][S17]. This predominance of fixed-rate obligations shields Wendy’s from adverse impacts of rising benchmark rates that materially affected many peers during recent tightening cycles.
The company’s financing includes multiple series of Class A-2 notes with coupon rates mostly between about 2.37% and 5.42%, reflecting refinancing activities completed in late-2025 that extinguished higher-coupon legacy debentures maturing that year [S16][S24]. Revolving credit facilities—including a $15 million advertising fund line—remain largely untapped as of late-2025 supporting prudent liquidity management while covenant restrictions align with customary safeguards protecting noteholders’ interests [S7][S18].
Interest expenses remained steady around $110 million annually impacting net profitability but benefited marginally from refinancing efforts [S11]. The financing framework exemplifies robust fixed-cost debt management common among large QSR operators seeking stable capital structures amidst cyclical demand variations.
Profitability Challenges and Operating Income Decline Analysis
Operating income decreased by approximately 7.5% year-over-year to $343 million in FY2025 compared to $371 million the previous year—a reflection not just of top-line softness but increased operating cost burdens linked chiefly to food inflation pressures noted earlier [F1][N1]. Cost of goods sold escalated even as price increases at point-of-sale faced competitive resistance limiting pass-through ability.
Other expense components such as labor costs likely contributed alongside advertising fund expenditures consistent with ramped marketing investments aimed at sustaining consumer relevance amidst established competitors including McDonald’s or Burger King [N1]. Margin contraction was marked enough that net income fell disproportionately more than sales (-15%) underscoring execution risk inherent to turnaround phases where fixed overhead absorption is challenged.
These margin headwinds are typical in QSR segments balancing input inflation with menu price sensitivity amid shifting consumer preferences towards value propositions or alternative dining formats—factors warranting close monitoring going forward.
Capital Allocation: Dividends, Buybacks, and Free Cash Flow Generation
Despite profit declines, Wendy's demonstrated strong free cash flow vitality during fiscal year-end with operating cash flows near $345 million offsetting capital expenditures totaling approximately $102 million yielding free cash flow around $243 million (CFO minus capex) [F1]. This liquidity robustness supports the company's active capital return policies prioritizing dividends alongside opportunistic share repurchases.
Dividend payments contracted commensurately with earnings falling from about $204 million in payouts during FY24 to roughly $130 million in FY25 aligned with per-share dividend reductions reflecting earnings realities [S10][F1]. Concurrently, share repurchases were notably aggressive escalating more than twofold year-on-year from about $77 million in FY24 to approximately $201 million invested into stock buybacks during FY25 [F1][S13].
This dual approach illustrates balanced capital discipline designed both to maintain shareholder yield continuity while leveraging buybacks at perceived valuation strengths amid company turnaround narratives [N12]. The outstanding authorization remaining nearly $35 million affords flexibility for continuing repurchase programs conditional on market windows and regulatory permissibility.
Legal Environment and Contingent Risks Impacting Operations
Wendy’s faces ongoing litigation consistent with typical QSR operational footprints involving claims related to food safety, employment practices or intellectual property rights among others with numerous cases currently preliminary or evolving stages rendering loss quantification indeterminate [S6][S8][S27].
Management has accrued adequately for foreseeable liabilities where estimable yet cautions that aggregate financial impact remains uncertain given complex legal factors including motion outcomes or discovery developments potentially causing episodic earnings fluctuation if unfavorable resolutions materialize unexpectedly.
Transparency regarding these contingent exposures serves investor informational needs without undue sensationalism; nonetheless legal action remains a persistent risk vector requiring continuous oversight within corporate governance frameworks inclusive of comprehensive ERM programs encompassing emerging business risks including cybersecurity threats noted elsewhere [S1].
Forward-Looking Prospects: Turnaround Execution and Market Growth Catalysts
The company's outlook communicates cautious optimism around achieving stabilization then modest growth in fiscal year 2026 driven principally by sustained improvement initiatives spanning supply chain refinement through QSCC efficiencies coupled with enhanced franchise economics aligned through strategic portfolio adjustments via flips and acquisitions [N12][N14][S2].
Absent explicit third-party forecasts provided publicly, it remains imperative to monitor indicators such as same-store sales progression within franchised units alongside margin trend reversals supportive of breaking through recent profitability headwinds.
Further catalysts may emerge from expanded international penetration beyond core Canadian markets albeit currently modest contributor proportions advise measured expectations considering economic variability factors globally.
Capital structure integrity supporting low refinancing risk combined with free cash flow resilience underpin capacity for continued shareholder distributions fostering confidence even as business transformation trajectories advance incrementally but steadily toward recovery benchmarks articulated by management communications [N12].
This analysis is based on publicly available data as of February 23, 2026, including SEC filings ([F1], [S#]) and recent news transcripts ([N#]). It is intended solely for informational purposes without any implicit investment recommendations.
Disclaimer: This is research-only, informational analysis and not investment advice. It may include AI-generated interpretation and general industry context. Always verify important details using primary sources.
Comments