
Wyndham's 2025 Growth Moderates as Operating Income and Net Earnings Contract Amid Ongoing Capital Return
Wyndham Hotels & Resorts reports slight revenue increase in 2025 while experiencing declines in operating income and net income, supported by sustained share repurchases and dividends.
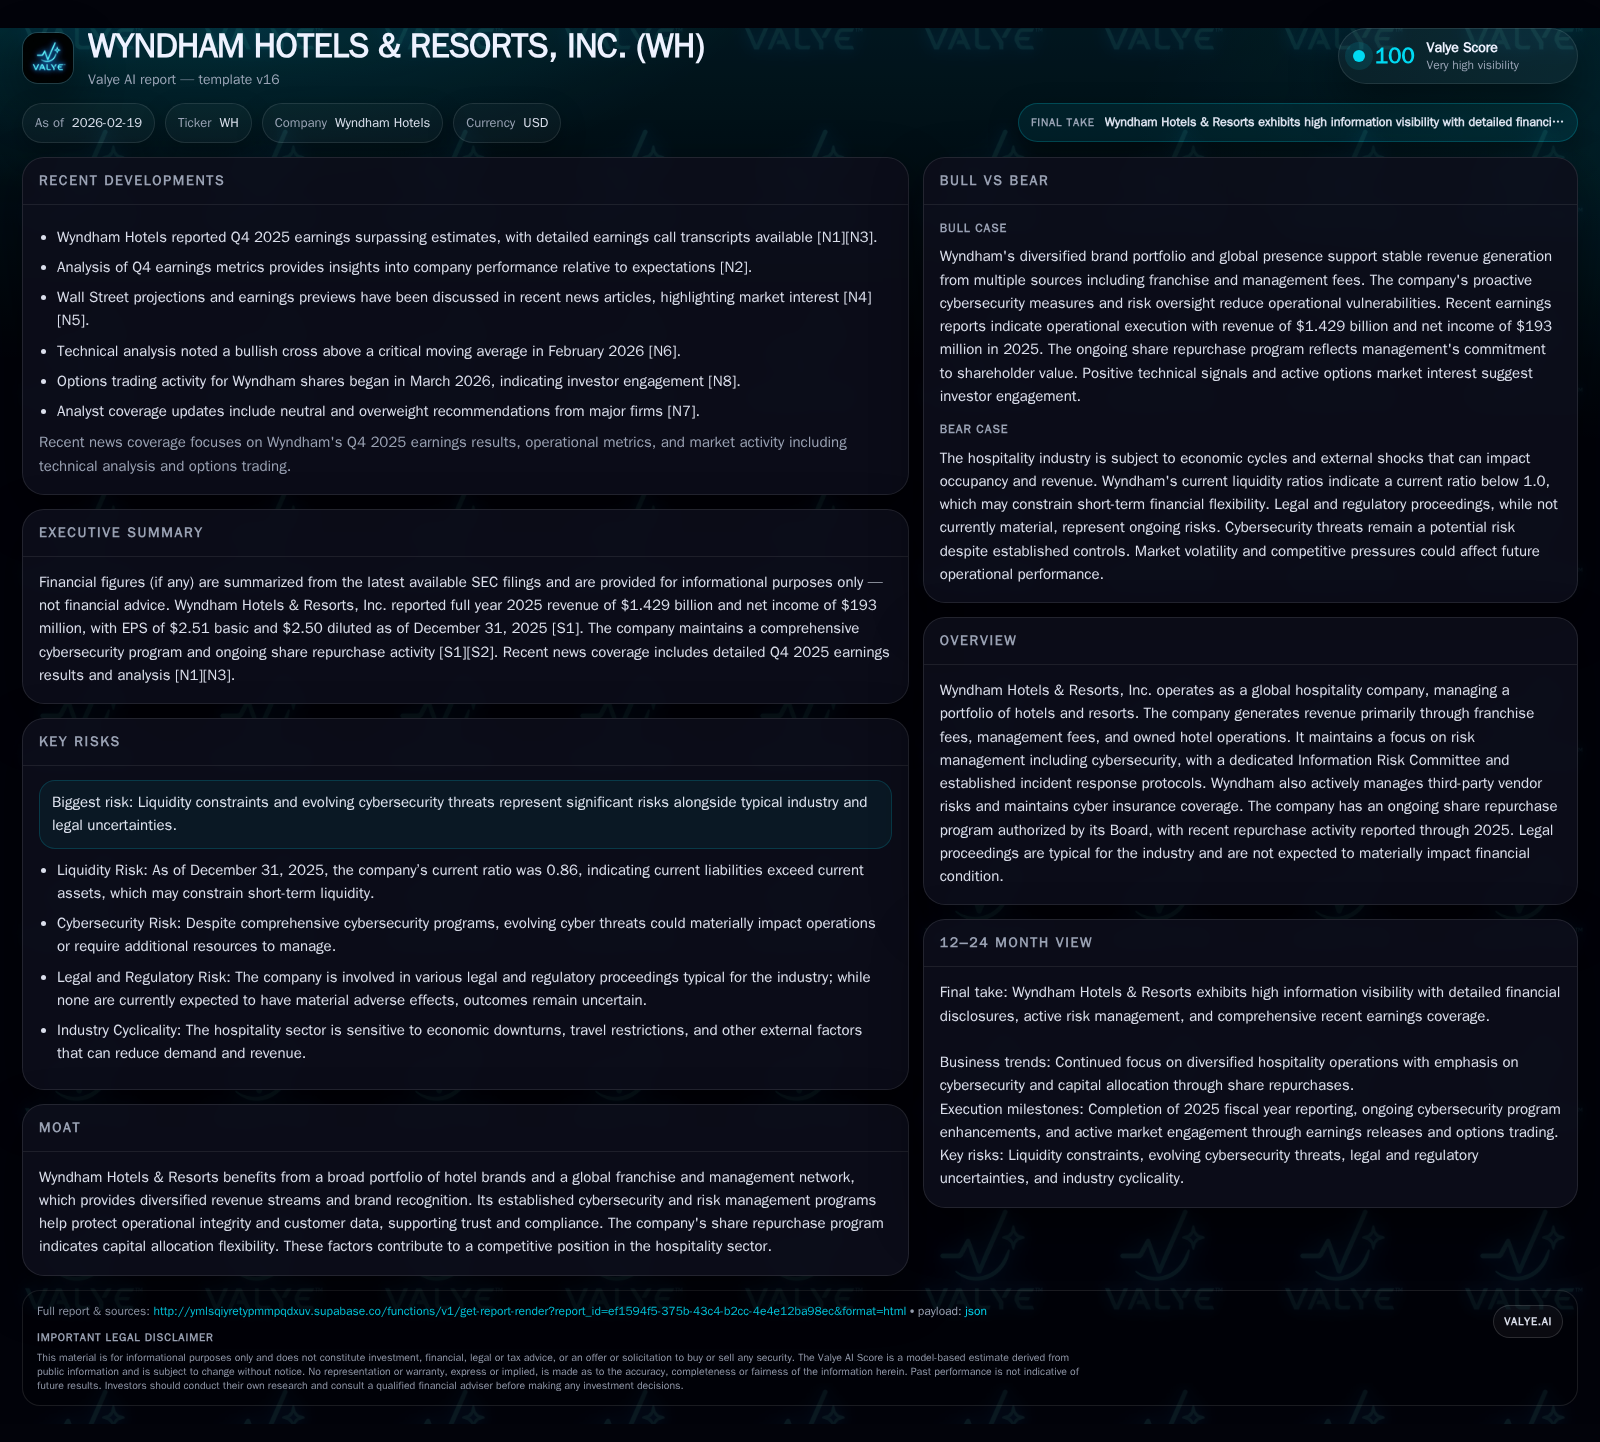
Wyndham Hotels & Resorts, a global hospitality franchisor, delivered modest revenue growth of 1.5% in fiscal 2025, reaching $1.43 billion. However, operating income fell nearly 19%, and net income declined over 33% year-over-year, reflecting margin pressures despite higher cash flow from operations. The company continues a disciplined capital return program featuring substantial share repurchases and dividends, with free cash flow generation supporting this allocation. While Wyndham maintains a robust cybersecurity and risk management framework, liquidity constraints and industry risks temper growth prospects. Future expansion depends on brand growth through franchising and management contracts, with operational efficiencies and financial flexibility being critical to sustaining shareholder returns.
Historical Performance: Steady Revenue Growth Meets Profitability Pressure
Wyndham Hotels & Resorts reported total revenues of approximately $1.43 billion for the fiscal year ended December 31, 2025, marking a moderate year-over-year increase of about 1.5% from $1.41 billion in 2024 [F1]. This reflects continued momentum following relatively flat to slightly declining revenues during the preceding years (revenues declined from $1.50 billion in 2022 to $1.39 billion in 2023 before rebounding slightly in 2024).
Despite the top-line resilience, operating income declined substantially by nearly 19% to $402 million in FY25 from $495 million the prior year [F1]. This suggests margin compression or rising expenses impacting core operations. Net income suffered an even sharper decline of approximately one-third (33%), falling from $289 million in FY24 to $193 million in FY25 [F1]. The driver for this disproportionate drop relative to operating income could include higher interest expenses or other non-operating costs but specific breakdowns are not detailed explicitly.
Importantly, cash flow from operating activities improved significantly by over a quarter (27%) reaching $367 million, suggesting non-cash charges or working capital improvements partially cushioned net income weakness [F1]. After capital expenditures of roughly $46 million—moderately down from prior years—free cash flow stood near $321 million, illustrating strong underlying cash generation capability.
Historical performance (annual)
| FY | Rev ($mm) | Net ($mm) | CFO ($mm) | OpInc ($mm) | Rev YoY | Net YoY |
|---|---|---|---|---|---|---|
| 2025 | 1429 | 193 | 367 | 402 | +1.5% | -33.2% |
| 2024 | 1408 | 289 | 290 | 495 | +0.8% | 0.0% |
| 2023 | 1397 | 289 | 376 | 503 | -6.7% | -18.6% |
| 2022 | 1498 | 355 | 399 | 558 |
Note: Omitted columns lack sufficient annual XBRL coverage in the provided tags (need ≥2 annual points): Capex. Source: SEC companyfacts cache [F1].
Capital returns and efficiency (annual)
| FY | Div ($mm) | Buybacks ($mm) | FCF ($mm) |
|---|---|---|---|
| 2025 | 127 | 266 | 321 |
| 2024 | 122 | 310 | 241 |
| 2023 | 118 | 393 | 339 |
| 2022 | 116 | 448 | 360 |
Source: SEC companyfacts cache [F1].
Note: Dividend and buyback figures represent payments made during each fiscal year; year-over-year percentage changes calculated where applicable.
Capital Allocation Strategy: Emphasis on Shareholder Returns Amid Operational Headwinds
Wyndham continues its shareholder-friendly capital allocation approach despite earnings pressure, distributing approximately $127 million in common stock dividends and repurchasing around $266 million of common shares during fiscal year 2025 [F1][S5]. The company’s Board-authorized repurchase program has been incrementally increased since inception with current remaining authorization exceeding $300 million as of late Q3-2025.
These distributions are funded by healthy operating cash flows combined with controlled capital expenditures averaging between $40-$50 million annually, well below cash generated from operations.
Liquidity was enhanced through a sixth amendment to Wyndham’s credit agreement which extended the maturity of its revolving credit facility from April 2027 to October 2030 while increasing the borrowing capacity from $750 million to $1 billion at competitive interest rates linked to Term SOFR [S8]. This amendment provides greater financial flexibility amid ongoing market uncertainties.
Cybersecurity and Risk Management: A Foundational Component for Sustained Operations
Cybersecurity remains a critical focus area for Wyndham given the hospitality industry's exposure to data security risks.
The Information Risk Committee (IRC), chaired by an experienced Chief Information Security Officer with over two decades in cyber forensic investigations, oversees comprehensive cybersecurity policies including prevention, detection, response, and remediation protocols supported by an annually tested Cybersecurity Incident Response Plan (CIRP) [S1][S7].
Board-level oversight is maintained through quarterly updates to the Audit Committee ensuring timely escalation of critical incidents.
Complementary cyber insurance covers both direct cyber losses and business interruption risks, mitigating financial impacts related to potential incidents [S9].
Third-party risk assessments further safeguard the supply chain by rigorously evaluating vendors' information security practices irrespective of data sensitivity.
Legal Proceedings: Normal Course Risks Do Not Materially Affect Financial Health
Wyndham is subject to various routine claims, legal proceedings, and regulatory inquiries typical for its industry scale; however, management does not anticipate any material adverse impact on its financial condition from these matters currently [S4].
Growth Outlook: Franchise Network Expansion Counterbalanced by Market Risks
Wyndham’s growth strategy centers on expanding its global portfolio through new franchise agreements and management contracts that generate fee-based revenues rather than asset-heavy ownership models [N1]. Its diverse brand portfolio spans economy to upscale segments offering penetration opportunities into emerging tourism markets.
Challenges include macroeconomic uncertainties affecting travel demand and inflationary pressures potentially increasing franchisee costs that could compress corporate margins.
Recent credit facility enhancements alleviate near-term liquidity risks supporting operational funding alongside robust free cash flow generation.
What To Watch: Key Indicators And Milestones Amid Uncertainties
Although no formal guidance beyond regulatory filings and quarterly disclosures is provided recently [N3], investors should monitor:
- Franchise fee growth and new signings as signals of system expansion,
- Operating margin trends reflecting cost control or inflation impacts,
- Free cash flow sustainability metrics,
- Updates on litigation or regulatory developments,
- Any cybersecurity incident disclosures given proactive risk management,
- Changes in capital allocation strategy balancing buybacks versus reinvestment.
Concluding Perspectives: Balancing Expansion With Prudence In A Competitive Hospitality Ecosystem
Wyndham Hotels & Resorts showed resilience with modest revenue growth amid profitability challenges marked by declining operating and net margins in fiscal year ’25. Strong cash flow generation supports significant shareholder returns via dividends and repurchases reflecting disciplined capital deployment. Robust cybersecurity governance frameworks combined with extended liquidity positions provide operational safeguards amid evolving threats. Nevertheless, macroeconomic headwinds and margin pressures require vigilant management execution. Monitoring strategic franchise portfolio growth alongside operational efficiency will be key for sustained shareholder value creation as post-pandemic travel patterns evolve.
Disclaimer: This analysis is based solely on publicly available information as of February 19, 2026 ([F1],[N1],[N3],[S4],[S5],[S7],[S8],[S9]). It is intended for informational purposes only and does not constitute investment advice.
Disclaimer: This is research-only, informational analysis and not investment advice. It may include AI-generated interpretation and general industry context. Always verify important details using primary sources.
Comments