
Wabash National Expands Digital and Service Offerings While Managing Industry Cyclicality and Leverage
Latest quarterly results highlight resilience through challenging market demand alongside strategic investments in integrated transportation solutions.
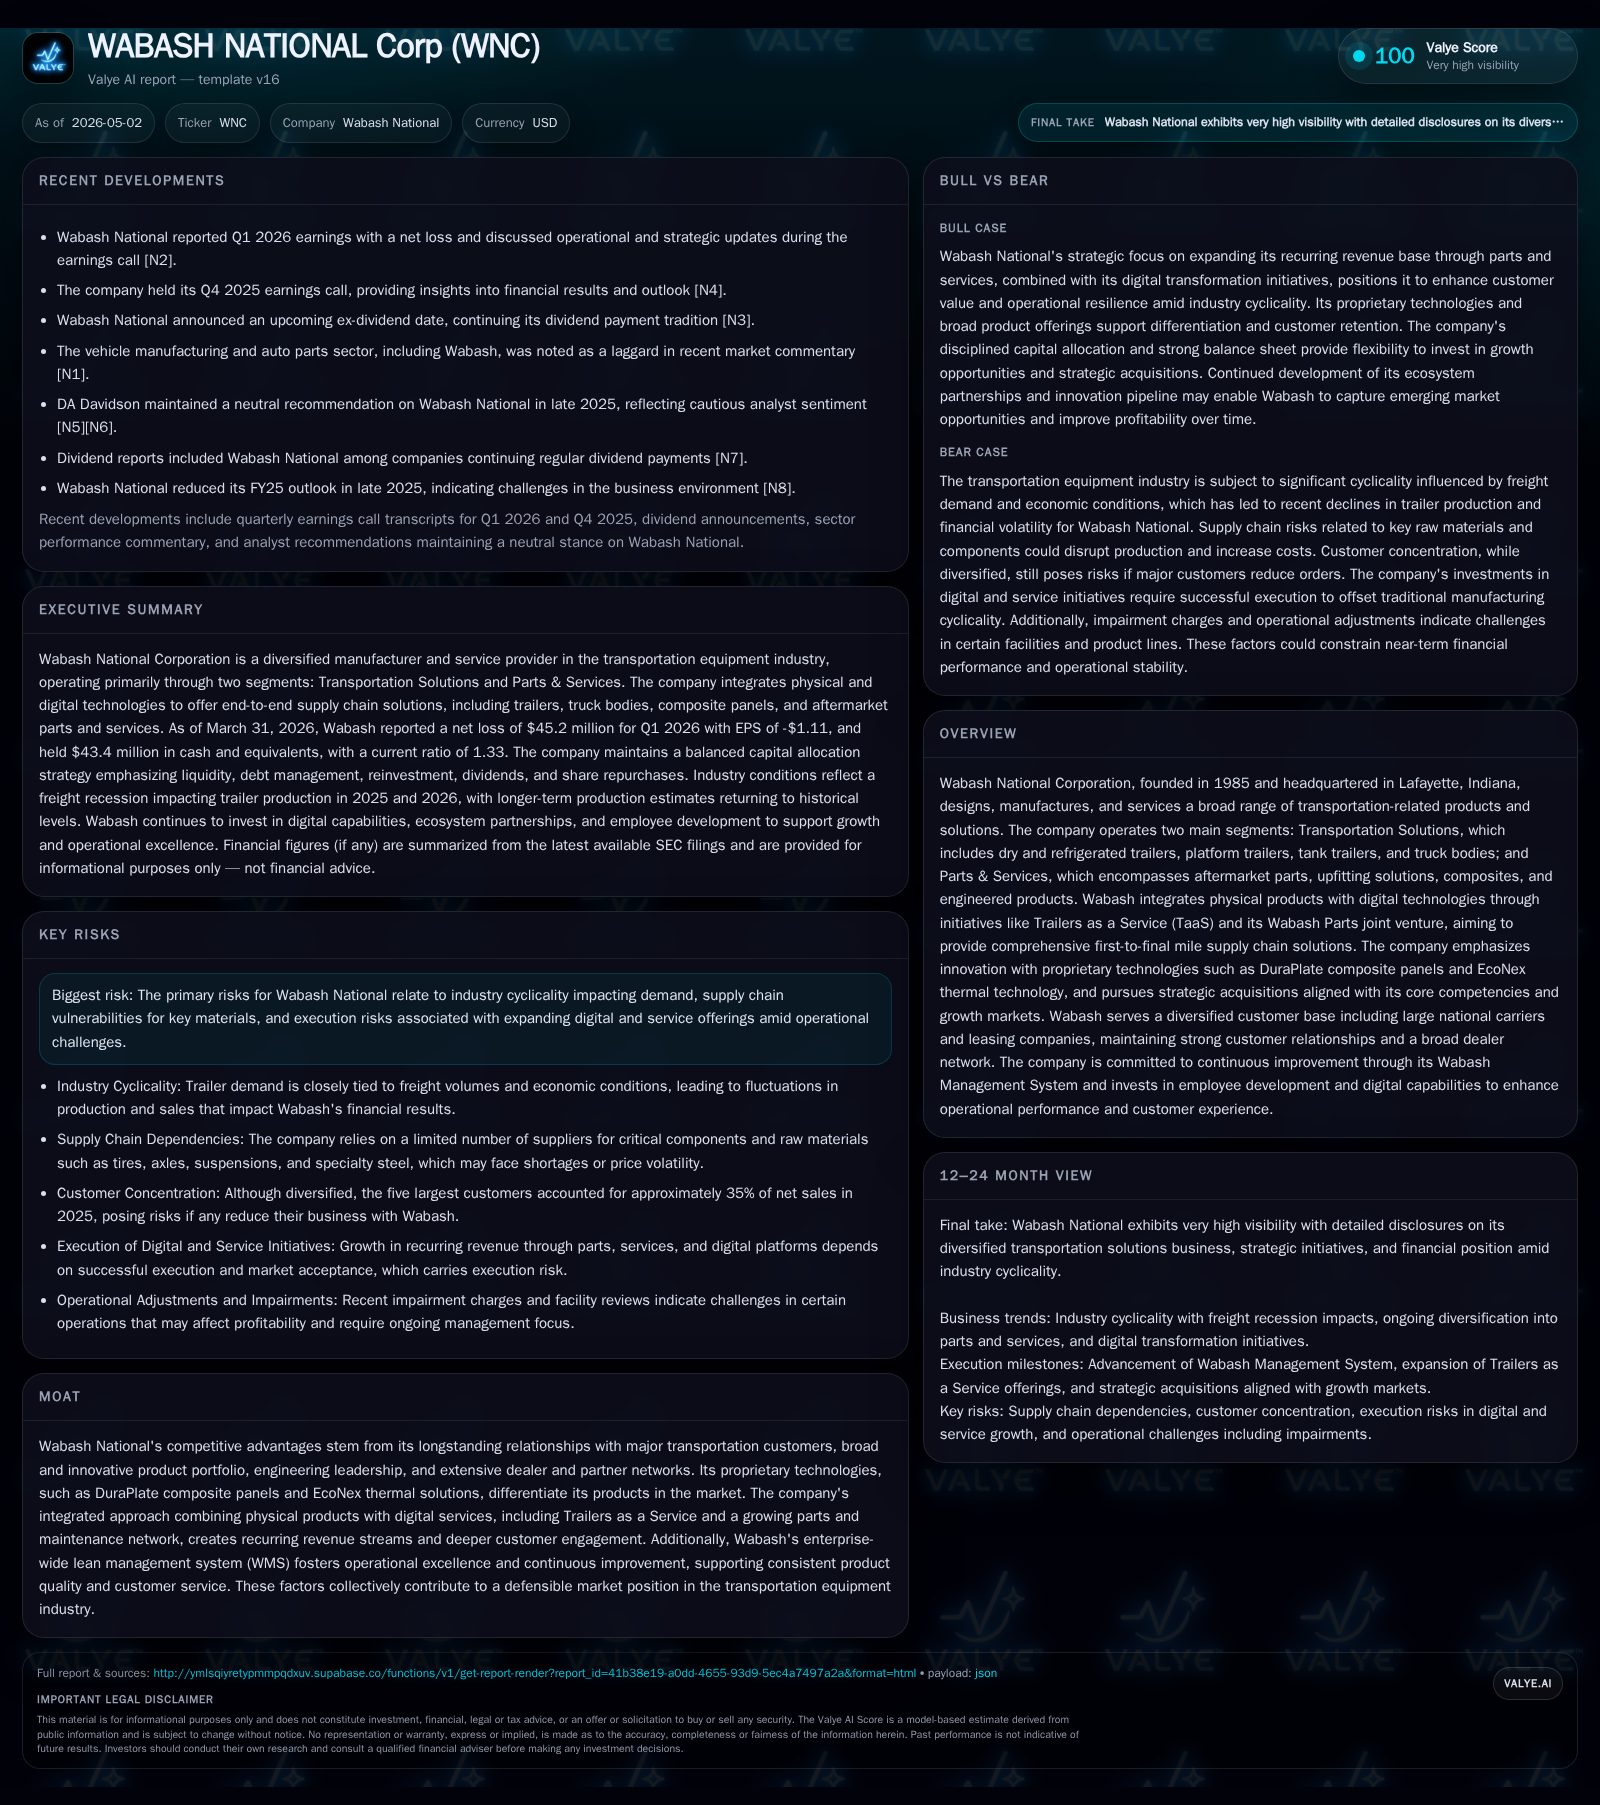
Wabash National's first quarter of 2026 reflects cautious demand in the transportation equipment industry amid a cyclical downturn. The company continues to evolve its business model by integrating physical trailers and digital services, including Trailers as a Service (TaaS), and expanding its Parts & Services segment. Proprietary innovations like DuraPlate composites and EcoNex thermal technology underpin product differentiation in a highly competitive landscape. While Wabash maintains strong dealer networks and long-standing customer relationships, the industry’s inherent cyclicality and leverage footprint warrant monitoring. The company's strategic focus on recurring revenue streams and operational excellence sets a foundation for sustainable growth once market conditions improve.
Recent Operating Update
Wabash National's Q1 2026 filing underscores a period of persistent softness in trailer demand attributable to challenging macroeconomic conditions affecting the North American transportation sector [S2][N1]. Despite headwinds, management highlighted prudent working capital controls and positive free cash flow year-to-date, signaling operational discipline in a cyclical trough. The ongoing strategic pivot towards digital services continued with investments in platforms like Trailers as a Service (TaaS), integrating telematics and AI-enabled fleet management to deepen customer engagement beyond traditional trailer sales [S3][N1].
Notably, the company's dealer-partner ecosystem remains robust, supporting service penetration alongside new trailer deliveries. The Parts & Services segment's growth trajectory is reflective of Wabash's focus on recurring revenue streams amid volatile new equipment orders [S2][N1].
Business Model
Wabash National generates revenue primarily from designing, manufacturing, and servicing transportation equipment across two segments:
Transportation Solutions: This includes dry freight trailers, refrigerated trailers, platform trailers, tank trailers, and truck bodies. Revenue drivers here are volume-based sales to major fleet operators along with pricing improvements enabled by innovative features.
Parts & Services: This segment offers aftermarket parts, upfitting services, engineered products (composites), and maintenance solutions. It also encompasses digital offerings like TaaS which provides an integrated package leveraging hardware and software for trailer lifecycle management.
Customers are mainly large fleet operators requiring durable, efficient trailers for diverse cargo types. Wabash's integrated approach—merging physical assets with digital services—aims to convert one-time product sales into longer-lived service contracts that stabilize revenue streams amid demand fluctuations [S1][N1].
Margins benefit from proprietary materials such as DuraPlate composite panels which reduce weight while enhancing durability, allowing customers operational efficiencies in fuel consumption and maintenance costs. Similarly, EcoNex thermal technology improves refrigerated trailer performance—a key attribute for cold chain logistics providers.
The company maintains close relationships with OEMs, dealers, and preferred partners that facilitate distribution efficiency and aftermarket support. Its Wabash Management System (WMS) promotes lean manufacturing practices driving consistent quality and cost control [S1].
Industry Structure and Competitive Position
Wabash operates in the highly cyclical North American transportation equipment industry which is sensitive to freight volumes, fuel prices, regulatory changes (e.g., emissions standards), and broader economic activity. Competitors range from diversified global equipment makers to specialized regional manufacturers.
Within this competitive set, Wabash's key advantages revolve around:
- Innovation Leadership: Proprietary composite technologies reduce total cost of ownership.
- Scale & Scope: Broad product portfolio covering multiple trailer types; ability to serve first-to-final mile logistics needs.
- Digital Integration: Early-mover in digital management solutions under TaaS enhances stickiness.
- Distribution Network: Extensive dealership and service reach ensures availability of parts/maintenance.
These factors create switching costs for customers who value integrated supply chain partners rather than fragmented suppliers. However, price competition remains intense due to overcapacity risks during downturns.
Growth Drivers
Digital-Physical Integration via TaaS
The shift from pure asset sales to service-oriented models leverages telematics data analytics enabling predictive maintenance, utilization optimization, and total cost transparency—services increasingly demanded by fleet operators optimizing return on investment. Scaling this platform is critical for recurring revenue growth beyond episodic trailer sales cycles.
Expansion of Parts & Services Network
Targeting higher aftermarket penetration deepens customer relationships post initial sale. Given that trailer fleets operate for many years with requisite maintenance/upgrades, this segment offers more stable margins less correlated with economic cycles.
Product Innovation Cycle
Ongoing investments in composite materials like DuraPlate reduce vehicle weight substantially versus steel alternatives without compromising strength or compliance requirements—a durable source of differentiation attracting premium pricing.
Strategic Acquisitions Aligned with Core Capabilities
Recent acquisition of TrailerHawk.ai introduced AI-powered telematics expertise compatible with Wabash’s TaaS vision bolstering its digital ecosystem [S23]. Such bolt-on acquisitions accelerate capability scale relative to organic development timelines.
Operational Excellence Through WMS
Lean manufacturing methods enhance throughput efficiency allowing margin preservation even under volume pressures; quick adaptation supports responsiveness during cyclical swings.
Risks / Watchpoints / Growth Constraints
Cyclical Demand Exposure
Trailer demand fluctuates sharply with GDP growth rates, freight hauling volumes, industrial production cycles, and infrastructure investments. Extended downturns can depress new trailer orders leading to revenue volatility despite diversification efforts [S16].
Supply Chain Vulnerabilities
Dependence on raw materials subject to price swings (steel alloys, composites resin), semiconductor shortages for telematics components remain points of potential disruption or margin erosion if pass-through pricing is constrained.
Leverage Profile and Debt Maturity Risks
With approximately $445 million total debt outstanding at end-2025 alongside $43 million cash equivalents yielding net debt near $402 million [F1], balance sheet flexibility faces pressure especially ahead of October 2028 Senior Notes maturity [S4][S7]. Covenants are currently met with a current ratio above 1.3x [F1], indicating short-term liquidity strength.
Execution Risks on Digital Scaling
Integrating newly acquired AI/telematics platforms at scale involves customary technology development risks—delays or lower-than-expected uptake could impair anticipated recurring revenue contributions [S23].
Legal Contingencies & Regulatory Compliance Costs
Though recent class action wage settlement exposures were minor (~$0.7 million) [S19], ongoing environmental site liabilities under CERCLA impose monitoring costs; unanticipated litigation outcomes could have episodic financial impacts.
What to Watch Next
- Orders & Backlog Trends: Key indicator of demand recovery or further softness given industry cyclicality.
- Adoption Rates of TaaS Solutions: Subscription metrics or contract renewals informing success of recurring revenue initiatives.
- Pricing Power on Composite Products: Reflecting product mix improvement relative to steel-only competitors.
- Debt Refinancing Plans: Timing/scope decisions around 2028 Senior Notes maturity will influence liquidity outlook.
- Capital Expenditure Levels: Balancing innovation investments against cash flow constraints during downcycles.
- Margin Trajectories Across Segments: Discerning operational leverage benefits from improved productivity or new product launches.
Financial Profile Summary
Latest financial snapshot
| Metric | Value | Period |
|---|---|---|
| Cash & equivalents | $43mm | |
| 2026-03-31 | ||
| Total debt | $445mm | |
| 2025-12-31 | ||
| Net debt | $402mm | |
| 2025-12-31 | ||
| Current assets | $469mm | |
| 2026-03-31 | ||
| Current liabilities | $353mm | |
| 2026-03-31 | ||
| Current ratio | 1.33x | |
| 2026-03-31 |
Source: SEC companyfacts cache [F1].
As of Q1 2026 quarter-end:
- Cash & equivalents stood at $43.4 million supporting liquidity needs during cyclical conditions [F1].
- Current assets were $469 million against current liabilities of $353 million yielding a healthy current ratio of approximately 1.33x signifying short-term solvency strength [F1].
- Total debt remained around $445 million dominated by unsecured senior notes maturing in 2028 bearing a fixed interest rate of 4.5% [F1][S8].
- Operating income for full-year 2025 was reported at $307.5 million reflecting robust operational capability despite macro headwinds; however net income was a loss due largely to one-time items including legal charges as noted in annual filings [F1][S20].
- The company continues paying quarterly dividends ($0.08 per share) balanced against share repurchases reflecting commitment to shareholder returns while navigating capital allocation prudently under market uncertainties [S10].
Overall, Wabash National demonstrates operational resilience anchored by technological differentiation and expanding service offerings that aim to smooth traditionally volatile earnings amid the transportation equipment cycle fluctuations. Execution effectiveness on digital integration progress alongside macroeconomic recovery catalysts will be pivotal for reaccelerated growth trajectories in upcoming quarters.
This report reflects analysis based strictly on disclosed SEC filings as of early May 2026 combined with recent public earnings commentary—all numerical claims reference cited sources without conjecture or external data supplementation.
Disclaimer: This is research-only, informational analysis and not investment advice. It may include AI-generated interpretation and general industry context. Always verify important details using primary sources.
Comments