
Warby Parker Advances Omnichannel Eyewear and Vision Care Expansion Amid Retail Growth
The latest quarterly results highlight Warby Parker’s strategic progress in integrating digital technology with an expanding physical retail footprint, while managing profitability pressures.
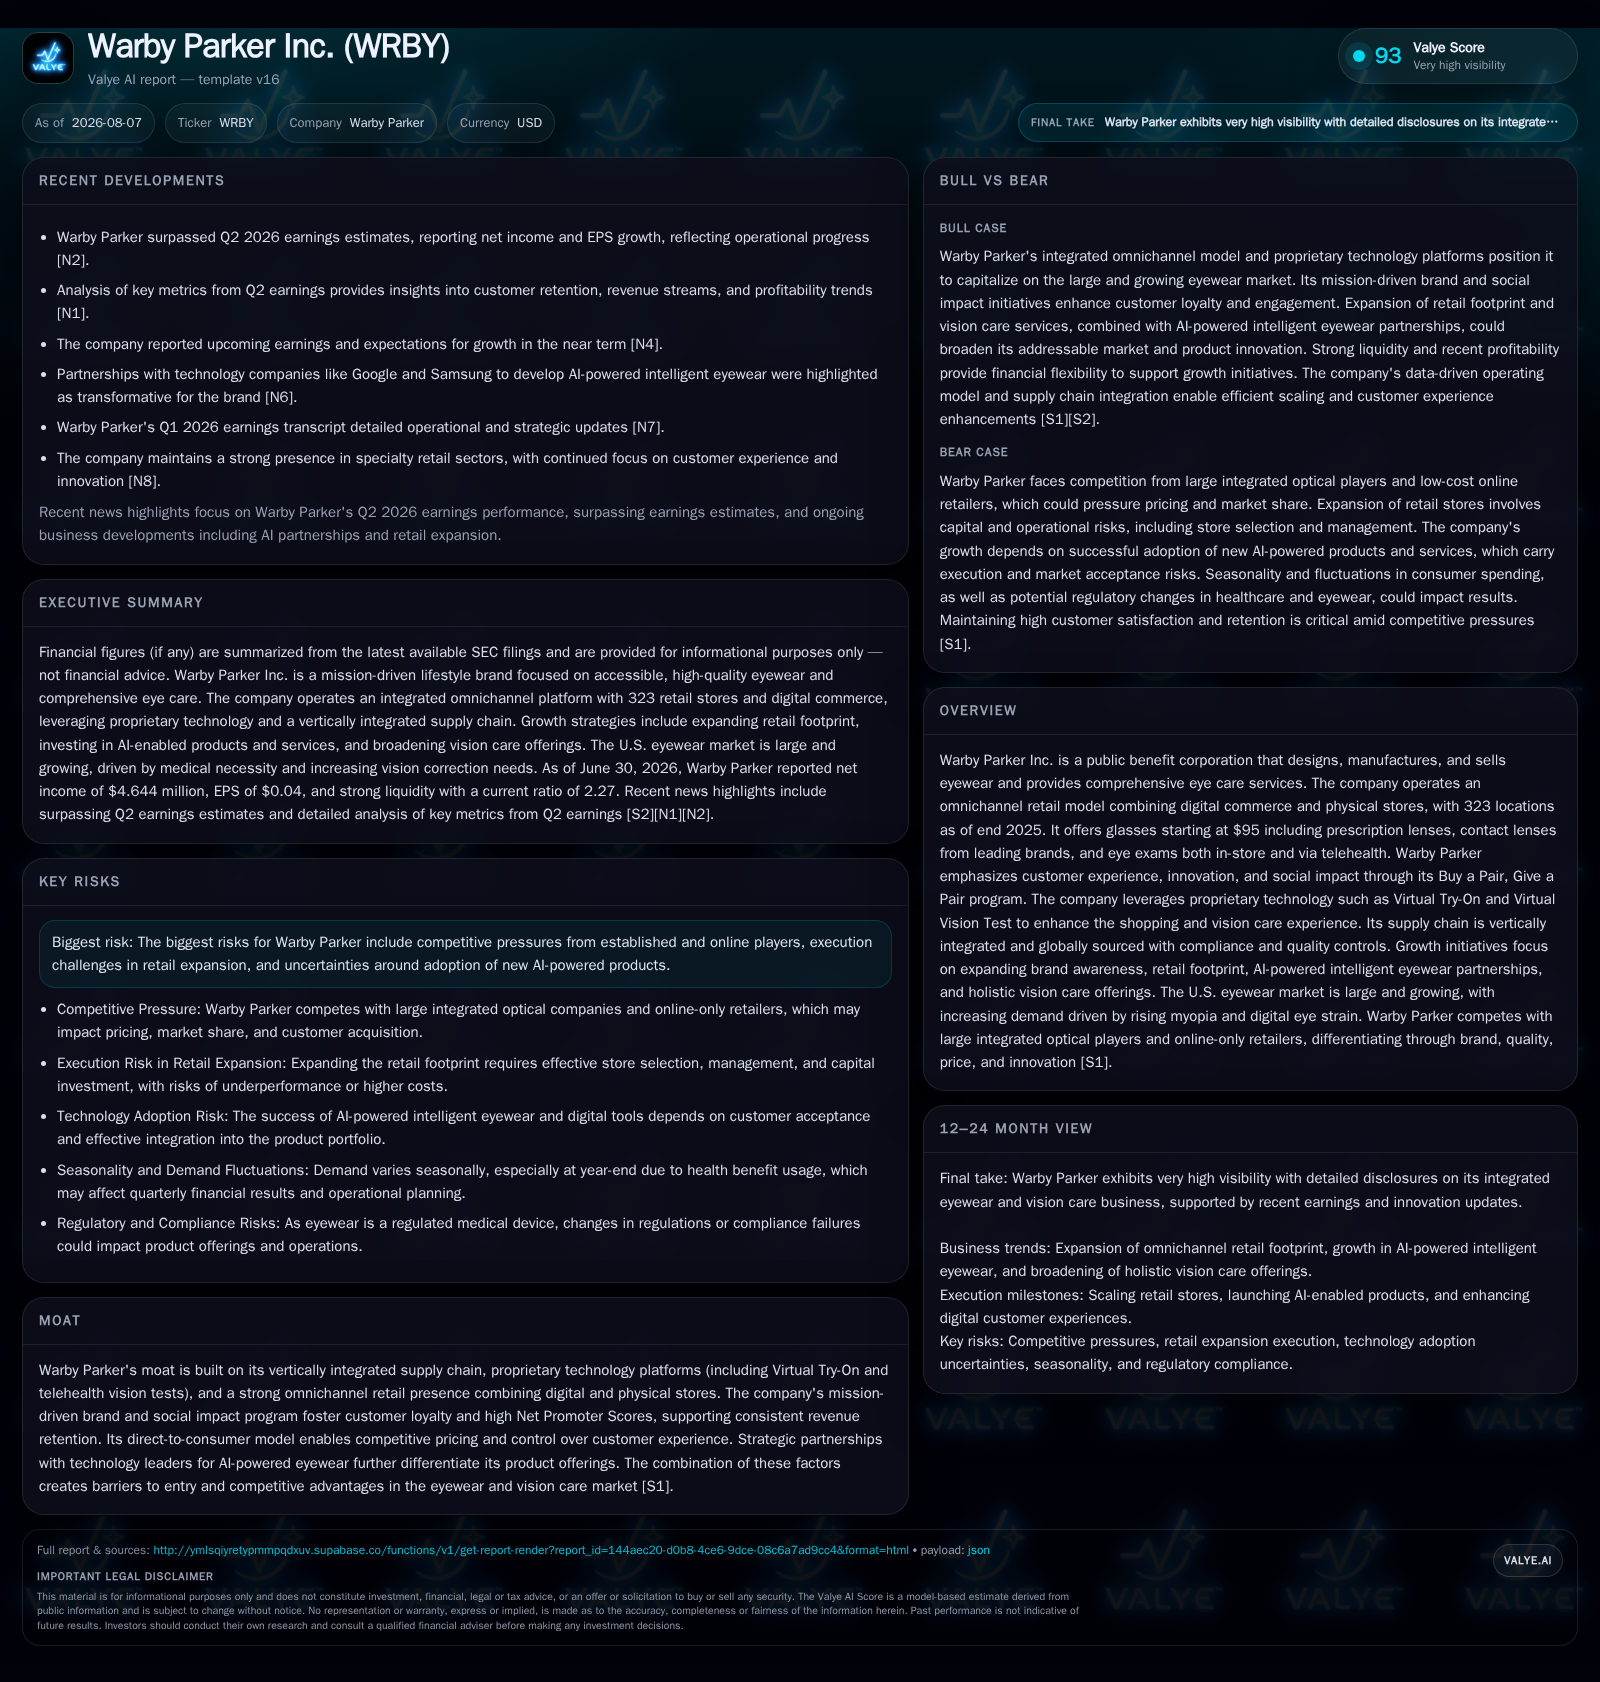
Warby Parker reported Q2 2026 results underscoring continued investment in its omnichannel model that blends direct-to-consumer eyewear sales and comprehensive eye care services. The company operates 323 stores as of end-2025, with robust proprietary technology platforms enhancing customer experience and retention. While growth in retail stores and vision care services drives top-line expansion, margin compression and operating losses persist amid scaling costs. Vertical integration and technology differentiation remain key competitive moats. Risks include execution complexity in retail expansion and adoption challenges for new AI-powered eyewear products.
Recent Operating Update
Warby Parker’s second quarter ending June 30, 2026, provided clarity on its incremental progress toward scaling an integrated eyewear and vision care platform. While the company has not materially changed risk factors from the prior annual report filing, the latest filings affirm continued emphasis on retail footprint expansion coupled with enhanced eye care offerings [S2][S3]. The firm now operates 323 physical stores across the U.S. and Canada as of December 31, 2025, up from earlier counts, with an expanded subset providing in-person eye exams (285 locations), anchoring its push into comprehensive vision services beyond product retailing [S1].
This omnichannel approach combines digital commerce capabilities—highlighted by technologies such as Virtual Try-On for product selection and Virtual Vision Test for telehealth services—with a curated physical presence situated in high-traffic lifestyle centers, malls, grocery-anchored centers, and street locations [S1]. The ability for customers to initiate shopping online before transitioning seamlessly to stores—and vice versa—demonstrates robust channel integration crucial for sustained customer engagement.
Business Model Insights
Warby Parker operates as a mission-driven public benefit corporation focused on democratizing vision care products through a direct-to-consumer design-to-sale process. It designs eyewear in-house facilitating better control over style innovation while using a vertically integrated supply chain that includes company-owned optical labs paired with longstanding external manufacturers to balance nimbleness with scale efficiency [S1]. This vertical integration ensures quality consistency from frame sourcing (primarily cellulose acetate from a single key supplier) through final prescription lens fitting—a critical factor given tighter regulatory controls on product safety and medical device compliance [S1][S14][S26][S27].
Revenue is principally generated through sales of prescription glasses priced starting at $95 including lenses—a notably accessible price point compared to traditional luxury or multi-layered distribution optics chains—contact lenses sourced from premium brands sold via online channels, and billings for vision exams offered both within stores and through telehealth platforms. This broad product-service mix lends recurring characteristics given frequent repurchase cycles for contact lenses driven by disposable usage patterns [S1], adding steadiness to revenue streams beyond one-time frame purchases.
Monetization is achieved by owning the end-customer relationship which facilitates personalized upsells (lens enhancements like blue light filters) and cross-selling between channels. Customer retention is strong with approximately 50% cohort retention over two years and over 100% net cohort revenue retention after four years—a hallmark of effective lifecycle management underpinning customer lifetime value (LTV) dynamics [S1]. The social impact program “Buy a Pair, Give a Pair” fortifies brand affinity by engaging consumers in charitable giving linked directly to product purchases.
Industry Structure and Competitive Positioning
The eyewear retail industry blends specialty retail fashion elements with healthcare service delivery under increasing technological innovation pressure. Key competitors vary from legacy optical giants such as Luxottica/EssilorLuxottica—which offer vertically integrated manufacturing plus broad retail chains like LensCrafters—to specialized online pure-plays like GlassesUSA. Contact lens provision faces competition from dedicated players such as 1-800 Contacts.
Warby Parker’s combination of robust omnichannel presence (323 stores plus digital platforms), proprietary technology enabling virtual try-ons which reduce friction in purchase decisions, telehealth-enabled remote vision exams differentiates it within this crowded landscape. Its vertically integrated supply chain reduces reliance on capacity-constrained or price-inflexible manufacturers common among pure retailers.
Yet this positioning demands continuous execution excellence. Retail store expansion necessitates attracting skilled optometrists—scarce labor intensives—which introduces risk around recruitment costs and geographic market saturation [S1]. Moreover, regulatory requirements covering optical device labeling, medical device standards (FDA’s Quality Management System Regulation), consumer privacy laws applicable to telehealth interactions add compliance cost layers.
Growth Drivers
Several secular trends support Warby Parker’s growth trajectory:
- Increased digital device use elevates awareness of digital eye strain driving demand for corrective eyewear [S1], fueling both new customer acquisition and higher frequency repurchases.
- Consumer preference increasingly favors flexible shopping journeys blending online convenience with physical try-on experiences—Warby’s omnichannel model aligns closely here.
- Expansion of AI-powered eyewear offers an emerging category with potential to create differentiated products embedding smart features enhancing health or user interaction.
- Scaling of vision care services including telehealth improves customer stickiness through clinical engagement not easily replicated by non-healthcare retailers.
- Social impact branding enhances loyalty particularly among socially conscious demographics that correlate positively with higher Net Promoter Scores (NPS).
Key operational KPIs include same-store sales growth to monitor physical footprint productivity; eye exam volumes reflecting service adoption; repurchase frequency metrics particularly for contact lenses signaling retention; average order value demonstrating successful upselling; inventory turnover indicating supply chain agility; all collectively driving gross margin trend analysis.
Risks and Challenges
Frontline risks comprise:
- Execution risk expanding physical stores while maintaining unit economics amid escalating hiring costs for optometrists and store personnel potentially constraining profitability [S1][S5].
- Supply chain vulnerabilities highlighted by dependence on limited cellulose acetate suppliers require continuous monitoring given potential disruptions or pricing instability [S1][S26].
- Adoption risk tied to innovative AI-powered eyewear products—customer acceptance uncertain impacting return on R&D investment.
- Regulatory complexity spanning differing state optometry laws combined with evolving healthcare data privacy regulations expose compliance cost uncertainties.
- Intensified competition from entrenched incumbents capable of aggressive pricing or leveraging scale advantages could pressure margins.
- Potential reputational impacts stemming from product recalls or litigation related to medical device claims pose financial downside risks [S14][S19].
What To Watch Next
Indicators critical for assessing Warby Parker’s near-term trajectory will include:
- Comparable store sales growth trends as indicators of existing base health amid new store rollouts.
- Progress in eye exam volume growth signaling traction of the expanded service offering portion.
- Customer retention metrics including NPS updates or repurchase frequencies reflecting stickiness improvements.
- Operating margin progression revealing whether scale efficiencies are materializing beyond growth spending.
- Updates on product pipeline commercialization particularly around AI-integrated intelligent eyewear modes.
- Store count expansion pace maintaining balance between market reach gain versus risk of overextension.
Monitoring these markers against peers such as Luxottica subsidiaries or online analogues like GlassesUSA will contextualize competitive effectiveness in this evolving segment.
Financial Profile Discussion
As of June 30, 2026, Warby Parker maintains a solid liquidity position with $292.7 million in cash & equivalents supported by $370.8 million in current assets against $163.5 million current liabilities yielding a healthy current ratio of approximately 2.27—indicative of adequate short-term financial flexibility to support operating needs and growth investments [F1]
The company reported an operating loss totaling $5.3 million for full year ended December 31, 2025 but earned net income slightly above breakeven at $1.64 million during the period suggesting early signs of improved profitability despite sizable reinvestment into retail build-out and technology development [F1]
Capital allocation includes a board-approved share repurchase program authorizing up to $100 million to buy back stock reflecting confidence in long-term shareholder value creation while balancing accessible capital reserves for expansionary initiatives [S4][S29]
Warby faces conventional retailer challenges balancing SG&A expenditure growth driven by labor costs against steady gross margin maintenance pressured by competitive pricing strategies inherent to direct-to-consumer models but offset somewhat by vertical integration advantages lowering input expenses [S1][F1]
Overall liquidity appears sufficient for near-term strategic execution pending sustained positive operating cash flows dependent on scaling envisioned technology-enabled services alongside physical footprint expansion.
This analysis synthesizes publicly filed SEC disclosures alongside industry context without providing investment advice or forecasts. All quantitative claims are grounded strictly in cited quarter-end filings and official documents.
Disclaimer: This is research-only, informational analysis and not investment advice. It may include AI-generated interpretation and general industry context. Always verify important details using primary sources.

Comments