
WillScot’s Network Optimization and Leasing Flexibility Constrain Revenue Amid Margin Pressure
WillScot Holdings Corp’s 2025 results reflect strategic restructuring costs and unit demand declines, shaping near-term financial performance.
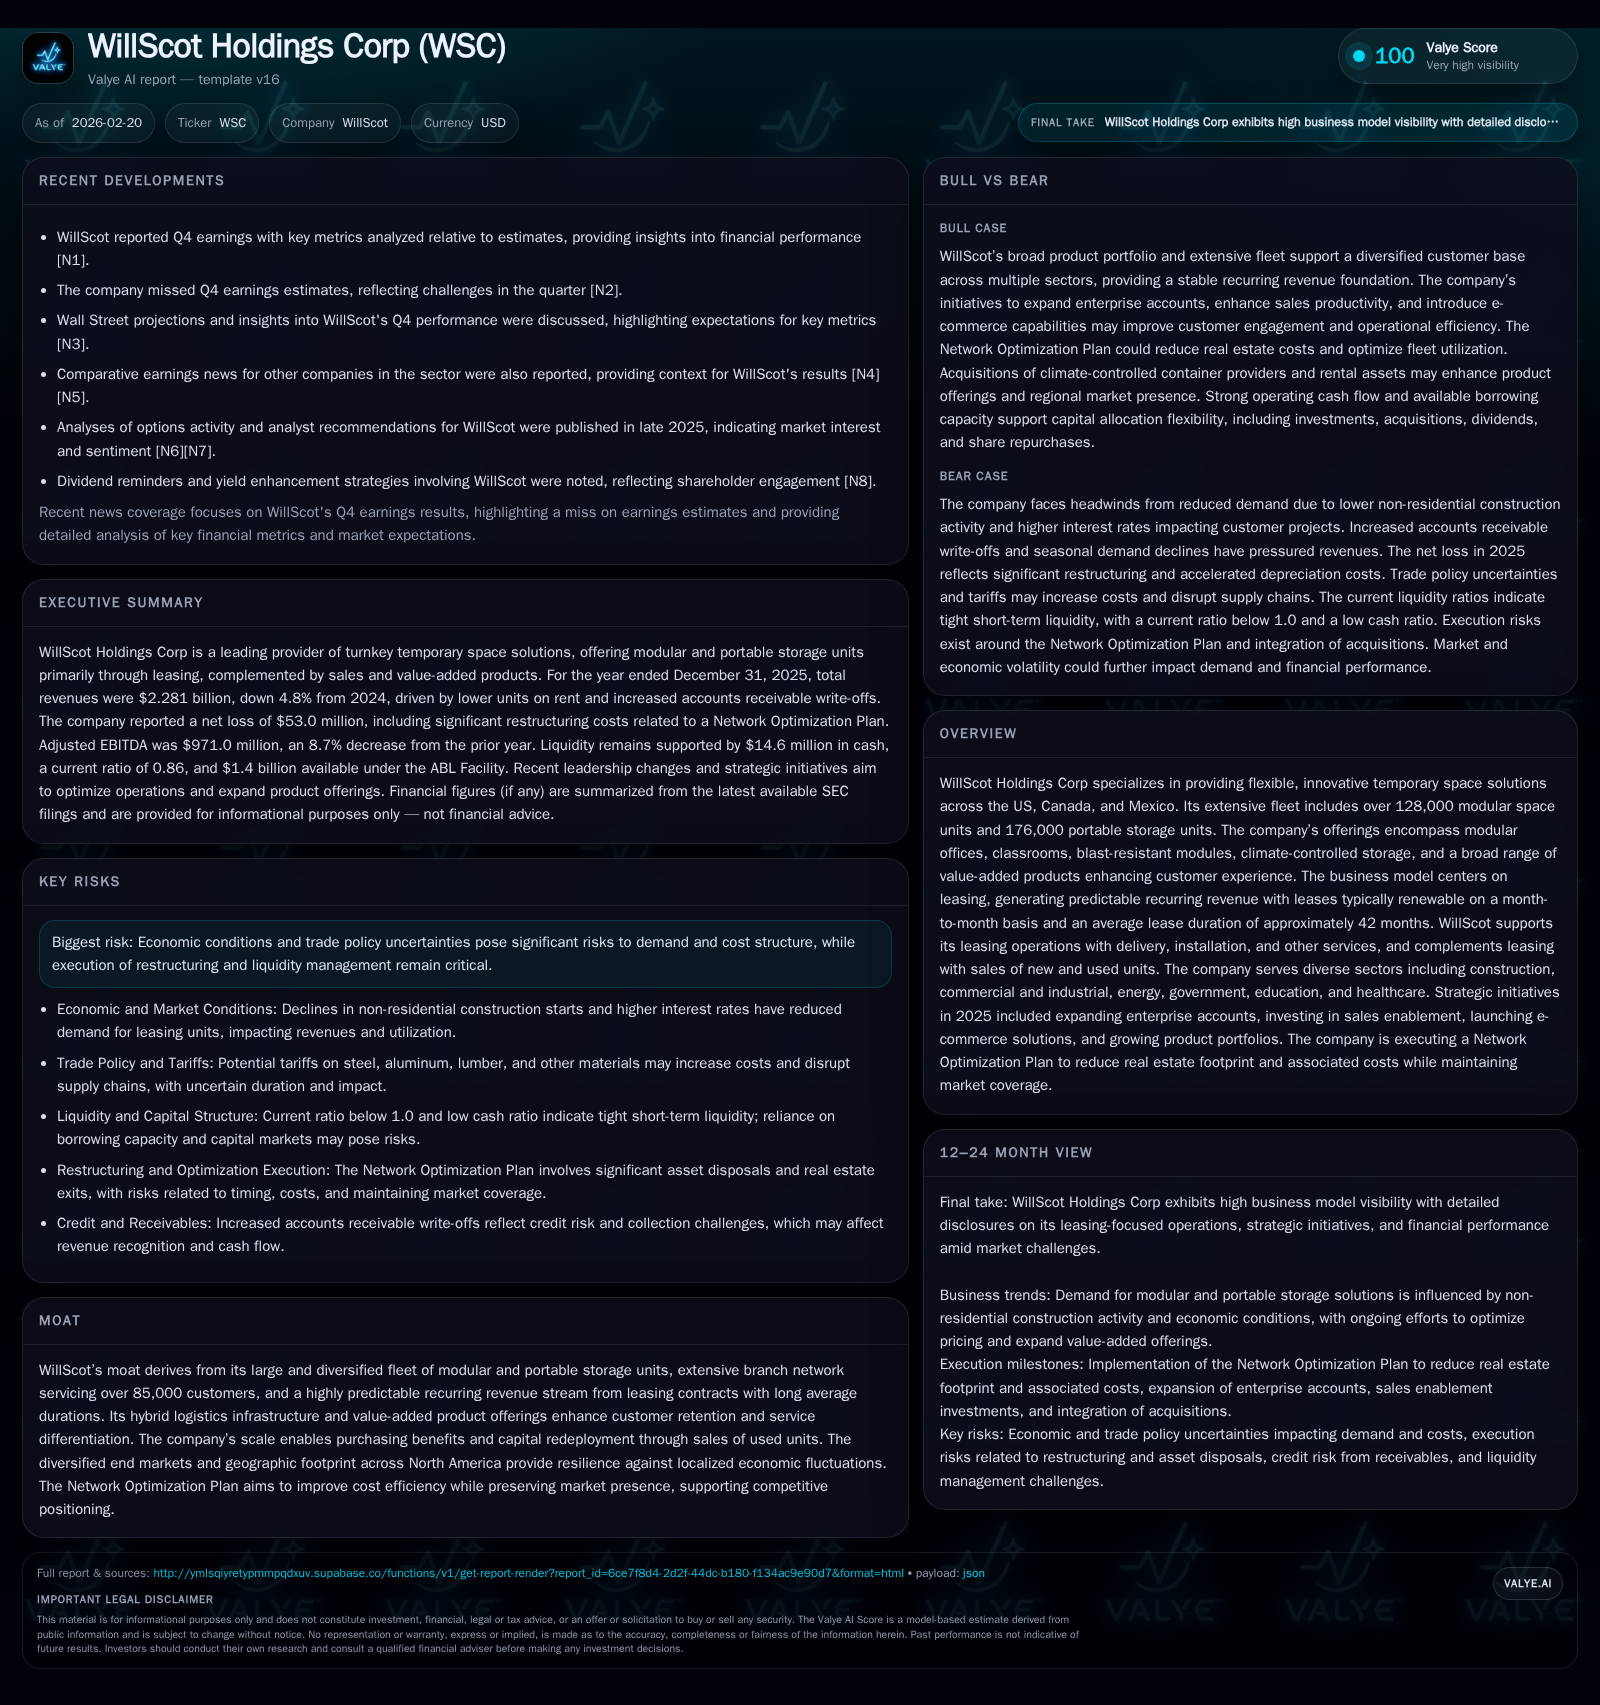
WillScot Holdings Corp (WSC), a key provider of modular and portable storage leasing solutions in North America, saw revenues decline 4.8% in 2025 to $2.28 billion, driven by lower units on rent and increased receivables write-offs. Operating income contracted more sharply by over 30% due primarily to restructuring costs under its Network Optimization Plan and declining demand from softer non-residential construction starts. Despite a loss in net income, operating cash flow grew strongly, enabling continued capital deployment toward targeted acquisitions, share repurchases, and dividends. The company’s future growth hinges on stabilizing demand through diversified end-markets and leveraging services and value-added products while managing real estate footprint optimization.
Company Overview
WillScot Holdings Corp (NYSE: WSC) stands as a leading business services entity specializing in the provision of turnkey temporary space solutions predominantly across the US, Canada, and Mexico. Its expansive fleet comprises over 128,000 modular space units alongside more than 176,000 portable storage units. The product catalog extends beyond traditional modular offices to encompass mobile offices, classrooms, blast-resistant modules, clearspan structures, climate-controlled containers and trailers, as well as a broad array of value-added products (VAPS) such as furniture packages, telematics systems, connectivity solutions, power and solar options that collectively augment customer convenience [S1].
The company’s cornerstone resides in its leasing-centric business model where over ninety percent of new leases are executed under pre-negotiated master agreements or enterprise account contracts with typical billing cycles on a monthly basis and an average effective lease portfolio duration of approximately 42 months excluding seasonal units. This structure generates highly predictable recurring revenues backed by diversified end markets including construction/infrastructure, commercial/industrial sectors, energy/natural resources, government institutions like education and healthcare [S1][S8][S15].
Supporting its leasing operations is an integrated hybrid logistics model combining in-house capabilities with outsourced partners aimed at delivery, installation, site work, and eventual removal—services often bundled or charged separately depending on customer engagement levels [S1]. Furthermore, the company complements its leasing business through sales of new and used units allowing it to cyclically deploy capital efficiently while capitalizing on scale-related purchasing advantages.
Historical Performance: Growth Drivers and Financial Trends
Over the four-year span from FY2022 through FY2025, WillScot exhibited marked growth from approximately $591 million revenue in FY2022 to nearly $2.4 billion in FY2024 resulting from fleet expansion and market penetration strategies before encountering a reversal trend into FY2025 [F1]. The following table summarizes key annual financial metrics:
Historical performance (annual)
| FY | Rev ($bn) | Net ($mm) | CFO ($mm) | OpInc ($mm) | Rev YoY | Net YoY |
|---|---|---|---|---|---|---|
| 2025 | 2.3 | -53 | 762 | 181 | -4.8% | -288.4% |
| 2024 | 2.4 | 28 | 562 | 264 | +1.3% | -94.1% |
| 2023 | 2.4 | 476 | 761 | 673 | +300.4% | +451.5% |
| 2022 | 0.6 | 86 | 745 | 511 |
Note: Omitted columns lack sufficient annual XBRL coverage in the provided tags (need ≥2 annual points): Capex, Div, Buybacks. Source: SEC companyfacts cache [F1].
Capital returns and efficiency (annual)
| FY | FCF ($mm) | ROE% |
|---|---|---|
| 2025 | 738 | -6.2 |
| 2024 | 543 | 2.8 |
| 2023 | 739 | 37.8 |
| 2022 | 701 | 5.5 |
Source: SEC companyfacts cache [F1].
*FY2023 represented exceptional growth driven by prior acquisitions and fleet scaling compared to FY2022 base.
Source: [F1]
Revenue Declines Tied To Leasing Demand Softening
In FY2025 total revenue declined to $2.28 billion from $2.40 billion the previous year—a drop of nearly five percent driven primarily by an average units-on-rent decrease of about eleven percent (down roughly ~25k units). This downturn reflects the ongoing market pressure from subdued non-residential construction starts fueled by higher borrowing costs over recent years impacting small- to medium-scale projects [S20][S26]. Notably this was compounded by two large prior-year projects contributing about $26 million that did not recur in the period.
Despite declining volumes, WillScot pushed through average monthly rate increases for modular units (+4.9%) and particularly for portable storage (+7.5%), helped partially by a favorable shift toward climate-controlled containers commanding premium pricing [S20][S26]. The unit economics thus reveal attempted pricing optimization amid volume headwinds.
Earnings Impacted By One-Time Charges Related To Restructuring
Operating income shrank substantially by over thirty percent year-over-year to $181 million largely attributed to significant restructuring costs incurred under WillScot’s strategic Network Optimization Plan comprehensive review initiated late-2025 aimed at reducing excess real estate footprint—including contraction of branch locations (about one-quarter of leased acreage scheduled for exit)—and retirement or accelerated depreciation on around ~53k rental units flagged as long idle or costly to maintain [S25]. These actions generated approximately $302 million in restructuring expenses representing accelerated depreciation plus related costs.
Additionally reported net income swung negative to a loss of close to $53 million contrasting with prior positive earnings (+$28 million). This swing includes both operating profits impact and financing/other charges such as interest expense incrementally higher than previous years [$231M], losses on debt extinguishment incurred during buyback/redemption maneuvers as well as tax benefits recognized given losses booked [F1][S13][S25].
Operational Efficiency And Cost Controls
Concurrently WillScot achieved cost containment efforts evidenced by approximately $19 million reduction in leasing and service cost components driven mainly by decreases in subcontractor spend (-7.4%) and materials (-4.6%), alongside moderated labor cost increases related mostly to incremental sales staff additions supporting enterprise accounts initiatives [S17]. SG&A expenses favorably decreased overall due primarily to reduced provisions against credit losses linked with aged receivables write-offs becoming actual charges rather than reserves [S17]. Management also noted ongoing insourcing trends contributing to cost efficiency.
Future Growth Prospects And Strategic Priorities
Growth Catalysts: Demand Drivers & Expansion Initiatives
WillScot's growth outlook centers on stabilizing and eventually growing its core leasing portfolio through several vectors:
- Market Diversification: Serving multiple end-markets spanning construction/infrastructure (
largest), commercial-industrial sectors including retail/trade customers (85% revenue combined), energy/natural resources segments, government institutions including educational facilities and healthcare [S20][S15]. This mix provides some mitigation against localized economic downturns. - Product Innovation & Portfolio Expansion: Continual rollout of new product categories such as expanded climate-controlled storage offerings tailored for sensitive goods logistics; perimeter security products; advanced telematics/connectivity solutions enhancing customer experience; clearspan structures enabling larger scale deployments; solar power integrations for remote sites all contribute incremental value that differentiates WillScot’s positioning versus competitors [S1][S20].
- Sales & Technology Investment: Strengthening Enterprise Account teams focusing on key verticals aligned with major infrastructure projects; sales enablement tools unlock improved productivity; launching ecommerce platforms streamlining customer self-service ordering processes which have become increasingly vital post-pandemic adaptability shifts [S1].
- VAPS Penetration: Value-Added Products continue to grow as an attach rate lever driving higher rental rates per unit plus margin improvement opportunities while reinforcing client stickiness given integrated bundled offerings [S1][S26].
- Acquisitions: Recent purchase of a regional climate-controlled container provider plus fleet asset acquisitions totaling over $141 million help broaden geographic reach and specialized unit inventory for emerging demand pockets especially amidst supply chain volatility concerns [S10][S11].
Constraints And Risks Capping Near-Term Growth
Conversely several factors temper upside potential within the forthcoming periods:
- Continued Macro-Economic Weakness: Persistent softness in non-residential construction starts tied closely to interest rate cycles remains a critical headwind limiting unit utilization improvement or volume growth prospects over short-to-medium horizon [N1][N2]. Reduced retail trade activity impacted seasonal storage container demand significantly year-on-year as well.
- Trade Policy Uncertainties: Ongoing tariffs or trade restrictions particularly on steel/aluminum imports pose risk via escalated raw material costs impacting acquisition prices for new modular/storage products not fully transferable downstream given competitive market pressures [S21]. Supply chain disruptions arising from geopolitical tensions could further delay fleet replenishment or customization timelines.
- Restructuring Execution Risks: The ambitious Network Optimization Plan requires delicate balancing between rationalizing physical infrastructure cost bases versus maintaining adequate market coverage without diluting service quality—any missteps could erode customer loyalty or operational efficiency gains envisaged [S16][S25].
- Credit Risk Exposure: Elevated amounts of aged receivables have necessitated increased write-offs reflecting tightening credit management focus but still pose uncertainty regarding collections trends if economic pressures persist among customers [S17].
- Competitive Pressures: The industry landscape involves sizable competitors aiming similarly at innovation-led product differentiation plus leveraging scale advantages which necessitates ongoing investment cycles potentially pressuring margins further.
Capital Allocation And Returns Profile
WillScot’s capital allocation strategy emphasizes balanced deployment ensuring liquidity preservation while pursuing shareholder returns alongside growth investments:
- Cash Flow Generation: Operating cash flow surged substantially by over thirty-five percent year-over-year reaching $762 million – a strong indicator of core cash-generative capability despite net income losses chiefly associated with non-cash restructuring charges [F1][S22]. Adjusted free cash flow after capex remained robust at roughly $489 million though down modestly trailing prior year levels.
- Capital Expenditures: Investments in property plant & equipment modestly grew from $18 million in FY24 to $24 million reflecting spending on maintenance capex plus refurbishment acknowledging lifecycle management needs within rental fleet assets [F1][S7][S9][S12][S18].
- Shareholder Returns: Following Board approval initiation during early CY2025 established quarterly dividend payments at $0.07/share totalled about $51 million distributed through the year evidencing commitment towards steady income streams for investors [F1][S10]. Concurrently share repurchases returned nearly $97.5 million shrinking outstanding shares enhancing per-share metrics potential going forward supported by ample authorization remaining.
- Debt & Liquidity Management: With significant revolving availability—approximately $1.4 billion under ABL Facility—and no major debt maturities before 2028 beyond finance leases WillScot retains flexibility managing leverage profile amid volatile external conditions.[F1][S6][S19]
ROE metrics currently register negative approximately -6% reflecting net loss impact contrasting with solid equity base implying near-term pressure prior to normalization if restructuring benefits manifest fully.[F1]
Key Financial Metrics Summary Table:
| Metric | FY2025 | FY2024 |
|---|---|---|
| Revenue ($MM) | 2,281 | 2,396 |
| Operating Income ($M) | 181 | 264 |
| Net Income ($M) | -53 | +28 |
| Operating CF ($M) | 762 | 562 |
| Capex ($M) | 24 | 18 |
| Dividends Paid ($M) | 51 | - |
| Share Repurchases ($M) | 97 | - |
| Adjusted EBITDA ($M) | 971 | 1,063 |
| Avg Units On Rent Drop (%) | -11.3% | - |
| Modular Avg Rent Inc (%) | +4.9% | - |
| Portable Storage Rent Inc (%) | +7.5% | - |
| Restructuring Costs ($M) | 302 | - |
| All figures sourced from latest company filings dated February 19,2026 unless otherwise noted ([F1],[S1]-[S29]). |
What To Watch Next: Forward Indicators And Milestones (Analysis)
While explicit guidance remains unavailable publicly,[N1] several metrics warrant close monitoring for insights into trajectory:
- Trends in average monthly units on rent especially within modular vs portable portfolios can indicate demand recovery or deterioration;
- Price realization progress relative to inflation/cost input increases tracking VAPS attach rates influencing blended yields;
- Development updates on Network Optimization Plan implementation milestones including real estate exits completion timings around targeted periods extending into late decade;
- Credit quality indicators such as days sales outstanding and provision versus write-off trends signaling effectiveness of receivable management improvements;
- Market activity levels within core end sectors notably any uptick linked to infrastructure stimulus packages or reshoring mandates aiding space demand;
- Integration success from acquisitions expanding climate-controlled inventory impacting margin profiles positively;
- Operating leverage dynamics especially SG&A control amidst sales force investment balancing volume ramps could alter profitability measures meaningfully;
- Capital deployment pace balancing organic fleet expansions versus opportunistic acquisitions conserving liquidity position.
Sector Context (Analysis)
The modular space industry heavily leans on macroeconomic cycles particularly construction & industrial spending patterns constrained recently by tightening monetary policies affecting project starts and lending availability —a critical factor explaining volume reductions at WillScot seen throughout recent reporting periods. Moreover, unit economics rely materially on equipment utilization rates given large fixed depreciation components where idle fleet burdens depress margins leading companies like WillScot toward structural optimization plans reducing footprint while ensuring nimble service networks.
Climate control capability development reflects rising demand stemming from sectors requiring sensitive goods handling—logistics evolving rapidly post-pandemic favors operators who can provide flexible turnkey space solutions expanded beyond basic office/classroom pods into integrated smart systems including solar power integration aligning with ESG preferences increasingly influencing client choices.
Conclusion
WillScot Holdings Corp faces a challenging but manageable phase marked by structural realignment through its Network Optimization Plan amidst broader macro pressures softening core leasing volume despite successful pricing management efforts supported further by expanding VAPS penetration bolstered via technology-driven customer experience initiatives. Though FY2025 produced headline net losses influenced heavily by non-cash restructuring accounting impacts the healthy operating cash flows underpin future investment capacity allowing continued targeted acquisitions complementing organic growth strategies while sustaining shareholder return programs through dividends and buybacks. Navigating trade policy changes alongside fluctuating sectoral demand will test operational agility but WillScot’s scale-enabled logistics network breadth paired with diversified industry exposure provide resilience buffers shielding recurring revenue predictability essential for medium-term recovery potential. Investors should watch key operational metrics evidencing lease portfolio stabilization alongside execution discipline unfolding around network footprint rationalization efforts defining whether earnings recovery ensues beyond ongoing headwinds shaping current financial outcomes.
This report is prepared solely for informational purposes based on publicly available data without offering investment advice or recommendations regarding WillScot Holdings Corp securities or transactions.
Disclaimer: This is research-only, informational analysis and not investment advice. It may include AI-generated interpretation and general industry context. Always verify important details using primary sources.
Comments