
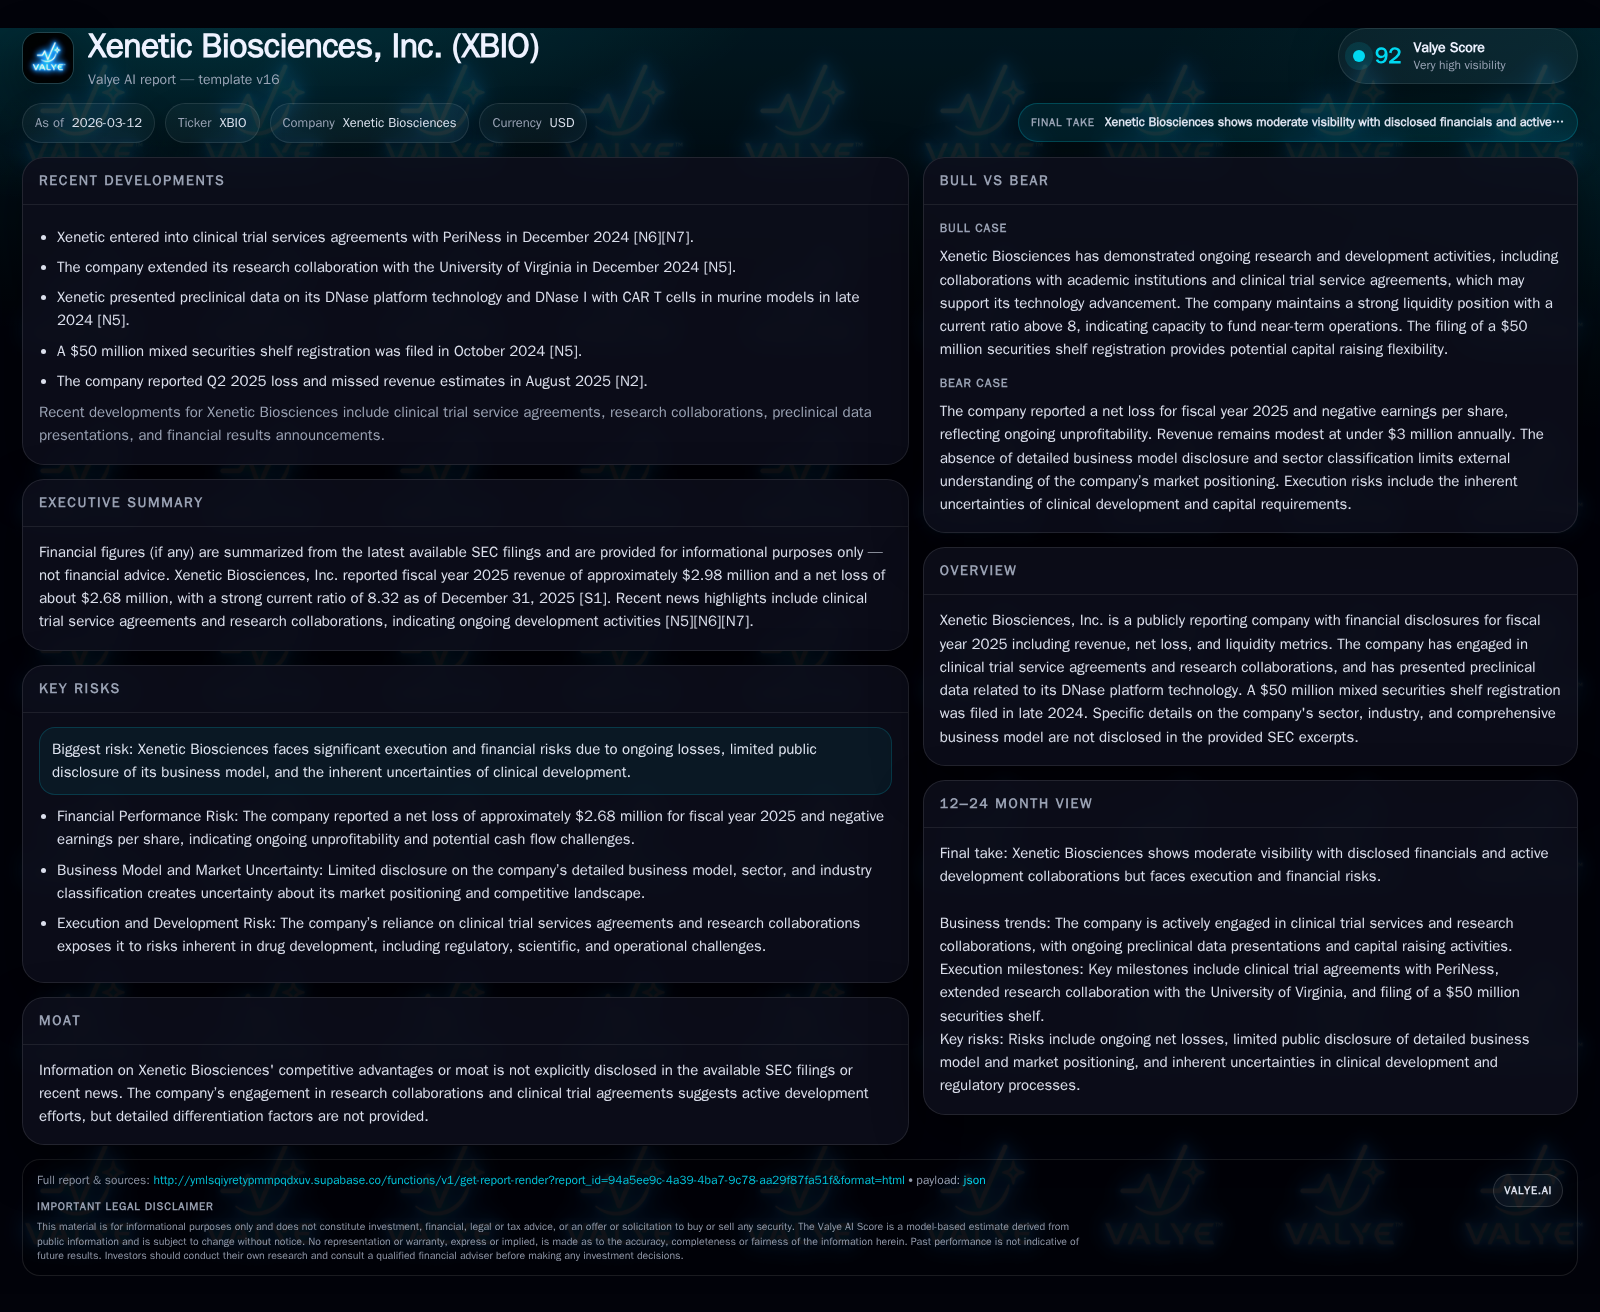
Xenetic Biosciences: Progress and Pragmatism in Clinical Innovation and Capital Management
Xenetic Biosciences shows incremental revenue growth through clinical collaborations while managing capital cautiously amid persistent losses.
Xenetic Biosciences, focused on advancing its DNase platform technology through clinical trial agreements and research collaborations, reported a 19% revenue increase in fiscal 2025 alongside a meaningful reduction in operating losses. The company executed a $50 million mixed securities shelf registration in late 2024 to bolster liquidity, supporting ongoing R&D activities despite negative cash flows. Risks remain elevated with ongoing net losses, limited disclosure of sector specifics, and regulatory uncertainties. Capital allocation reflects reinvestment in pipeline advancement, with no dividends or buybacks as ROE remains negative.
Revenue Growth Drivers and Operational Performance Trends
Xenetic Biosciences' fiscal year 2025 results indicate incremental top-line expansion driven primarily by its clinical activities. Revenue increased to approximately $3.0 million in FY2025 from $2.5 million in FY2024, representing a solid 19% growth rate [F1]. This uptick likely correlates with clinical trial service agreements and research collaborations engaged by the company as part of its effort to advance its DNase technology platform. Despite often volatile revenue trajectories typical of biotech firms early in development cycles, this steady rise suggests that Xenetic is gradually expanding its operational footprint.
On the cost side, the company exhibited substantial progress in narrowing operating losses; the operating deficit decreased to about $2.8 million in FY2025 from $4.2 million the prior year—an improvement exceeding 30% year-over-year [F1]. Similarly, net loss contracted by roughly the same proportion, reaching just under $2.7 million [F1]. Operating cash flow deficits also shrank nearly 19%, now negative $2.3 million annually, reflecting better cash burn management without compromising research intensity [F1]. These operational metrics suggest enhanced expense control and possibly optimization of clinical spend as Xenetic balances growth ambitions with financial prudence.
Clinical Pipeline Focus: The DNase Platform and Collaborations
Central to Xenetic’s innovation efforts is its work on an enzymatic DNase technology platform aimed at addressing unmet clinical needs. While detailed drug candidates or industry classifications are undisclosed publicly [S1], the company has actively progressed DNase-related preclinical data presentations and engaged various partners through clinical trial service agreements and research collaborations [S1], [S3], [S9].
These partnerships are notable for their dual role: enabling incremental pipeline development while distributing financial risk and resource demands typically borne solely by emerging biotechs. The strategy mirrors broader sector trends where early-stage companies leverage alliances for validation and milestone-based funding prior to costly late-stage trials—allowing Xenetic a pragmatic approach given limited internal resources.
The focus on enzymatic therapeutic platforms aligns with expanding interest in targeted biologics capable of modulating extracellular DNA implicated in disease pathologies—a niche but increasingly recognized scientific frontier within precision medicine research.
Financial Health: Capital Structure, Liquidity, and Funding Activities
Xenetic’s balance sheet reflects conservative liquidity management supportive of near-term R&D initiatives amid ongoing operational deficits. As of December 31, 2025, current assets stood at roughly $8.05 million against current liabilities near $968 thousand, yielding a notably strong current ratio of approximately 8.32x [F1]. This healthy short-term solvency metric safeguards operations during continued investment phases.
The company executed a significant capital raise via a mixed securities shelf registration totaling $50 million filed in late 2024 [S9]. A portion of this authority was utilized for an underwritten public offering completed October 2024 that generated net proceeds near $3.9 million after underwriting fees [S9]. Funds were earmarked primarily for working capital requirements and advancing DNase technology endeavors.
Recent filings confirm adherence to customary underwriting restrictions including short-term trading limitations post-offering [S22]. Such measured funding efforts illustrate Xenetic's deliberate calibration to preserve shareholder value while sustaining adequate operational runway.
Risks and Regulatory Environment Shaping Execution Uncertainty
The company faces elevated risks consistent with early-stage biotechnological ventures compounded by company-unique factors such as limited sectoral disclosure and active litigation exposures documented in multiple SEC filings [S4], [S5], [S6], [S8], [S10].
Clinical development inherently carries uncertainties about efficacy outcomes, regulatory approvals, and market acceptance which could delay pipeline commercialization or require additional capital infusions.
Regulatory compliance complexities add timelines and costs; Xenetic must navigate FDA or comparable authorities’ expectations without explicit public guidance on regulatory milestones achieved or pending.
Moreover, litigation standing remains a material risk factor as per quarterly risk disclosures spanning several periods across the last twelve months suggesting potential legal challenges that may strain management attention or finances [S4], [S6], [S10].
Assessing Future Growth Catalysts and Development Constraints
While Xenetic has not issued explicit quantitative forward guidance regarding top-line targets or milestone timings post-FY2025, analysis of recent capital raises suggests an adaptive growth trajectory contingent upon successful execution of pipeline advancement plans [S3].
Key catalysts include reaching pivotal DNase platform development milestones enabled by funding from shelf registrations allowing continuation of preclinical studies and clinical partnerships.
Constraints remain considerable: persistent operating losses limit free cash flow generation requiring external financing; competitive pressures within biotech therapeutics sectors; potential delays tied to regulatory processes; and uncertainties tied to intellectual property rights or commercial adoption pathways.
Tracking future investor communications around product trial data releases or partnership expansions will provide directional clarity but until then projections remain necessarily guarded.
Capital Allocation Strategy and Investor Returns Dynamics
Xenetic currently operates under a reinvestment model typical for clinical-stage biotechs still prioritizing pipeline development over profitability. The company reported an approximate return on equity (ROE) of negative 36.2% based on FY25 net loss relative to shareholder equity [F1]. This negative profitability metric reflects intensive R&D expenditures amid an absence of commercial revenues beyond collaboration-derived income streams.
Operating cash flow margins remain negative at about -$2.3 million annually indicating ongoing cash outflows even after improved cost efficiencies are realized [F1]. No dividends have been declared nor has there been any share repurchase activity reported recently demonstrating a clear preference toward deploying capital into sustaining innovation pipelines rather than returning capital to shareholders at this stage [S17], [S18].
This allocation approach aligns with typical sector norms where value accretion arises predominantly from delivery of successful product candidates or favorable licensing deals rather than dividend yield.
Key Metrics Summary: Historical Financial Snapshot
Historical performance (annual)
| FY | Rev ($mm) | Net ($mm) | CFO ($mm) | OpInc ($mm) | Rev YoY | Net YoY |
|---|---|---|---|---|---|---|
| 2025 | 3 | -3 | -2 | -3 | +19.0% | +32.3% |
| 2024 | 3 | -4 | -3 | -4 | -1.6% | +4.2% |
| 2023 | 3 | -4 | -4 | -5 | +48.8% | +36.9% |
| 2022 | 2 | -7 | -5 | -7 |
Source: SEC companyfacts cache [F1].
Capital returns and efficiency (annual)
| FY | ROE% |
|---|---|
| 2025 | -36.2 |
| 2024 | -65.9 |
| 2023 | -42.2 |
| 2022 | -48.0 |
Source: SEC companyfacts cache [F1].
Table summarizes Xenetic’s annual figures evidencing both revenue traction driven by collaborative initiatives and significant contraction in losses through disciplined expense management.
Disclaimer
This report is prepared solely for informational purposes based on publicly available SEC filings and does not constitute investment advice or recommendations regarding any securities mentioned herein.
Disclaimer: This is research-only, informational analysis and not investment advice. It may include AI-generated interpretation and general industry context. Always verify important details using primary sources.
Comments