
Pearson’s 2025 Performance: Balancing AI-Driven Innovation with Margin Pressures
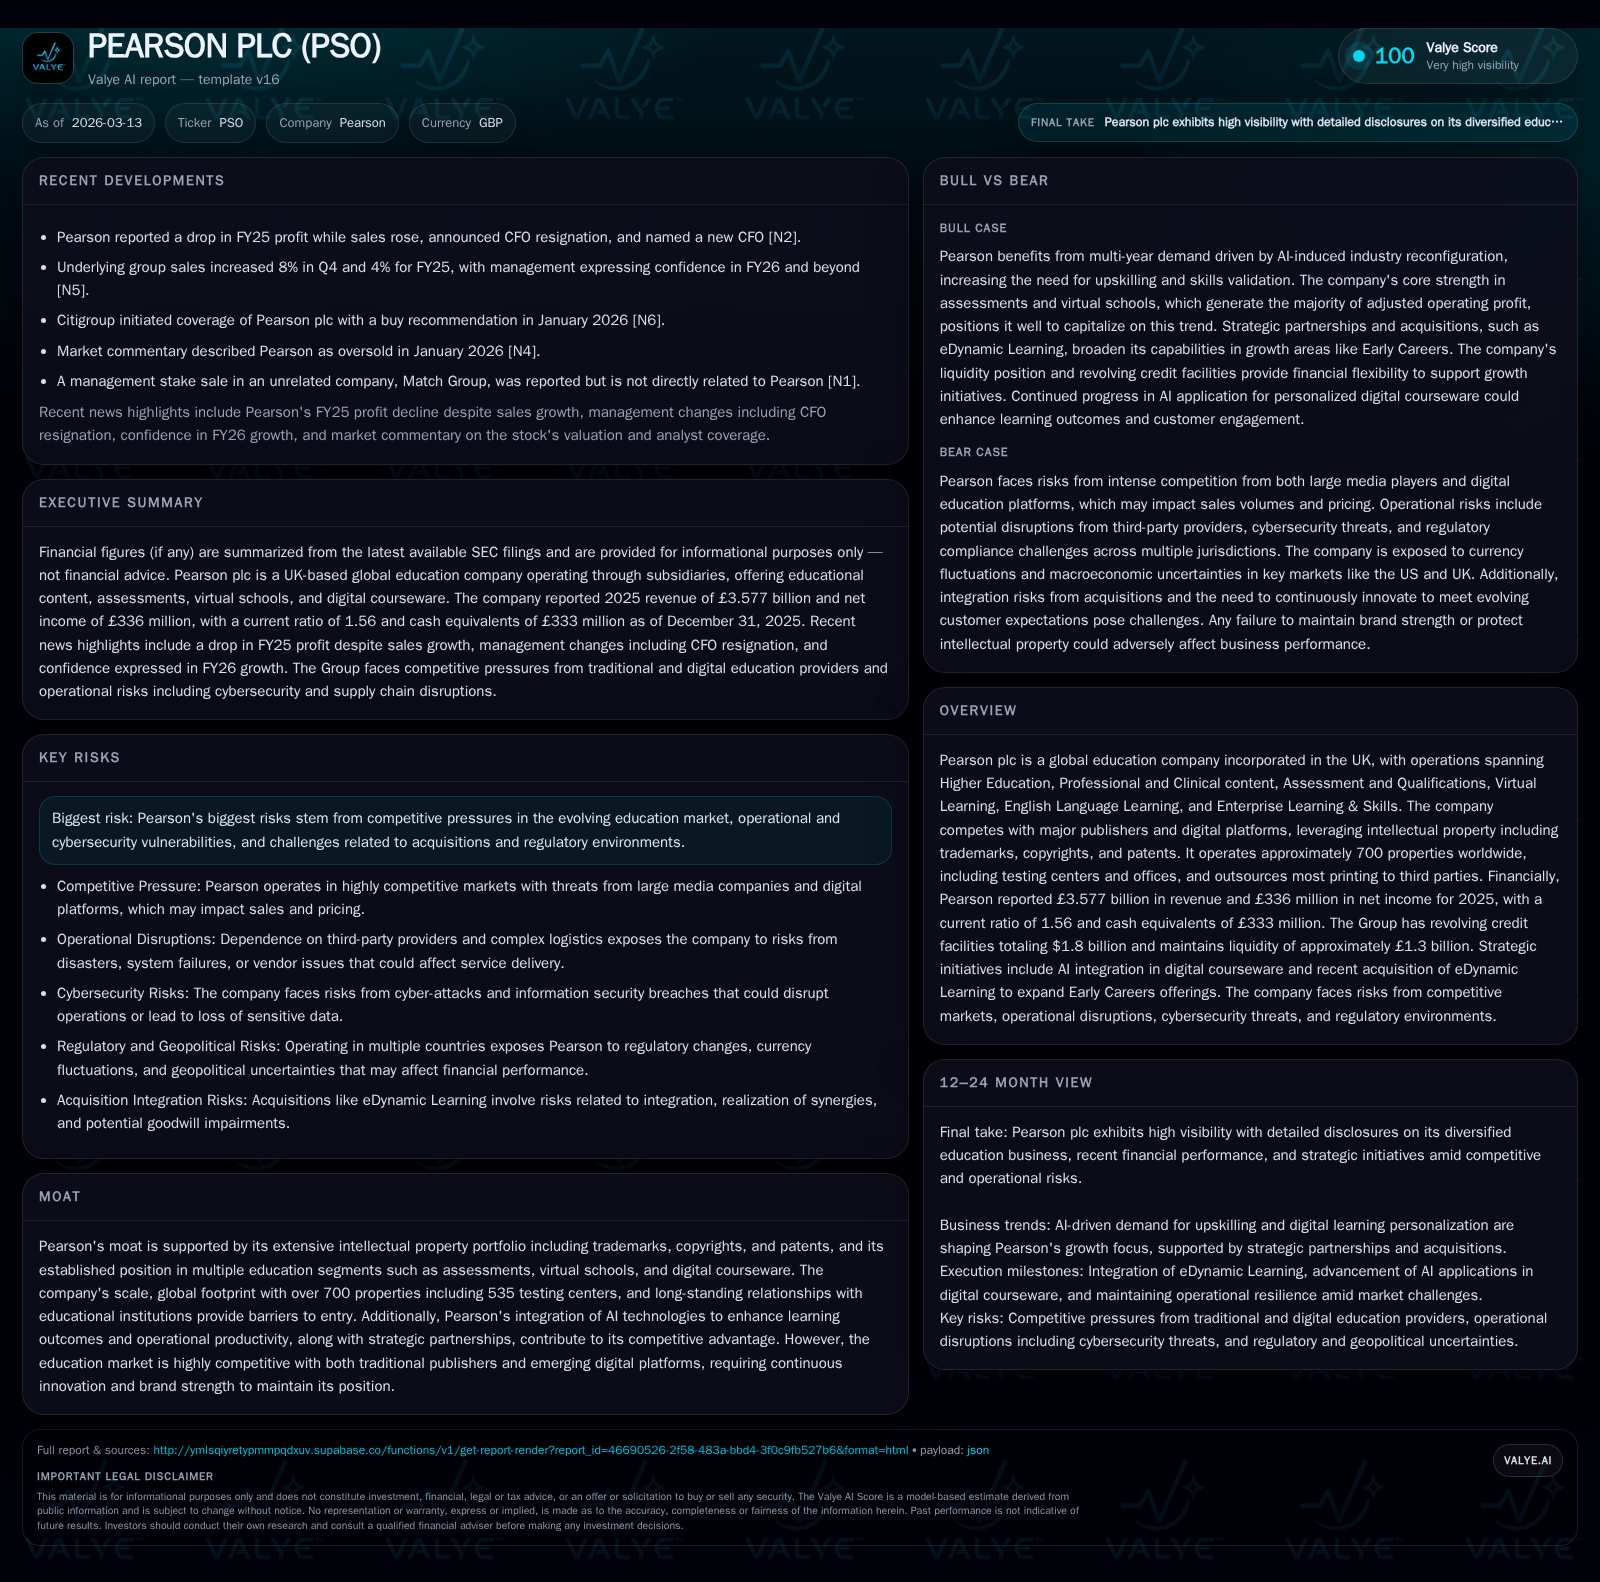
Pearson reported minimal revenue growth alongside a notable net income decline in 2025 while advancing digital and AI-based educational products amid strong capital returns.
In 2025, Pearson plc’s revenue edged up by 0.7% to £3.577 billion, yet net income decreased by 22.8% to £336 million, reflecting margin pressures despite rising adjusted operating profits. The company continues blending its traditional publishing strengths with an expanding digital courseware platform integrated with AI capabilities to sustain relevance in highly competitive education markets. Aggressive share buybacks and steady dividends highlight Pearson’s focus on shareholder returns amid evolving operational challenges. Market dynamics, including adoption cycles and regulatory compliance, will shape Pearson's medium-term growth trajectory.
Historical Financial Performance and Growth Dynamics
Pearson PLC’s financial performance over the past four years reveals a pattern of slowing top-line growth combined with fluctuations in profitability metrics. In calendar year 2025, total revenue reached approximately £3.577 billion, marking a slight increase of 0.7% compared to the prior year (£3.552 billion) [F1][S3]. This subdued top-line momentum contrasts with previous years where revenues peaked near £3.841 billion in 2022 before declining through 2024.
Despite this modest sales lift, net income fell sharply by 22.8%, dropping from £435 million in 2024 to £336 million in 2025 [F1]. The divergence between adjusted operating profit—which rose by around 6% to £614 million—and net income suggests increased costs or financial charges negatively affected bottom-line profitability during the period [S3]. Dividend payments remained stable at roughly £160 million annually, indicating consistent commitment to shareholder distributions even amid earnings volatility [F1].
Historical performance (annual)
| FY | Rev ($bn) | Net ($mm) | Rev YoY | Net YoY |
|---|---|---|---|---|
| 2025 | 3.6 | 336 | +0.7% | -22.8% |
| 2024 | 3.6 | 435 | -3.3% | +14.5% |
| 2023 | 3.7 | 380 | -4.3% | +55.7% |
| 2022 | 3.8 | 244 |
Source: SEC companyfacts cache [F1].
Capital returns and efficiency (annual)
| FY | Div ($mm) | ROE% |
|---|---|---|
| 2025 | 160 | 9.2 |
| 2024 | 156 | 10.7 |
| 2023 | 155 | 9.5 |
| 2022 | 157 | 5.5 |
Source: SEC companyfacts cache [F1].
Note: Operating Cash Flow (CFO) and Free Cash Flow (FCF) for prior years are not fully disclosed; adjusted operating profit available for FY25 only.
This pattern reflects shifts within market demand dynamics as well as internal operational changes, underscoring pressures on margin preservation despite steady revenues.
Market Positioning and Innovation: Digital Courseware and AI Integration
Pearson operates across Higher Education, Professional & Clinical content, Virtual Learning, Assessment & Qualifications, English Language Learning, and Enterprise Learning & Skills supported by an extensive portfolio of intellectual property including copyrights, patents, and trademarks [S1][S8]. The company’s moat stems largely from this broad IP base combined with global scale—operating more than seven hundred properties worldwide including over five hundred testing centres—and entrenched relationships with educational institutions.
Pearson is investing heavily in incorporating artificial intelligence into its digital courseware offerings—a move aimed at enhancing personalised learning experiences as well as optimising operational productivity [N2][S1]. This integration facilitates adaptive content delivery within platform lifecycle management strategies that aim to reduce attrition during adoption cycles typical of Higher Education programmes.
Given that Higher Education content usually follows a product refresh cycle of up to five years—with preceding development phases often lasting more than a year—Pearson’s digital transformation efforts are calibrated to align product innovation closely with customer renewal behaviours [S1]. This approach intends to mitigate competitive threats posed by emerging digital platforms providing alternative content access modes.
Combining traditional publishing with digital courseware enhanced by AI positions Pearson strategically against both legacy competitors and digital disruptors vying for market share through alternative business models and pricing strategies.
Recent Financial Results and Year-Over-Year Drivers
During fiscal year ending December 31, 2025, Pearson reported underlying group sales growth of approximately 4%, driven primarily by increased penetration of its digital content offerings along with renewed contracts in assessment services [S3]. Adjusted operating profit rose by about 6%, signalling successful cost control measures or margin improvements within core segments.
Nonetheless, the headline net income contracted by nearly one-quarter compared to the previous year due primarily to elevated investments supporting the AI integration roadmap alongside potential non-recurring expenditures related to acquisitions or financing costs [F1][S3]. Operational cash flow was reported at £731 million but showed a decline compared to previous periods driven by working capital timing differences and capital expenditure increases on software platforms [S7][S15]. Free cash flow improved slightly year over year reaching £527 million on the back of tax receipts partially offsetting these outflows.
Price competition from both traditional publishers digitising their catalogues and nimble tech-enabled education providers applying platform commoditisation tactics intensifies margin pressure despite revenue expansion efforts.
Outlook and Growth Constraints in Education Markets
Looking ahead into FY26 and beyond, Pearson has communicated expectations for mid-single digit sales growth grounded on continued uptake of its digital education platforms supplemented by pipeline renewals across Higher Education and Professional segments [N2][S1]. However, growth ceilings remain due to persistent competition from established publishers adopting new technologies as well as agile startups focused on niche curricula or modularised learning experiences.
Additional headwinds arise from regulatory environments which increasingly scrutinise assessment validation protocols, privacy protections especially surrounding biometric data collection for identity verification during examinations, plus evolving international data protection legislation requiring compliance adaptations potentially increasing cost bases [S16][S18]. Geographic expansion opportunities exist but face challenges owing to fluctuating public funding for education post-pandemic amid macroeconomic uncertainties impacting institutional budgets.
Pearson must also contend with institutional hesitancy related to rapid technological change—particularly slower adoption rhythms observed among some academic clients wary of extensive platform migrations—reinforcing the importance of alignment between technology refresh cycles and user readiness.
Capital Allocation Strategy: Dividends, Buybacks, and Liquidity Management
In parallel with strategic investments into innovation platforms, Pearson continues disciplined capital allocation practices focused on returning value to shareholders via regular dividends alongside aggressive share repurchase programmes. In February 2025 the Board approved a significant £350 million share buyback initiative executed throughout the year—consistently purchasing almost 32 million shares at an aggregate cost around £352 million—demonstrating confidence despite earnings headwinds [S4][S12][F1].
Dividend payments have remained largely stable around £160 million annually since at least FY22 highlighting priority placed on maintaining predictable income streams for investors even through uneven profit cycles [F1][S11].
Liquidity remains robust with cash equivalents reported at £333 million year-end coupled with undrawn revolving credit facilities totaling $1.8 billion maturing not before mid-to-late decade but extendable under options until circa 2030 providing ample funding runway [F1][S7][S15]. The increase in net debt from approximately £853 million at end-2024 to about £1.069 billion at end-2025 reflects shareholder returns combined with acquisition activity balanced against free cash flow generation.
Overall free cash flow conversion remains healthy enabling concurrent funding of growth investments without compromising shareholder distributions.
Competitive Environment and Risk Factors Impacting Future Profits
Pearson operates within intensely competitive education markets featuring legacy publishers adapting digitally alongside nimble competitors leveraging cloud-native delivery methods targeting lower-cost alternatives for institutions globally [S8]. These dynamics exert pricing pressure threatening traditional margin structures.
Operational risks include significant cybersecurity threats due to vast personal data holdings across employees, learners, educators and customers worldwide alongside complex dependencies on outsourced IT infrastructure providers for platform stability—failures could cause reputational harm or regulatory penalties [S19].
Regulatory risks are heightened around areas such as biometric data collection compliance for assessments, anti-bribery statutes enforcement across jurisdictions (including US Foreign Corrupt Practices Act compliance), antitrust scrutiny potential given market position as well as emerging data protection laws often inconsistently applied across turf boundaries necessitating costly system adaptations or legal exposures if mismanaged [S16][S18][S21][S22].
Brand strength maintenance remains paramount given dependence upon trusted relationships within governmental education frameworks; any service disruptions linked to late or erroneously delivered certification results could trigger contract losses or fines impacting financial returns adversely.
Key Metrics to Monitor: Earnings, Cash Flow, and Market Developments
Stakeholders should closely monitor Pearson’s adjusted earnings per share progression given divergent trends between operating profit improvements yet falling reported net income amid investment phases noted recently [N2][F1][S3]. Operating cash flow resilience amid ongoing digital platform capex outlays will signal balance sheet health during this transition.
Liquidity ratios such as current ratio near historical norm (circa 1.56) alongside revolving credit availability support assessment of short-to-medium term funding capacity relevant for acquisitions or unexpected contingencies [F1][S7]. Leadership changes including CFO turnover warrant attention regarding impact on financial strategy execution during an important stage for delivering AI-enhanced offerings broadly across customer segments.
Development milestones related to AI adoption effectiveness measuring learner engagement uplift or client retention rates will offer insight into sustaining long-term relevance amidst evolving educational technology landscapes even though explicit forward guidance beyond sales growth targets has not been extensively issued publicly yet.
Disclaimer: This is research-only, informational analysis and not investment advice. It may include AI-generated interpretation and general industry context. Always verify important details using primary sources.
Comments