
Yalla Group Strengthens Capital Return Strategy with $150 Million Share Repurchase Amid Solid Earnings
March 2026 filings reveal a renewed $150 million share repurchase authorization reinforcing confidence in Yalla's stable social networking and gaming revenue streams.
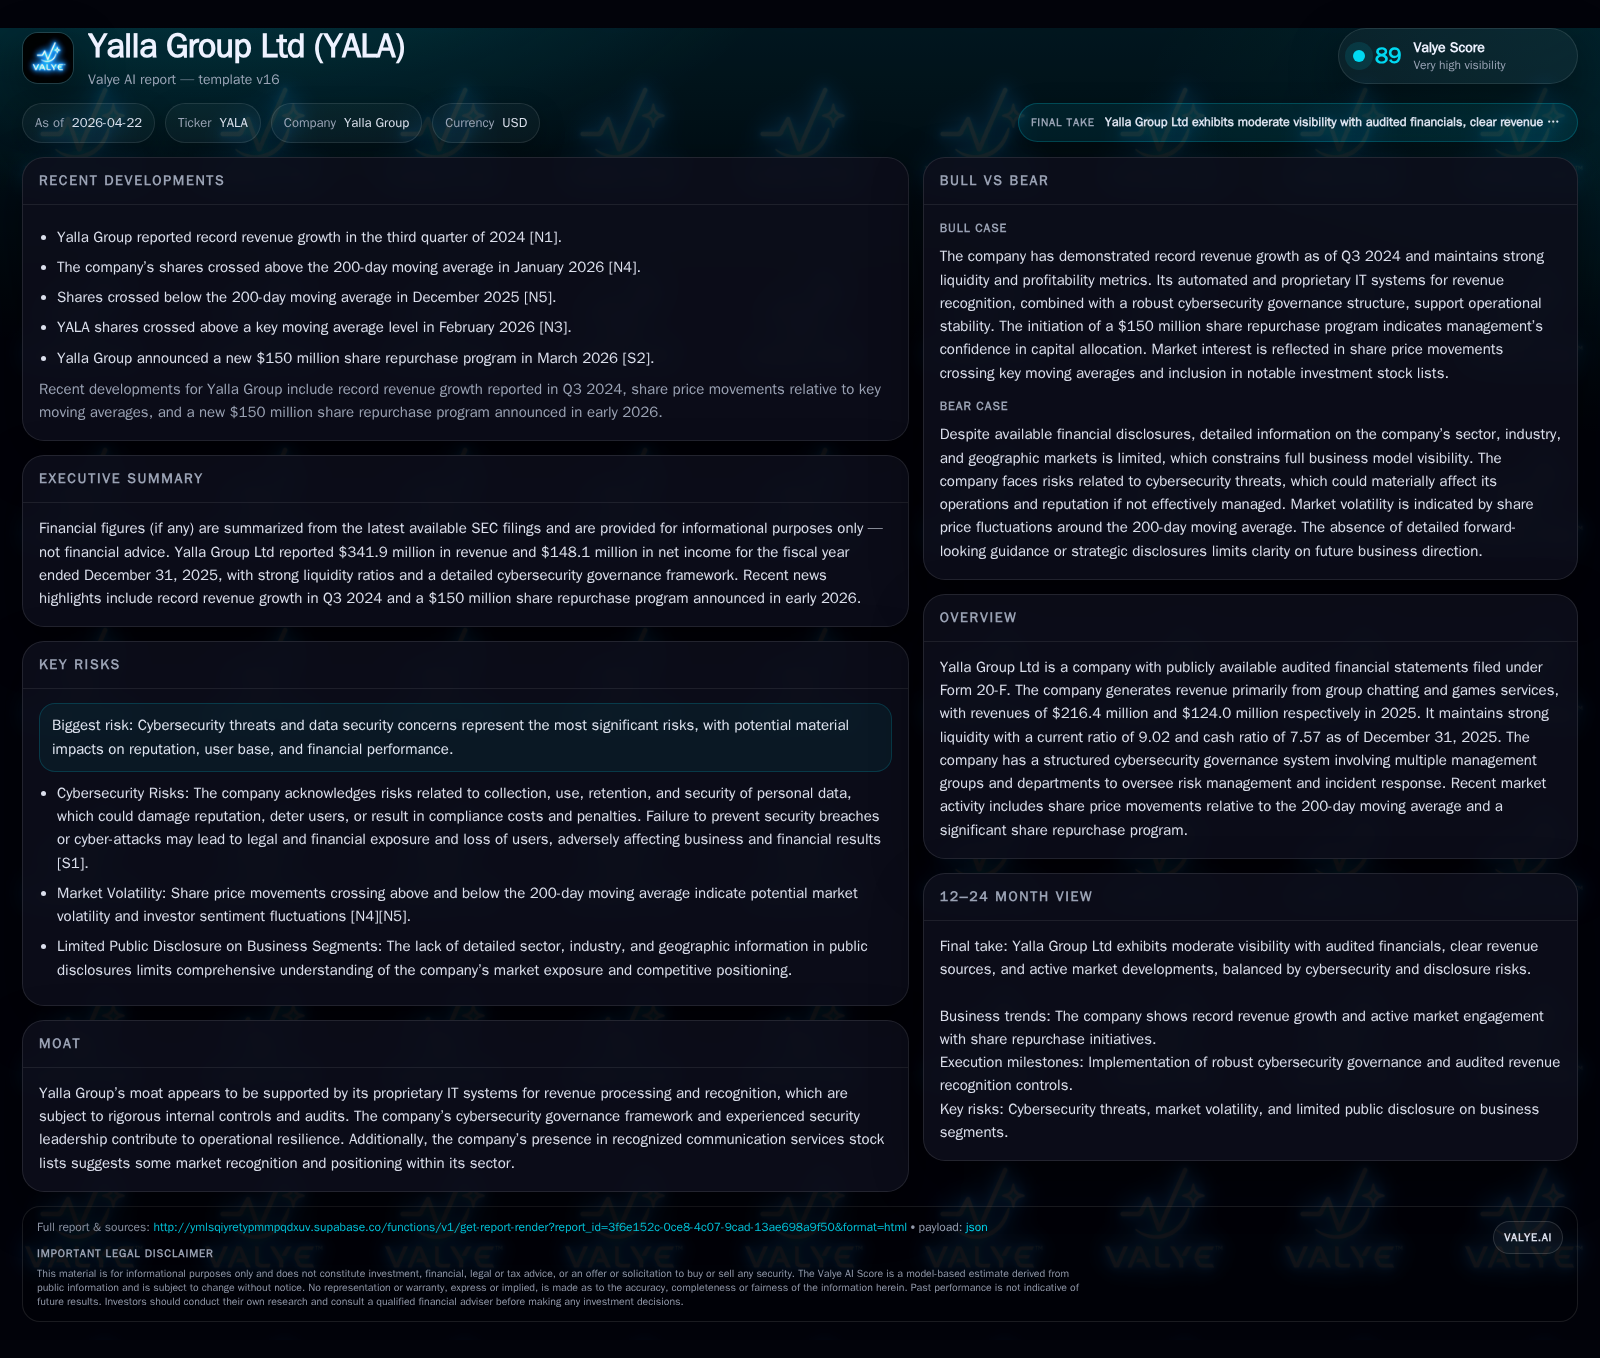
Yalla Group Limited recently announced a new $150 million share repurchase program extending its disciplined capital allocation approach. This move follows a solid Q4 and full-year 2025 performance, characterized by modest revenue growth and strong net income gains driven by core group chatting and gaming services. The company’s proprietary platform benefits from effective cybersecurity governance, contributing to user trust in a competitive digital social networking landscape focused on freemium access enhanced by virtual goods monetization. Financially, Yalla maintains robust liquidity with a current ratio exceeding 9x and continues to deploy excess cashflow toward shareholder returns. Going forward, key execution risks include sustaining user engagement and managing cyber risk amid evolving regulatory scrutiny.
Latest Quarterly Update Signals Enhanced Capital Discipline
On March 10, 2026, Yalla Group Limited filed two Form 6-K exhibits announcing a new share repurchase program authorizing up to US$150 million worth of ADS buybacks over the subsequent 24 months [S2][S3][S5]. This marks an extension of prior buyback initiatives dating back to May 2021 which have cumulatively seen approximately US$106 million deployed to repurchase about 15.68 million ADS shares under cost method treasury stock accounting [S4][S9]. The renewed program reflects management’s sustained confidence in Yalla’s operational cash flows and overall financial health during modest revenue growth but solid profitability metrics.
Additionally, Yalla reported unaudited Q4 and full-year 2025 results confirming stable top-line trends alongside robust net income expansion detailed further in the annual Form 20-F filed April 22, 2026 [S3][S1]. The continuity of capital allocation policy toward shares signals a strategic preference for enhancing shareholder value via direct equity returns over alternative deployment such as dividends or aggressive M&A.
Revenue Drivers: Core Chatting and Gaming Platforms Define Business Model
Yalla’s business model centers on its online social networking and gaming platform accessed primarily through mobile apps targeting individual users in the Middle East and North Africa (MENA) region [S1][S28]. Basic functionality including group chatting is offered free as a freemium service designed to maximize user base size and stickiness. Monetization largely derives from sale of virtual items—cosmetic goods or functional upgrades purchasable within chat groups—and recurring upgrade services enhancing user experience.
Gaming services constitute the second major revenue pillar involving proprietary online games integrated into the platform ecosystem [S28]. Together, group chatting generated $216.4 million while gaming accounted for $124.0 million during FY2025 representing around two-thirds and one-third of total revenues respectively [F1]. This product mix underscores balanced dependency on communication features supplemented by entertainment content.
Virtual goods monetization supported by proprietary IT systems ensures precise revenue recognition controlled under rigorous internal audits providing both financial integrity and scalability advantages [S1]. The continuous investment in technology staff enhances product innovation cycles critical for maintaining relevance with increasingly discerning users.
Competitive Positioning Within Digital Social Networking and Entertainment
Operating as a unified segment without further product line segmentation, Yalla leverages scale benefits conferred by its proprietary backend infrastructures which handle large volumes of real-time voice chat sessions alongside game interactions [S7]. This integration facilitates seamless user experience driving higher retention compared to isolated chat or gaming platforms prevalent in fragmented markets.
The company’s principal market remains MENA with minor assets distributed globally including UAE headquarters complemented by operations relevant to Mainland China, Hong Kong SAR, Saudi Arabia, Singapore, Cayman Islands—all jurisdictions supporting infrastructure or investment presence [S7]. Lack of real-name registration requirement lowers barriers for user onboarding but also obscures granular geographic revenue breakdowns.
Pricing power appears durable due to feature differentiation embedded in exclusive virtual items offering personalized social currency within groups—a phenomenon akin to micro-economies common among leading Asian social platforms but less saturated in MENA thus creating structural advantages . However, competition from global tech giants setting foot into regional markets combined with nascent local regulations around digital content pose challenges.
Cybersecurity Governance: A Key Operational Moat
One distinguishable operational strength is Yalla’s structured cybersecurity governance designed to protect data integrity, prevent breaches, and sustain user confidence essential for recurring monetization [S1][S17]. The layered framework involves:
- Leadership Group headed by CEO overseeing risk assessment and remediation strategy;
- Execution Group tasked with incident classification according to system impact severity alongside defined response timelines;
- Specialized security department providing technical implementation, employee training, and policy enforcement;
- Regular reporting mechanisms funneling significant incidents directly to board audit committee ensuring transparency.
This robust setup mitigates risks related to unauthorized access or data leakage that could otherwise severely damage reputation or prompt regulatory penalties particularly given sensitivities around voice communication data in MENA jurisdictions [S10].
Growth Catalysts Versus Industry Challenges
Driving growth remains contingent on expanding active user engagement within existing service offerings while exploring incremental avenues such as enhanced virtual item portfolios or geographic penetration [S1][N1]. The steady increase in digital social interaction across younger demographics in MENA positions Yalla favorably amidst rising internet penetration trends.
Nonetheless, the industry faces cyclical headwinds tied to macroeconomic conditions affecting discretionary spending on entertainment plus evolving compliance requirements around data privacy that may inflate operational costs or constrain platform features [S10]. Cybersecurity threats remain ever-present risks requiring ongoing vigilance.
Strategically balancing innovation pace with regulatory responsiveness will be crucial as adoption curves mature.
Forward-Looking Monitoring: Milestones, Execution, and Market Indicators
Key monitoring points include tracking quarterly engagement metrics—such as daily active users (DAUs) or average revenue per user (ARPU)—to validate sustainable monetization momentum post-fiscal 2025 [S2][N2]. Management commentary around execution of the new share repurchase will serve as an indicator of confidence amid market valuation pressures evidenced by recent oversold trading territory reports [N2].
Capital allocation remains a focal area; effective deployment of the $150 million repurchase program could positively influence per-share earnings metrics if executed opportunistically during valuation troughs.
Risks that warrant attention involve potential disruptive cyber incidents or adverse changes in regional regulatory frameworks that might constrain service availability or increase compliance costs materially.
Financial Highlights: Operational Efficiency Backing Strategic Initiatives
Fiscal year-end December 31, 2025 financials corroborate operational stability underpinning strategic decisions:
- Revenue: $341.9 million (+0.7% YoY) demonstrating plateau after steady growth from $318.9M in 2023 [F1]
- Operating Income: $122.2 million (+0.7% YoY), reflecting effective cost control even as product development expenses rose moderately [F1]
- Net Income: $148.1 million (+10.4% YoY), showcasing profitability improvements partly driven by non-operating income elements like interest gains [F1]
- Liquidity: Cash & equivalents measured $526.97 million yielding an exceptionally healthy current ratio of ~9.02x providing ample cushion for operational needs plus buyback execution [F1][S8]
- Capital Returns: Total ADS repurchases reached ~$56.6 million (cost method accounting applied) indicating consistent capital returned since prior programs inception; new authorization doubles buyback capacity signaling aggressive capital discipline [F1][S5][S6]
- Free Cash Flow: Estimated >$135 million supporting self-funded growth investments alongside shareholder remuneration [F1]
Margins remain robust amidst measured increases in selling/marketing expenditures mainly targeted at sustaining top-of-funnel acquisition effectiveness within competitive marketing environments.
Historical performance (annual)
| FY | Rev ($mm) | Net ($mm) | CFO ($mm) | OpInc ($mm) | Rev YoY | Net YoY |
|---|---|---|---|---|---|---|
| 2025 | 342 | 148 | 138 | 122 | +0.7% | +10.4% |
| 2024 | 340 | 134 | 173 | 121 | +6.5% | +18.7% |
| 2023 | 319 | 113 | 139 | 96 | +5.0% | +43.0% |
| 2022 | 304 | 79 | 120 | 79 |
Source: SEC companyfacts cache [F1].
Capital returns and efficiency (annual)
| FY | Buybacks ($mm) | FCF ($mm) | ROE% |
|---|---|---|---|
| 2025 | 57 | 136 | 18.3 |
| 2024 | 14 | 172 | 19.0 |
| 2023 | 9 | 138 | 19.9 |
| 2022 | 2 | 118 | 17.9 |
Source: SEC companyfacts cache [F1].
This solid financial footing affords both flexibility for strategic initiatives including R&D spend increases (~180% capex rise year-over-year) and continued shareholder value maximization through buybacks.
Disclaimer: This analysis is based solely on publicly available SEC filings up to April 22, 2026, associated news excerpts, and validated financial data without generating any investment advice or recommendations.
Disclaimer: This is research-only, informational analysis and not investment advice. It may include AI-generated interpretation and general industry context. Always verify important details using primary sources.
Comments