
York Water Co Advances Growth Amid Regulatory and Climate Factors
York Water Co’s Q1 2026 results underscore regulatory-driven revenue gains, customer expansion, and capital raise to support infrastructure amid weather-dependent demand.
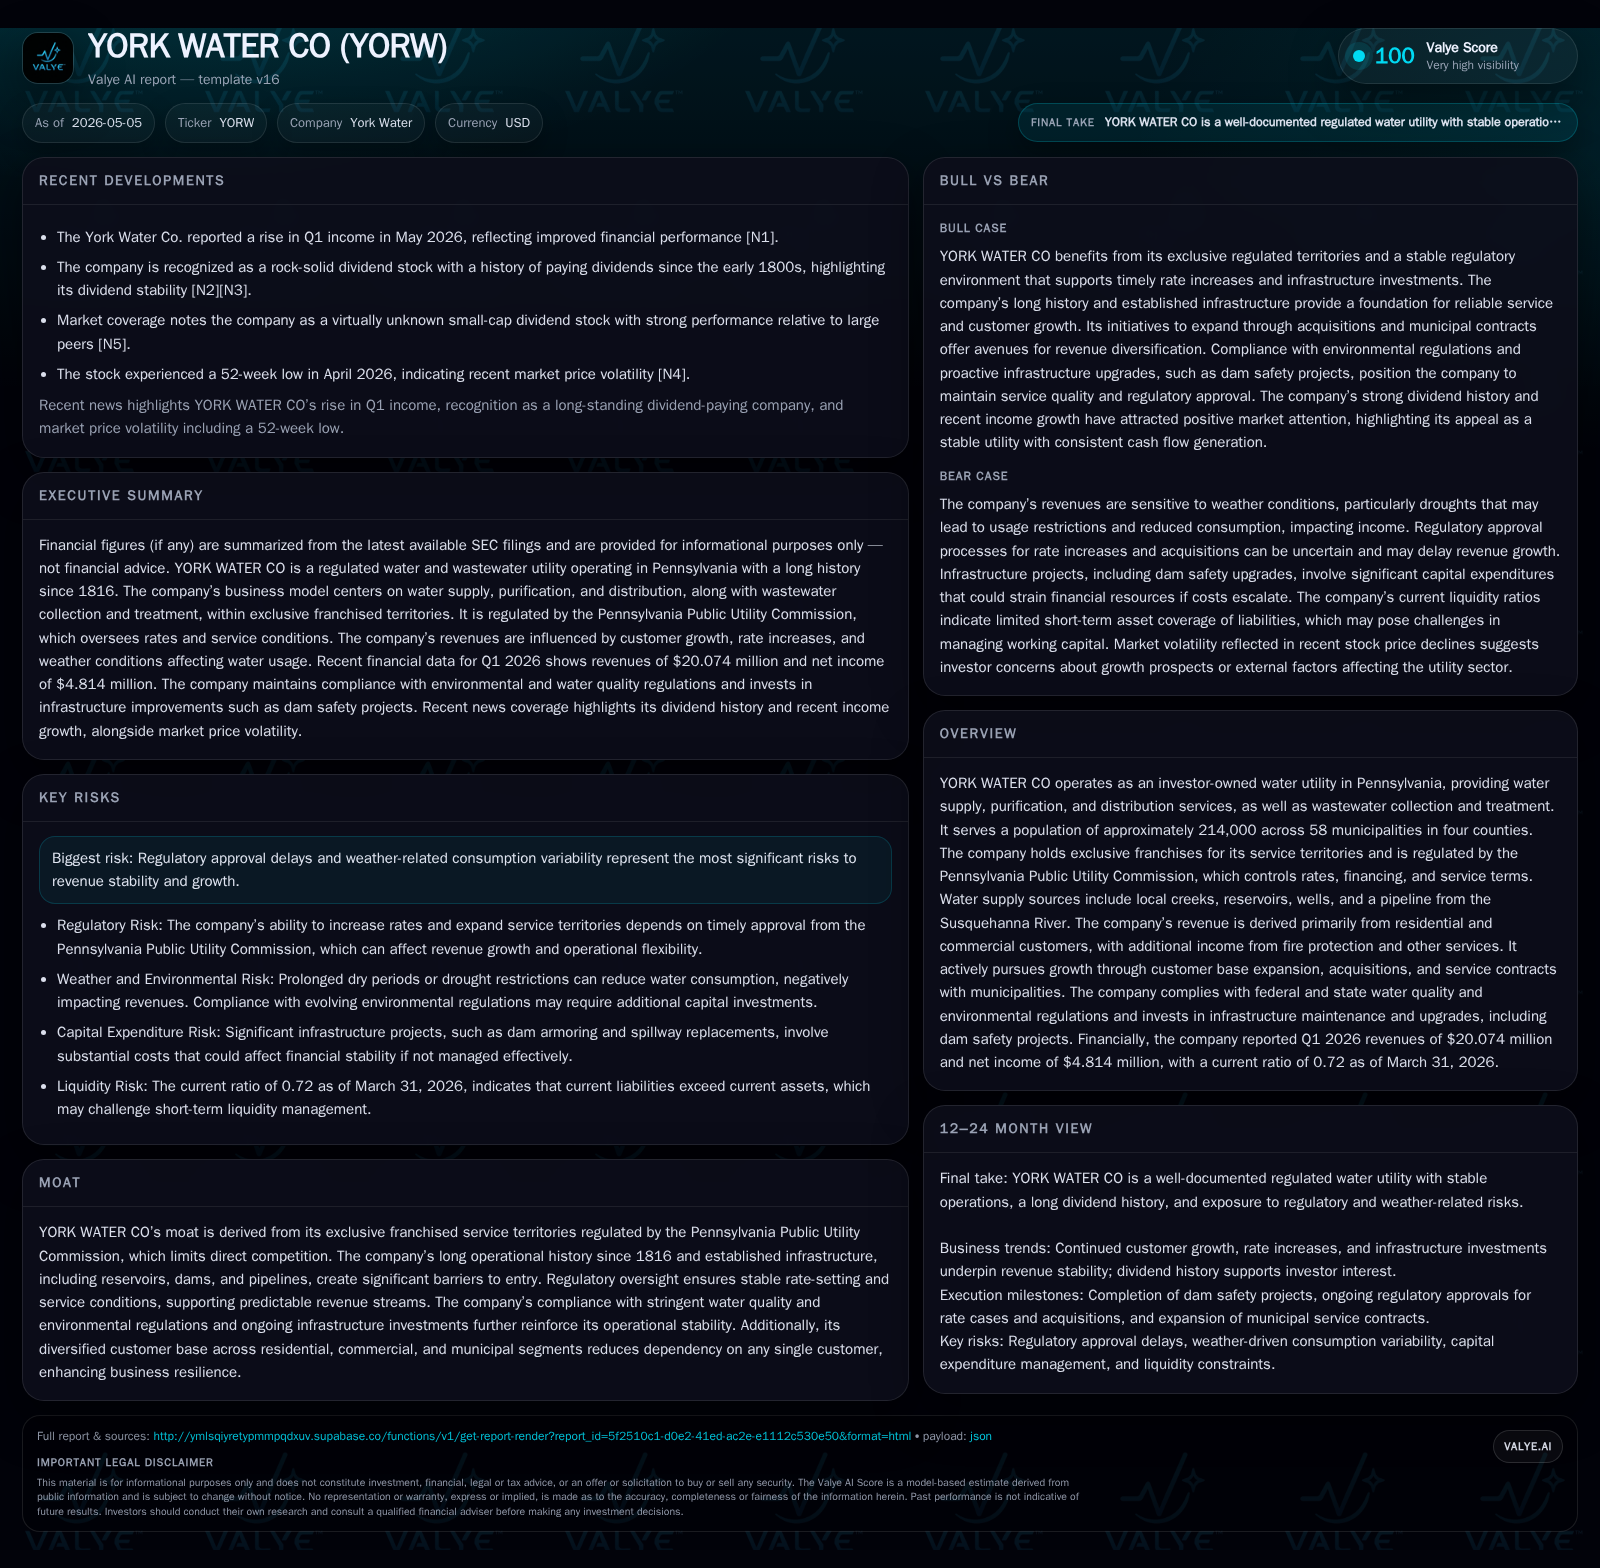
In its latest quarterly filing ending March 31, 2026, York Water Co reported an 8.8% increase in operating revenues driven primarily by a PPUC-approved rate hike effective March 1, 2026, coupled with growth in both water and wastewater customer bases through organic expansion and recent acquisitions [S2][S21]. The company closed an underwritten equity offering in April 2026 raising net proceeds of $47.7 million to repay short-term borrowings and finance capital projects [S2][S3]. York Water maintains a regulated franchise model over a sizeable Pennsylvania territory with diversified water sources including reservoirs fed by the Codorus Creek and a Susquehanna River pipeline, supporting stable supply but subject to weather variability [S1]. Growth drivers center on regulatory rate approvals, incremental volume from customer additions, acquisitions, and seasonal demand fluctuations tied to weather patterns. Key risks remain regulatory timing, consumption variability during drought or wet conditions, and escalating infrastructure investment needs [S1][S2]. The company continues to invest selectively while maintaining strong credit metrics upheld by an A- rating from S&P [S2].
Latest Q1 2026 Operating Update – Rate Increases and Customer Growth
York Water Company’s first quarter ended March 31, 2026 reflected strong operational momentum anchored by a timely rate increase sanctioned by the Pennsylvania Public Utility Commission effective March 1, 2026. Operating revenues increased by $1.618 million or approximately 8.8% over the prior year period to $20.074 million. This uplift was primarily due to the new rates combined with expanded service coverage: notably the average number of water customers rose by nearly one thousand to over 74,000 while wastewater customers increased by more than six hundred largely attributable to recent acquisitions integrating additional wastewater systems into the company’s network [S2][S21].
Despite per capita water consumption declining slightly (~2.2%), total volume grew enough through customer additions and favorable summer demand forecasts for management to expect continued revenue growth through the remainder of the year. A notable feature involved the resetting of the Distribution System Improvement Charge (DSIC) back to zero as this surcharge expired concurrent with the rate order taking effect; while this reduced short-term DSIC-related income ($107k decline relative to prior year), this was offset by underlying base rate enhancements [S21].
Parallelly, York Water successfully completed an equity offering in April 2026 issuing approximately 1.75 million shares at $28.50 per share generating net proceeds near $47.7 million after fees and commissions. These funds were directed initially towards repaying short-term borrowings on revolving credit lines previously used for capital expenditures and acquisitions, thereby improving near-term liquidity profile ahead of planned operational spending [S2][S3]. This proactive capital management aligns with anticipated ongoing infrastructure investments.
Business Model and Product Quality – Exclusive Franchises in Regulated Territories
Since its founding in 1816, York Water has operated as an investor-owned water utility within exclusive franchised territories governed strictly by the Pennsylvania Public Utility Commission (PPUC). This franchise framework grants it near-monopoly-like status within defined service areas covering parts of four counties spanning approximately 58 municipalities serving about 214,000 residents as of end-2025 [S1]. The PPUC regulates key facets including tariffs, financing structures, debt issuance limits, service terms and quality standards — effectively constraining competition while ensuring stable allowable returns on invested capital.
Operationally, York Water controls significant infrastructure assets including pipelines, two major reservoirs (Lake Williams & Lake Redman) which aggregate roughly 2.5 billion gallons capacity on its primary system fed primarily by South and East branches of Codorus Creek. To buttress supply resilience given seasonal fluctuations and extended dry periods typical in Pennsylvania summers, the company installed a strategically important fifteen-mile pipeline drawing up to twelve million gallons daily from Susquehanna River waters into Lake Redman reservoir.
Supplementary systems also include Roxbury Dam on Conodoguinet Creek servicing Franklin County customers alongside fifteen groundwater wells yielding close to one million gallons daily that feed satellite networks across multiple counties [S1]. These diversified sources underpin both quantity reliability and maintain high purity consistent with federal Safe Drinking Water standards.
The nature of water utilities emphasizes long-life physical infrastructure coupled with stringent environmental compliance requirements—factors that embed high barriers to entry reinforcing York Water’s operational moat beyond mere regulatory protection.
Industry Structure – Competitive Moat Supported by Regulation and Infrastructure
Pennsylvania’s utility sector structure under PPUC oversight entrenches York Water’s competitive advantage via legally granted exclusive service territories devoid of direct contest for retail customers. Rate-making procedures involve formal filings supported by historically transparent cost data enabling fair tariff-setting that balances consumer protection with reasonable ROI for providers like York Water.
Demand patterns retain some seasonality connected principally to summer irrigation needs where hotter drier intervals tend to push consumption upward but can conversely trigger neccessitated drought restrictions issued by governmental bodies limiting overall use—imparting volume variability risk mitigated partially through growing customer base expansion strategies [S1][S2].
Working capital demands are structurally low for such utilities since billing cycles predominate monthly or quarterly collections from residential/commercial accounts minimizing receivables exposure & cash conversion periods.[S2] Interest rate swap arrangements effectively manage exposure on floating-rate debt instruments converting portions into fixed obligations smoothing expense trends reflected as regulatory assets/liabilities recoverable via tariffs over time rather than immediate earnings volatility hitting financial statements directly.[S2]
Growth Drivers – Expansion Through Regulation, Acquisitions, and Increased Usage
York Water pursues growth through well-known vectors: obtaining timely regulatory approval for rate increases allowing permitted returns on expanded investment; methodically expanding customer footprint both organically via new housing developments within current franchise territories plus acquisitions of adjacent small water/wastewater systems pending regulatory clearances; pursuing municipal bulk contracts; and leveraging modest volume upticks linked closely with summer weather-induced watering demand spikes particularly during hot dry years [S1][S2][S12].
Recent acquisitions such as Pine Run Retirement Community wastewater system added several hundred customers immediately contributing incremental revenue streams.[S18] Management signals ongoing pursuit of additional affordable bolt-on deals combined with expanding billing services offered under contract arrangements diversifying revenue beyond pure consumption charges into service-based fees.[S21]
While per-capita consumption declined modestly in early 2026 partly due to conservation awareness or milder conditions against last year benchmarks, increasing population density within served areas counteracts this somewhat preserving overall volume trajectory.[S21]
Risks and Constraints – Regulatory Timing, Weather Dependence, and Infrastructure Costs
Delayed or unfavorable decisions from the PPUC regarding requested rate changes represent material uncertainties affecting near- to intermediate-term revenue growth tempo since pricing shifts require explicit approvals before recognition.[S1][S19] Impacts can manifest as postponed cost recovery particularly when capex programs escalate requiring timely tariff adjustments.
Consumption exhibits exposed volatility tied directly to weather/climate dynamics: persistent drought conditions heighten risk of enforced consumption curtailments depressing volumes whereas prolonged wet/humid summers might reduce discretionary outdoor water use lowering billable demand unpredictably.[S1]
The company faces significant capital expenditure demands related both to routine aging infrastructure replacement routines—evidenced by DSIC filings facilitating accelerated recovery of qualified investments—and upgrades necessary for regulatory compliance or digital system enhancements.[S12] Funding these without excessive leveraging poses gradual balancing act alongside shareholder expectations given sizable utility asset bases typically demanding multiyear capex cycles.
What to Watch Next – Regulatory Filings, Consumption Trends, Capex Execution
Critical near-term milestones include PPUC approval timelines for pending acquisitions such as Lenwood Management’s water assets anticipated late Q4 2026 adding around 90 customers and Mt Rock Manor assets likely contributing further roughly140 new customers subsequently.[S12]
Monitoring summer seasonal precipitation patterns offers leading indicators on usage spikes essential for validating volume assumptions underpinning full year guidance.[S21]
Execution progress against planned ~$38 million capex budget excluding acquisitions during remainder of FY2026 emphasizing main extensions plus IT upgrades will gauge management effectiveness managing both growth opportunities and renewal obligations sustainably.[S12]
Additional scrutiny on regulatory docket for proposed future rate change petitions or DSIC reset filings will provide directional clarity regarding longer-range margin trajectory.[S19]
Financial Profile – Capital Structure, Liquidity, and Recent Equity Offering
Latest financial snapshot
| Metric | Value | Period |
|---|---|---|
| Cash & equivalents | $1000 | |
| 2026-03-31 | ||
| Total debt | $230mm | |
| 2026-03-31 | ||
| Net debt | $230mm | |
| 2026-03-31 | ||
| Current assets | $18mm | |
| 2026-03-31 | ||
| Current liabilities | $26mm | |
| 2026-03-31 | ||
| Current ratio | 0.72x | |
| 2026-03-31 |
Source: SEC companyfacts cache [F1].
As of March 31, 2026 balance sheet metrics reflect total debt approximating $229.7 million largely composed of long-dated senior notes maturing between 2029–2054 supplemented recently drawn committed line of credit balances roughly $37.4 million—a substantial portion repaid subsequent to quarter end following the April common stock offering.[F1][S2][S29]
Cash balances remain nominal ($1k), consistent with highly integrated cash management practices where available excess automatically reduces outstanding borrowings minimizing interest expense costs given historically low working capital requirements intrinsic to regulated utilities.[F1][S4]
The Company benefits from a solid investment grade credit rating affirmed at A- with stable outlook from Standard & Poor's as recently as July 30, 2025 supporting continued access at reasonable terms across debt markets vital for funding ongoing infrastructure costs.[S2]
Accounting treatment employs regulatory asset/liability recognition for unrealized interest rate swap gains/losses rather than hedge accounting smoothing earnings impact over forecasted tariff recovery periods helping stabilize reported interest expenses across fluctuating market rates.[S2]
| Metric | Value (USD thousands) | As of |
|---|---|---|
| Cash & Equivalents | 1 | |
| 2026-03-31 | ||
| Total Debt | 229,771 | |
| 2026-03-31 | ||
| Current Assets | 18,465 | |
| 2026-03-31 | ||
| Current Liabilities | 25,639 | |
| 2026-03-31 | ||
| Net Debt (Debt - Cash) | 229,770 | |
| 2026-03-31 | ||
| Current Ratio | 0.72 | |
| 2026-03-31 |
Disclaimer: This analysis is based solely on publicly available SEC filings dated through May 5, 2026 along with validated companyfacts data as cited. It does not constitute investment advice or recommendations.
Disclaimer: This is research-only, informational analysis and not investment advice. It may include AI-generated interpretation and general industry context. Always verify important details using primary sources.
Comments