
American Assets Trust in 2026: Leasing Power, Redevelopment Stakes, and the Economics of High-Barrier Real Estate
American Assets Trust’s Q3 2026 results highlight robust leasing dynamics in prime West Coast and Hawaiian markets, with rising rental rates and strong retail occupancy. The company’s focus on development and redevelopment, alongside disciplined capital recycling, shapes the forward economics—but execution risks and regulatory costs remain central to the long-term value equation.
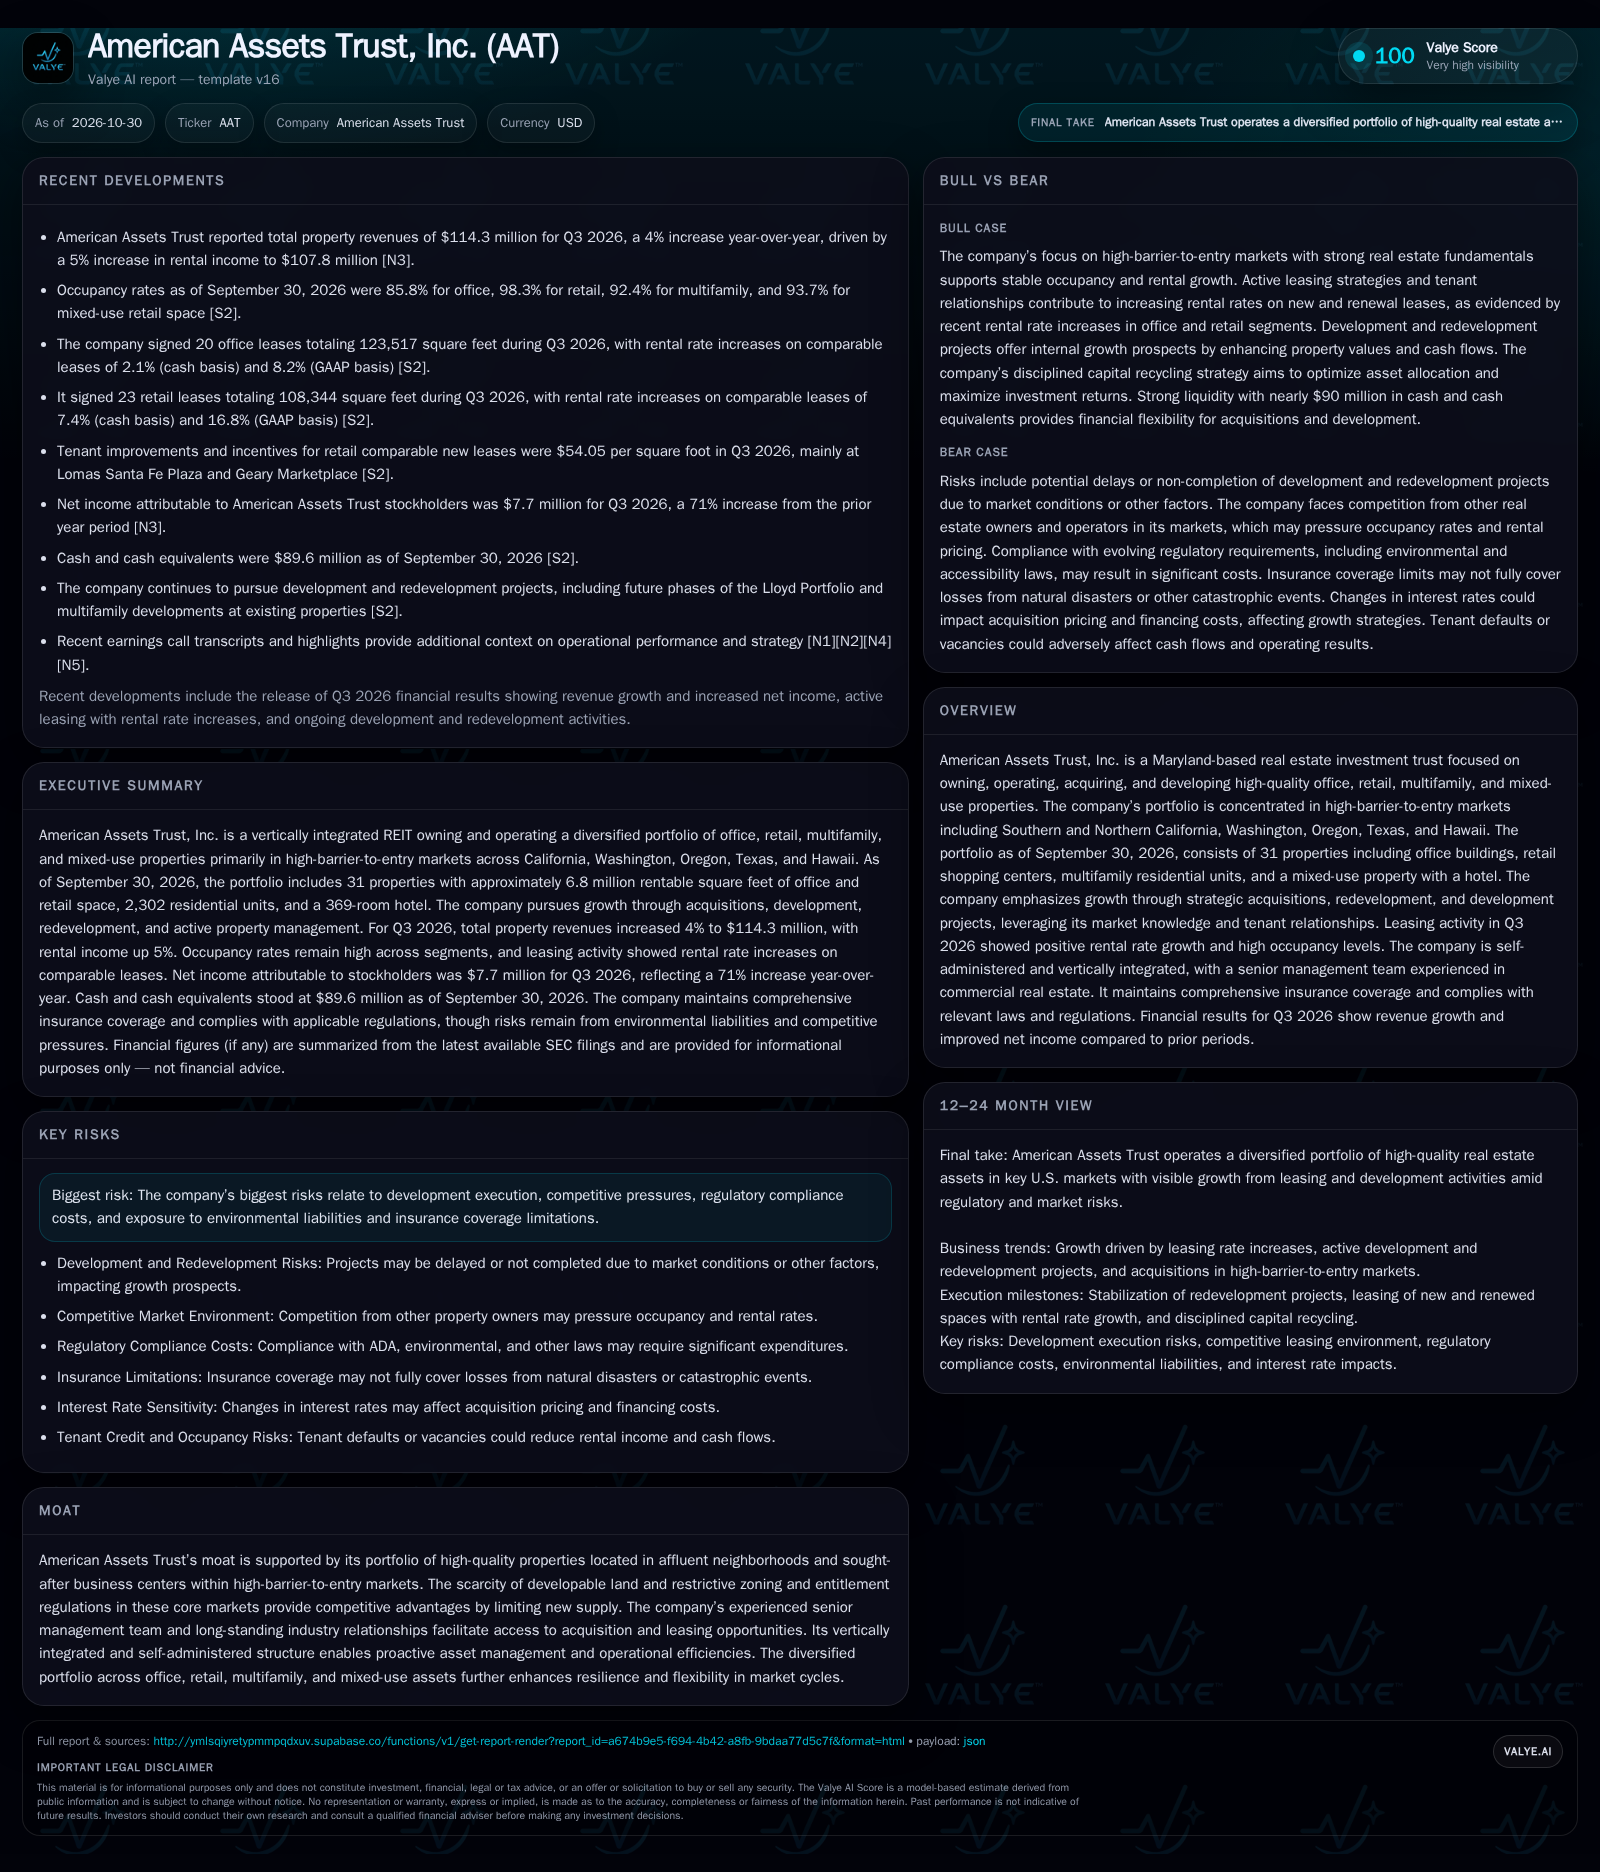
American Assets Trust reported a 4% revenue increase and 71% higher net income in Q3 2026, driven by rising rents and strong occupancy across its diversified portfolio. Leasing momentum and targeted redevelopment underpin growth prospects, while execution, compliance costs, and market competition present ongoing challenges. The company’s strategy in high-barrier markets leverages scarcity and tenant relationships, but future value will hinge on successful project delivery and maintaining occupancy in shifting demand environments. [S2] [N3]
American Assets Trust, Inc. (AAT) enters late 2026 with tangible leasing momentum, as evidenced by rising rental rates and high occupancy across its West Coast and Hawaiian portfolio. The company’s vertically integrated REIT model and strategic positioning in high-barrier, supply-constrained markets enable it to capture above-market rents, particularly in retail and multifamily. However, with much of its future growth tied to redevelopment and new development projects, value creation will be determined by execution discipline, ability to maintain or increase occupancy, and the navigation of regulatory and competitive forces. The company’s latest results provide a snapshot of operating leverage potential, but also illuminate the stakes of project delivery and tenant stability in a shifting real estate landscape. [S2] [N3]
Leasing Growth and Portfolio Performance Define Q3 2026
American Assets Trust reported total property revenues of $114.3 million for Q3 2026, representing a 4% increase from the prior year. Rental income climbed 5% to $107.8 million, and net income attributable to stockholders surged 71% to $7.7 million over the same period. [S2] [N3]
Leasing activity was robust: the company signed 20 office leases covering 123,517 square feet and 23 retail leases for 108,344 square feet, both at rental rates above expiring leases (office: +2.1% cash, +8.2% GAAP; retail: +7.4% cash, +16.8% GAAP). [S2]
Occupancy rates as of September 30, 2026, remained high in retail (98.3%) and multifamily (92.4%), with office at 85.8%, reflecting sectoral dynamics in demand. [S2]
Tenant improvement and incentive costs for new retail leases averaged $54.05 per square foot, signaling continued investment in attracting and retaining tenants at key properties. [S2]
How High-Barrier Markets Shape Cash Flows and Value Creation
American Assets Trust’s core economics are anchored in collecting rental income from a diversified base of office, retail, multifamily, and mixed-use assets, with a heavy geographic skew toward supply-constrained West Coast and Hawaiian metros. In these markets, scarcity of new supply and affluent demographics support premium rental rates and relatively stable occupancy—particularly for well-located retail and multifamily assets.
Revenue growth is driven by a combination of rental rate increases on lease rollovers, occupancy gains, and value-enhancing redevelopment or development projects. The company’s ability to negotiate rental rate escalations—especially evident in recent retail lease spreads—suggests some pricing power, though this may be tempered by tenant incentives and capital outlays (e.g., $54.05/sqft for retail improvements in Q3 2026). [S2]
Operating leverage arises as fixed property costs (taxes, insurance, maintenance) are spread across growing revenues. However, variable costs—such as tenant improvements, leasing commissions, and compliance expenditures—can offset margin expansion, particularly during periods of heavy leasing or property turnover.
Growth initiatives (acquisitions, redevelopment, ground-up development) are capital-intensive and typically funded through a mix of retained cash flow, mortgage debt, revolving credit, and, when needed, new equity or debt issuance. The company reported cash and liquidity metrics for the period; these figures do not by themselves establish operating runway, investment capacity, financial flexibility, or financing capacity. [S2]
Scarcity and Location as Competitive Shields—and Their Limits
AAT’s primary competitive advantage is its concentration in high-barrier-to-entry markets, where restrictive zoning, limited land availability, and lengthy entitlement processes limit new supply. This creates scarcity value for existing assets and supports both occupancy and rent levels, especially in favored submarkets like San Diego, the Bay Area, Bellevue, Portland, and Oahu.
The company’s portfolio diversity across office, retail, multifamily, and mixed-use assets provides some resilience to sector-specific shocks. Its vertically integrated, self-administered operating model enables direct control over leasing, property management, and redevelopment, potentially allowing faster response to tenant needs and market shifts.
However, AAT is not immune to competitive pressure. Other institutional owners, local developers, and large REITs operate in the same markets, competing for tenants and acquisition opportunities. In office, remote and hybrid work trends continue to challenge occupancy and rent growth, while retail faces ongoing e-commerce substitution and evolving tenant mix demands.
Regulatory burdens—including ADA and environmental compliance—can erode margins or slow project timelines, diluting some of the location-driven moat. Insurance limits and exposure to natural disasters (notably in California and Hawaii) also present structural risks.
When Redevelopment Pays Off: The Compounding of Leasing and Project Execution
The most favorable scenario for AAT involves successful stabilization and lease-up of its redevelopment and development pipeline—such as future phases of the Lloyd Portfolio and multifamily projects—at attractive rental rates. If leasing spreads on new and renewal leases remain positive, and occupancy is sustained or improved, the company could see outsized growth in net operating income and valuation multiples.
Upside would be further supported if tenant demand in office rebounds or if AAT is able to repurpose underutilized office space to higher-yielding uses (e.g., life sciences, medical office, or residential conversion), capturing market share from less nimble competitors.
Confirmation of this scenario would come through continued rental rate increases on comparable leases, occupancy gains in office, timely completion and lease-up of redevelopment assets, and evidence of margin expansion despite elevated tenant improvement spending. A sustained trend of positive leasing spreads and project deliveries ahead of budget would reinforce the thesis. [S2]
Portfolio Stability Anchored by Retail and Multifamily Strength, with Office Lagging
The most plausible outcome for AAT is steady, moderate growth anchored by strong retail and multifamily performance, with continued headwinds in office limiting upside. Rental rate increases and high occupancy in retail and apartments offset softer office demand, while redevelopment projects contribute incrementally but are subject to execution risk and market absorption.
The company maintains its capital recycling discipline, selectively disposing of mature assets to fund new investments and manage leverage. Regulatory compliance and insurance costs rise gradually but remain manageable.
Evidence supporting this scenario would be stable or modestly rising property revenues, continued positive lease spreads in retail and multifamily, and incremental progress on project deliveries. Office occupancy remains in the mid-80s percentile, with only modest improvement. Margin expansion is moderate due to ongoing tenant improvement outlays. [S2]
Project Delays, Office Weakness, and Regulatory Shocks Undermine Momentum
The adverse scenario centers on execution missteps in redevelopment and development, such as construction delays, cost overruns, or inability to lease up new space at projected rents. Office demand could weaken further if remote work adoption accelerates or if tenants consolidate footprints, driving occupancy and rental rates downward.
Unexpected regulatory changes (e.g., stricter environmental standards, increased property taxes, or new rent controls) could increase compliance costs or limit rent growth, while insurance shortfalls following natural disasters could lead to unplanned capital needs. Tenant defaults or major vacancies in large-format retail or office assets would further pressure cash flows.
Evidence for this downside would include declining or flat property revenues, negative leasing spreads, rising vacancy—especially in office—or repeated delays/disappointments in project delivery. Significant increases in tenant incentives without commensurate rent growth, or a marked uptick in regulatory and insurance expenses, would also validate this scenario. [S2]
Milestones and External Conditions That Will Shape AAT’s Value Trajectory
Sustained positive leasing spreads on new and renewal leases across office, retail, and multifamily segments—if disclosed.
Occupancy rate trends, particularly in the office segment; watch for stabilization or further erosion relative to peer benchmarks.
Timely and on-budget completion of redevelopment and development projects, with post-delivery lease-up velocity and achieved rental rates.
Magnitude and trend of tenant improvement and leasing incentive costs per square foot, especially for new retail and office leases.
Evidence of successful capital recycling, including asset dispositions and redeployments that enhance portfolio quality or reduce leverage.
Regulatory developments in core markets (e.g., changes in zoning, rent control, or environmental compliance costs) that could materially affect operating economics.
Insurance claims experience and any changes in coverage limits, deductibles, or exclusions following natural disasters or major loss events.
Any significant changes in debt funding costs or capital structure, particularly if new development is ramped up or if refinancing risk emerges.
Disclaimer: This is research-only, informational analysis and not investment advice. It may include AI-generated interpretation and general industry context. Always verify important details using primary sources.

Comments