
Asbury Automotive Group’s Growth Fueled by Herb Chambers Acquisition and Diversified Portfolio
Strong revenue growth in 2025 driven by strategic acquisition and expansion of service offerings amid margin pressures on new vehicle sales.
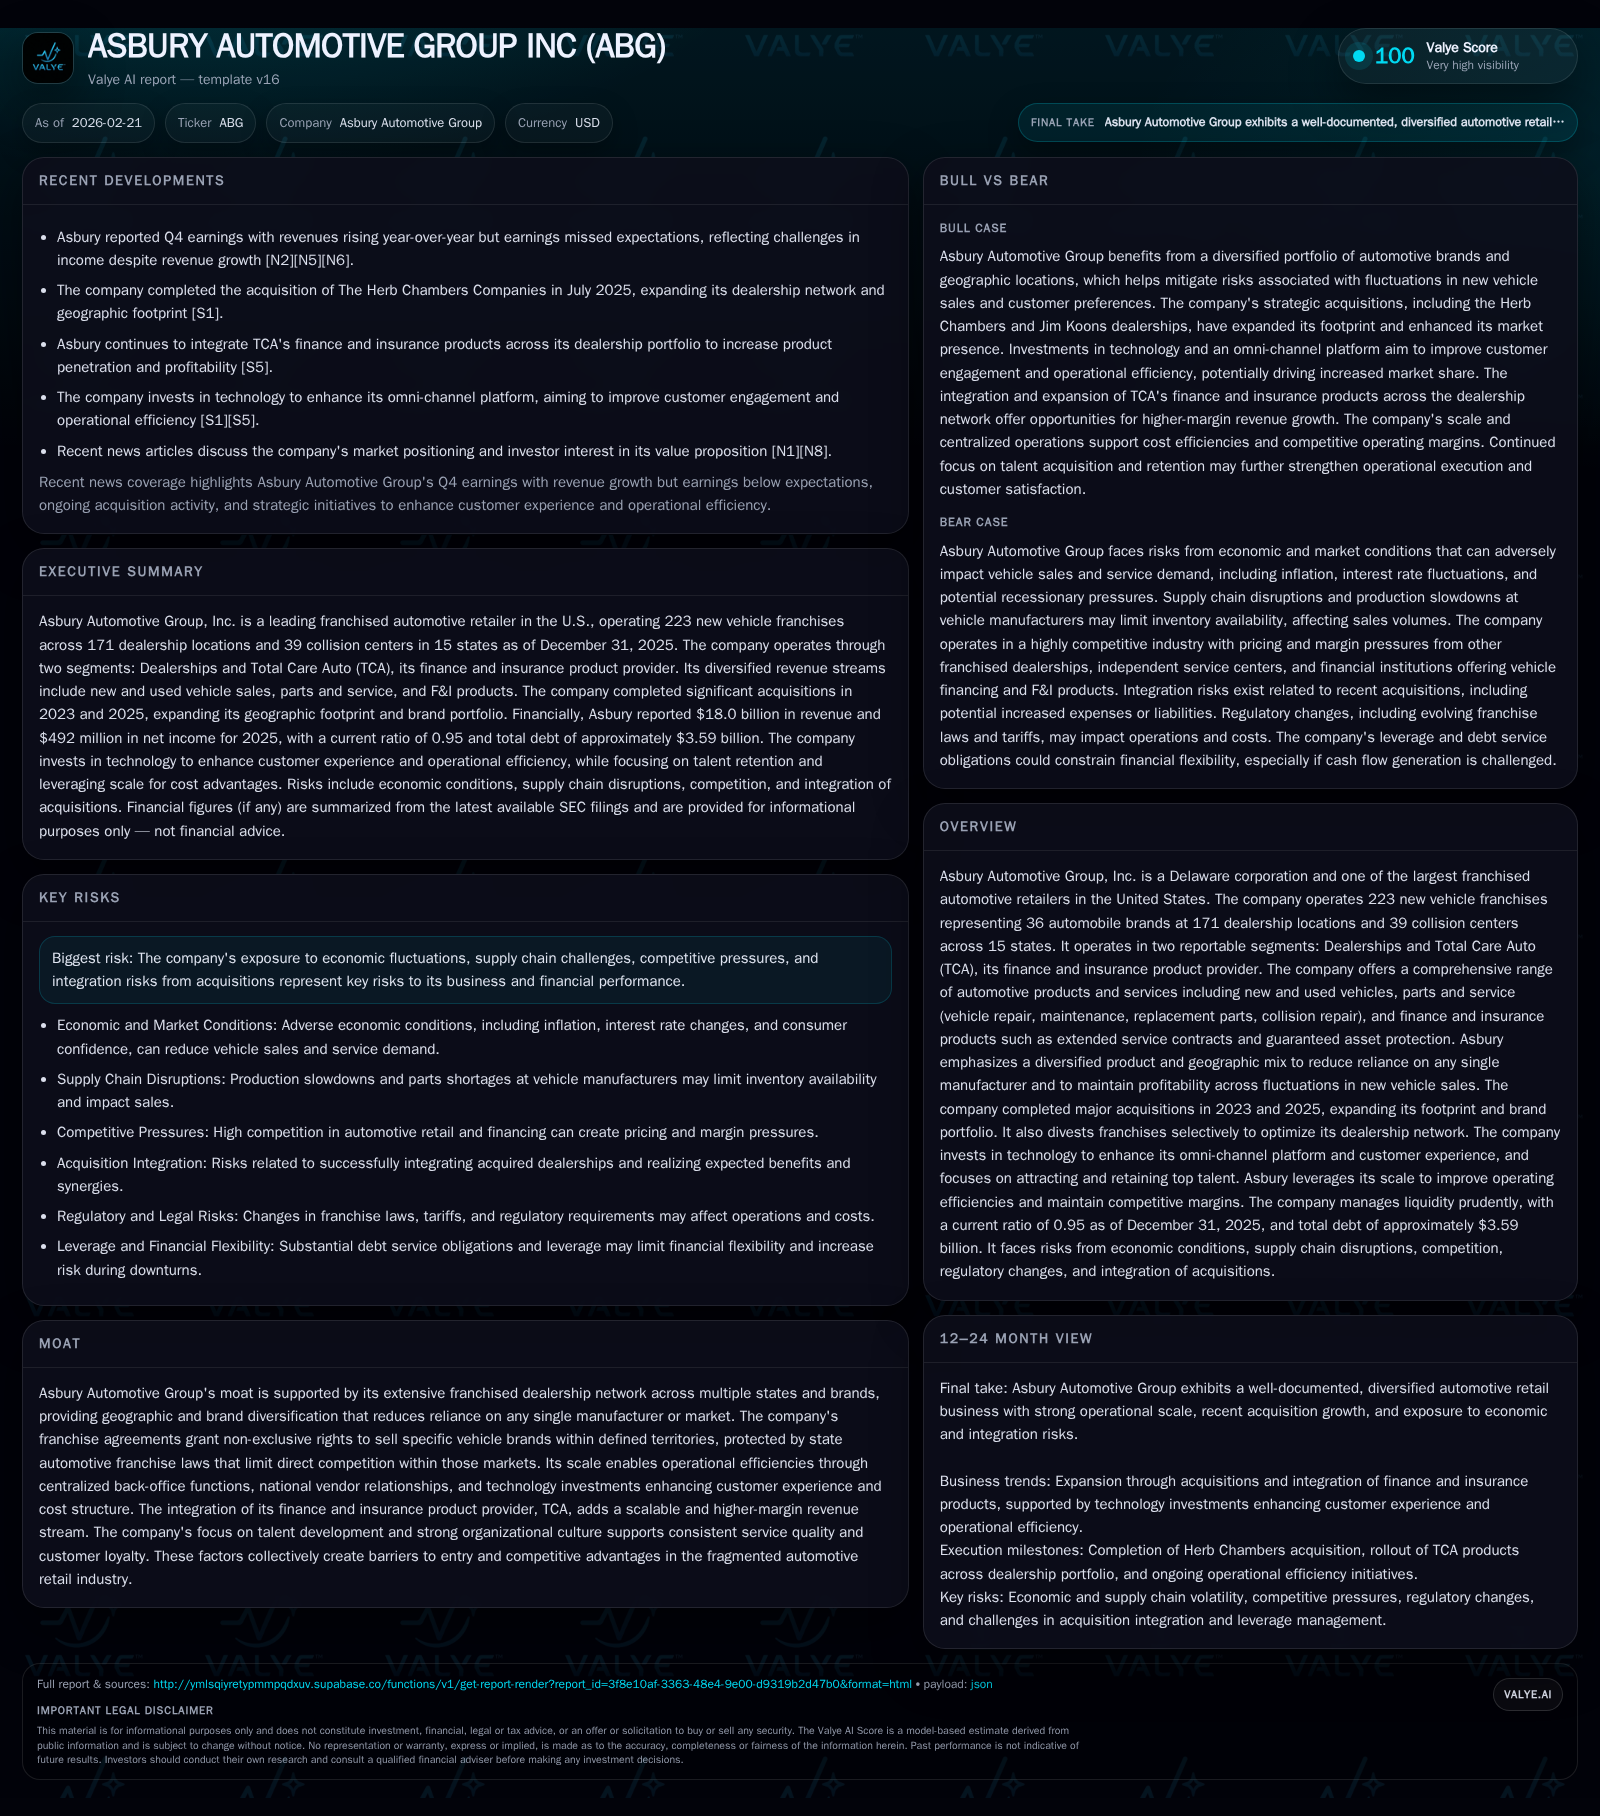
Asbury Automotive Group (ABG), a leading U.S. franchised automotive retailer, reported $18.0 billion in 2025 revenues, marking a 4.7% year-over-year increase primarily driven by the July acquisition of Herb Chambers dealerships. Consolidated gross profit grew 4%, supported by used vehicle, parts & service, and finance & insurance segments offsetting softer new vehicle margins. Net income rose 14% to $492 million, with diluted EPS at $25.13. The company generated $775 million in operating cash flow, yielding an estimated free cash flow of approximately $718 million after capital expenditures. Capital allocation included $12.8 million in share repurchases; dividend data is not disclosed in filings. The balance sheet carries $3.59 billion in debt with full covenant compliance as of year-end 2025. Future growth depends on successful integration of acquisitions, expansion in higher-margin segments, and navigating supply chain challenges.
Company Overview and Business Model
Asbury Automotive Group Inc., a Fortune 500 Delaware corporation, is among the largest franchised automotive retailers in the U.S., operating 223 new vehicle franchises across 171 dealership locations representing 36 brands as of December 31, 2025 [S1]. Its operations span luxury, import, and domestic vehicles distributed over 15 states alongside 39 collision centers and its finance & insurance segment Total Care Auto (TCA), which offers extended service contracts, GAP coverage, prepaid maintenance, and appearance protection products [S1][S9].
The company emphasizes diversification across brands and geographies to reduce reliance on any single manufacturer or region while maintaining multiple revenue streams including new/used vehicles, parts & service (repair and maintenance), and F&I products that cover the entire vehicle ownership lifecycle [S1]. Its omni-channel digital platform complements dealership operations enhancing customer experience across sales and aftersales services.
Historical Performance
Historical performance (annual)
| FY | Rev ($bn) | Net ($mm) | CFO ($mm) | OpInc ($mm) | Rev YoY | Net YoY |
|---|---|---|---|---|---|---|
| 2025 | 18.0 | 492 | 775 | 861 | +4.7% | +14.3% |
| 2024 | 17.2 | 430 | 671 | 836 | +16.1% | -28.6% |
| 2023 | 14.8 | 603 | 313 | 954 | ||
| 2021 | 15.4 | 997 | 696 | 1273 |
Note: Omitted columns lack sufficient annual XBRL coverage in the provided tags (need ≥2 annual points): Capex, Div, FCF. Source: SEC companyfacts cache [F1].
Capital returns and efficiency (annual)
| FY | Buybacks ($mm) | ROE% |
|---|---|---|
| 2025 | 13 | 12.6 |
| 2024 | 10 | 12.3 |
| 2023 | 11 | 18.6 |
| 2021 | 9 | 34.3 |
Source: SEC companyfacts cache [F1].
Revenue growth accelerated notably from FY23 to FY24 due to acquisitions but moderated somewhat in FY25 with organic growth plus the Herb Chambers acquisition contributing to the increase [F1][S1]. Operating income declined through FY23-24 primarily due to margin compression post-pandemic but stabilized and improved modestly in FY25 [F1][S1]. Net income rebounded strongly in FY25 benefiting from synergy realization and operational efficiencies post-acquisition.
Operating cash flow demonstrated robust improvement reflecting better working capital management despite ongoing capital investments.
Revenue Mix Dynamics
In FY25, new vehicle revenues grew by approximately 7%, yet new vehicle gross profit declined by around 3%, signaling margin normalization after pandemic-related supply disruptions inflated prices previously [S1]. Used vehicle gross profits improved by roughly 6% with stable revenues indicating strength in retail used sales.
Parts & service gross profit increased by about 9%, underscoring recurring revenue stability from maintenance and repairs.
Finance & insurance net revenues edged up modestly (+1%). The TCA segment's integrated F&I model enhances profitability through higher-margin aftermarket product sales supporting customer retention across ownership cycles [S9].
Impact of Herb Chambers Acquisition
The July 2025 acquisition of Herb Chambers Companies for approximately $1.76 billion significantly expanded Asbury’s dealership portfolio by adding around 33 dealerships along with additional brands and market presence primarily funded through borrowings under existing credit facilities [S1]. This acquisition contributed materially to revenue growth and is expected to deliver operational synergies via centralized processes.
Operational Efficiency and Cost Structure
Selling, general & administrative expenses increased moderately (+5%) aligned with scale expansion but remained controlled relative to gross profits amid inflationary pressures affecting labor costs, rent, and advertising expenses per vehicle retailed [S1].
Floor plan interest expense rose slightly due to larger inventory financing needs associated with expanded floor plan commitments exceeding $2 billion; the company manages interest-bearing liabilities prudently through offset accounts reducing effective interest costs [S6][S16].
Asset impairments decreased about 6%, indicating stable franchise rights valuations amid industry cyclicality.
Financial Position and Liquidity
Asbury’s balance sheet reflects:
- Total debt excluding floor plan notes payable at approximately $3.59 billion supported by multiple term loan facilities including real estate loans maturing through the late-2020s [F1][S4–S8]
- Revolving credit facility expanded to $925 million providing liquidity for acquisitions and working capital with borrowing availability near $747 million at December 31, 2025 after letters of credit issuance [S8][S16]
- Full compliance with all debt covenants throughout FY25 maintaining strong lender relationships and financial flexibility [S12]
- Restricted payment capacity stood at approximately $1.34 billion at year-end enabling dividends/share repurchases within covenant limits [S27]
- Cash balances moderate given working capital needs inherent in automotive retailing; liquidity emphasis placed on revolving credit access rather than large cash reserves [F1]
The company employs mortgage-backed real estate loans collateralized by dealership properties enhancing capital structure stability with amortizing principal repayments mitigating balloon risk over time [S14][S21].
Capital Allocation Strategy
During fiscal year 2025, Asbury repurchased approximately $12.8 million worth of common stock demonstrating measured capital return consistent with earnings growth targets while preserving leverage ratios; dividend payments are not detailed in available disclosures or XBRL tags indicating no material dividends or undisclosed dividend policy as of filing dates [F1][S29].
Capital expenditures historically ranged between $40-$80 million annually prior to recent years; exact current capex figures are not fully available but likely increased following the Herb Chambers acquisition reflecting investments into dealership upgrades and technology infrastructure critical for omni-channel retailing capabilities [F1].
Estimated free cash flow approximates $718 million based on operating cash flow less capex supporting internal funding capacity for acquisitions, debt servicing or opportunistic returns.
Outlook Considerations and Milestones to Monitor
While specific forward-looking financial guidance is not provided explicitly in filings or news releases,[N2][N6] key factors shaping Asbury’s outlook include:
- Successful integration of Herb Chambers dealerships driving synergies without operational disruption.
- Organic growth in used vehicles and parts & service segments sustaining margin expansion.
- Expansion of F&I penetration leveraging TCA's scalable platform enhancing recurring high-margin revenues.
- Digital channel enhancements improving customer engagement amid evolving purchase behaviors.
- Supply chain conditions influencing new vehicle inventory availability potentially constraining volume recovery.
- Ongoing compliance with debt covenants ensuring financial flexibility for acquisitions or capital returns.
- Monitoring same store sales trends excluding acquired/divested locations provides insight into organic demand strength.
- Capital expenditure pacing aligned with technology upgrades critical for competitive positioning.
Conclusion
Asbury Automotive Group demonstrates resilient multi-brand dealer network strength supported by strategic acquisitions such as Herb Chambers alongside diversified revenue streams including used vehicles, parts & services, and finance & insurance products that enhance profitability stability amid margin normalization pressures post-pandemic.
The company’s disciplined capital allocation balancing modest buybacks against substantial debt positions within covenant limits supports sustainable growth prospects pending successful integration execution.
Future performance hinges on navigating macroeconomic headwinds affecting consumer demand while leveraging its omni-channel platform to deepen customer relationships across the vehicle ownership lifecycle.[F1][S22]
This analysis is based exclusively on information available as of February 21, 2026 drawn from SEC filings ([F1], [S#]) and Nasdaq news articles ([N#]) without extrapolation or invention beyond provided data.
Disclaimer: This is research-only, informational analysis and not investment advice. It may include AI-generated interpretation and general industry context. Always verify important details using primary sources.
Comments