
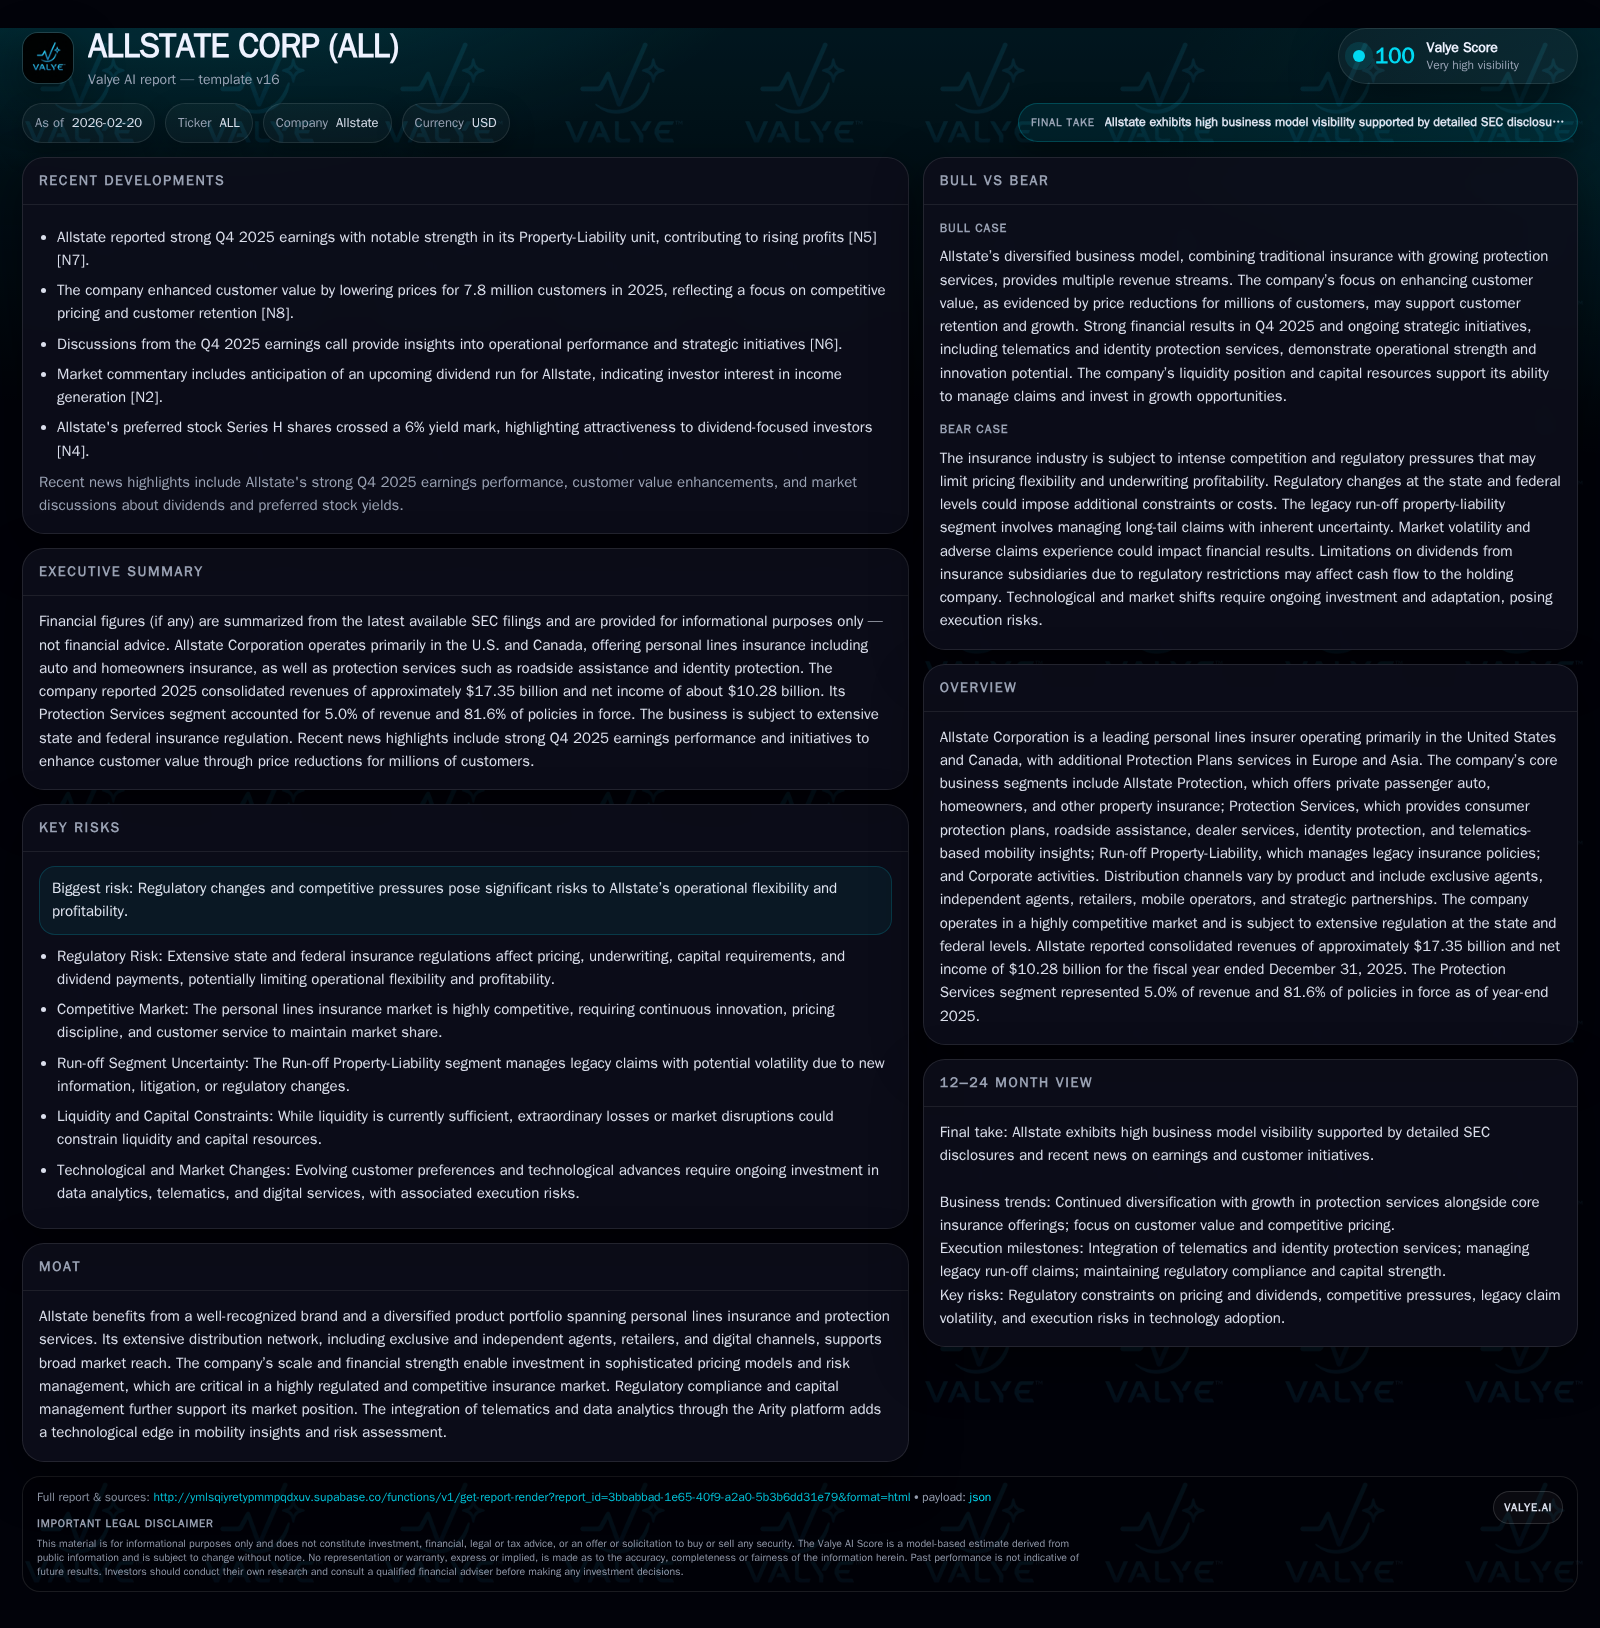
Allstate's Financial Momentum: Balancing Legacy Lines with Innovation
Allstate's robust earnings rebound in 2025 underscores its strategic growth in protection services and disciplined capital management amidst evolving regulatory challenges.
After enduring two consecutive years of net losses, Allstate Corp recorded a remarkable net income surge to $10.28 billion in 2025, driven primarily by its core personal lines insurance and expanding Protection Services segments. The company’s revenue increased by 5.1% year-over-year, fueled by strong premium growth in auto and homeowners insurance alongside emerging consumer protection products. Allstate's capital allocation strategy, characterized by a high return on equity (~33.6%), steady dividends, and aggressive share repurchases, complements its operational momentum. Looking ahead, the integration of telematics through the Arity platform continues to enhance risk management capabilities, although ongoing regulatory scrutiny and litigation remain notable headwinds.
Financial Turnaround: From Losses to Record Net Income
The period from 2022 through 2023 marked a challenging phase for Allstate as the company faced consecutive years of net losses amounting to -$1.31 billion in 2022 and -$188 million in 2023 [F1]. This adverse performance reflected pressures on underwriting results amid an inflationary claims environment and catastrophic weather events impacting property-casualty insurers broadly. However, fiscal year 2025 saw a pronounced recovery with net income soaring to $10.28 billion, representing an extraordinary year-over-year jump of approximately +120.3% [F1]. This earnings rebound was underpinned by revenue growth reaching $17.35 billion in 2025, a +5.1% increase over $16.51 billion in the prior year [F1]. Operating cash flows followed suit with a healthy improvement to $10.11 billion in 2025 (+13.2% YoY), signaling operational leverage benefiting from top-line expansion coupled with expense discipline [F1].
This profit restoration grows against a backdrop of intense competition within personal lines insurance, where Allstate maintains notable market share across private passenger auto and homeowners lines. According to regulatory filings, Allstate Protection accounted for the vast majority—about 85.2%—of consolidated revenues through its core auto and home policies primarily distributed within key U.S. states including Texas, California, Florida, and New York [S5][S9]. The company’s underwriting discipline, sophisticated pricing models driven by stochastic behavior analyses, and catastrophe loss management were pivotal in reversing prior losses and enhancing combined ratios [S23].
Historical performance (annual)
| FY | Rev ($bn) | Net ($bn) | CFO ($bn) | Capex ($mm) | Rev YoY | Net YoY |
|---|---|---|---|---|---|---|
| 2025 | 17.3 | 10.3 | 10.1 | 228 | +5.1% | +120.3% |
| 2024 | 16.5 | 4.7 | 8.9 | 210 | +11.3% | +2582.4% |
| 2023 | 14.8 | -0.2 | 4.2 | 267 | +8.7% | +85.7% |
| 2022 | 13.6 | -1.3 | 5.1 | 420 |
Note: Omitted columns lack sufficient annual XBRL coverage in the provided tags (need ≥2 annual points): OpInc, Div. Source: SEC companyfacts cache [F1].
Capital returns and efficiency (annual)
| FY | Buybacks ($bn) | FCF ($bn) | ROE% |
|---|---|---|---|
| 2025 | 1.2 | 9.9 | 33.6 |
| 2024 | 0.0 | 8.7 | 21.8 |
| 2023 | 0.3 | 4.0 | -1.1 |
| 2022 | 2.5 | 4.7 | -7.5 |
Source: SEC companyfacts cache [F1].
Note: Operating income unavailable; Dividends paid unavailable or insufficient annual data.
Revenue Growth Drivers Across Core Segments
The revenue uplift is principally attributable to Allstate Protection’s personal lines portfolio which encompasses private passenger auto insurance and homeowners insurance—the company's traditional mainstays generating over four-fifths of revenues [S5][F1]. Growth drivers herein include rate adjustments reflecting updated actuarial risk assessment methodologies incorporating telematics inputs, retention improvements amid competitive pricing tactics, and geographic focus on states with high premium volumes [S9].
Complementary to this was meaningful progress in the Protection Services segment which now represents about 5% of total revenue but commands over 81% of policies in force (PIF). Protection Services spans consumer product protection plans (covering mobile devices, major appliances), automotive ancillary products—including vehicle service contracts—and burgeoning identity theft protection services [S8][S10]. This segment leverages diversified distribution channels including exclusive agent networks for roadside assistance and direct-to-consumer digital platforms for identity services [S10]. Notably, the international extension of Protection Plans into Europe and Asia further broadens Allstate's geographic footprint beyond North America [S8].
This diversification into services beyond traditional insurance premium writing adds resilience against cyclical underwriting volatility while enabling cross-selling opportunities anchored on customer lifetime value paradigms.
Outlook on Emerging Opportunities and Tailwinds in Protection Services
Looking forward, Allstate’s outlook is buoyed by innovation-driven growth prospects anchored by the Arity telematics platform—a cornerstone of Protection Services—which offers data-driven mobility insights including dynamic risk scoring (Arity IQ), marketing lead generation solutions, digital advertising services, and data-as-a-service partnerships [S8][N2]. The integration of real-time driving behavior into underwriting enables more granular segmentation improving pricing accuracy and loss mitigation potential.
Emerging opportunities are also present where consumer protection plans adapt to technological device proliferation; this sector benefits from increasing electronic device ownership alongside rising cybercrime concerns fueling demand for identity restoration services [N2][S10]. The ability to bundle such offerings with auto-related product warranties or roadside assistance packages provides cross-product penetration levers.
However, growth moderation risks emerge from competitive pressures amongst carriers deploying comparable telematics capabilities or service providers expanding their consumer warranty footprints.
Risks and Regulatory Environment Shaping Future Performance
Allstate operates within one of the most heavily regulated sectors at both state and federal levels —a fact that has intensified over recent years [S7][N2]. Key regulatory risks include evolving state insurance commissioner mandates influencing rate approvals constraining underwriting flexibility while increased cybersecurity/privacy rules necessitate significant ongoing compliance investments [S7][S27]. Additionally, changes expected or contemplated in federal frameworks can alter roles related to disaster response coordination (e.g., FEMA adjustments) affecting catastrophe modeling assumptions critical for reserve adequacy [S7].
Litigation risk is non-trivial; the firm faces multiple class action lawsuits addressing claims handling practices and product coverage disputes that may exceed accrued reserves given emerging judicial trends favoring larger jury awards [S7][S12][N2]. The volatile nature of these outcomes injects earnings unpredictability.
Environmental exposures remain monitored closely via run-off property-liability claims mainly tied to legacy asbestos/environmental policies dating back decades; stochastic modeling helps contain reserve uncertainties but material shifts can occur if settlement dynamics evolve unfavorably [S24][S26].
Capital Deployment: Dividends, Buybacks, and Liquidity Positioning
Allstate’s capital allocation reflects a robust emphasis on shareholder returns aligned with strong operational cash generation capabilities evidenced by free cash flow approximating $9.88 billion in FY25 (operating cash flow less capex) [F1]. Return on equity hovers around an impressive ~33.6%, illustrating effective capital utilization benefiting shareholders while maintaining balance sheet strength.
Dividends were consistently raised during FY25 with quarterly increments culminating in an announced increase to $1.08 per share starting April 2026 payment cycle [N10][S28]. Meanwhile, share repurchases accelerated sharply post-2024’s negligible activity totaling $1.24 billion executed during FY25 representing ~2.3% reduction in outstanding shares underpinning EPS accretion efforts [F1][N11]. Board authorizations include a fresh $4 billion repurchase program succeeding the existing authorization underscoring confidence amid stable liquidity buffers.
Balance sheet liquidity stands fortified by substantial deployable assets at holding company level ($7.52 billion), an undrawn revolving credit line totaling $750 million extending through late-2027 with no commercial paper outstanding at year-end—culminating in conservative leverage metrics: debt-to-capital ratio at just about ~15%, far below covenanted maximums around mid-30%s [S4][S20][F1]. This financial flexibility supports strategic investment capacity plus hazard resilience.
Key Metrics to Watch in Upcoming Quarters
While explicit forward guidance was absent from latest disclosures or earnings commentary [N2][N3], several critical metrics warrant close monitoring for signals on sustaining momentum:
- Underwriting margin trajectories reflecting expense management against claims inflation pressures;
- Frequency/severity trends of auto/homeowner claims especially post-catastrophe season influencing reserve adequacy;
- Pace of new business sales and renewal rates within Protection Services indicating market acceptance of innovative products;
- Expansion velocity of Arity API integrations with affiliated partners as early traction predicates future monetization;
- Regulatory developments modifying rate-setting protocols or cybersecurity compliance costs projecting margin impact. These serve as leading indicators aligning near-term performance with long-term strategy execution efficacy.
Integrated Risk Management Through Telematics and Data Analytics
A sector-specific strength lies within Allstate’s sophisticated use of telematics via Arity which harnesses extensive real-time driving data streams essential for next-generation actuarial analyses—far surpassing conventional rating models dependent solely on static demographic proxies [S1][S10].
This capability enables nuanced dynamic risk segmentation driving optimized pricing calibrations thus preserving underwriting profitability amid changing behavioral patterns accelerated by technological adoption shifts among insureds. Moreover, it facilitates proactive loss prevention initiatives delivered through personalized driver feedback mechanisms enhancing safety outcomes reducing claim frequency severity coverage costs over time. Such integrated analytics infrastructure underpins Allstate’s defensible moat positioning relative to competitors slower adopting telematics-enabled risk scoring frameworks.
This analysis synthesizes publicly available SEC filings ([S#]), recent news transcripts ([N#]), and structured financial data ([F1]) related to Allstate Corporation as of February 20, 2026 without offering investment advice or price targets.
Disclaimer: This is research-only, informational analysis and not investment advice. It may include AI-generated interpretation and general industry context. Always verify important details using primary sources.
Comments