
Ares Management’s $145B Capital Deployment and $156B Dry Powder Signal Ambitious Multi-Asset Growth
Ares Management strengthened its global alternative platform in 2025 through strategic acquisitions and multi-asset capital deployment.
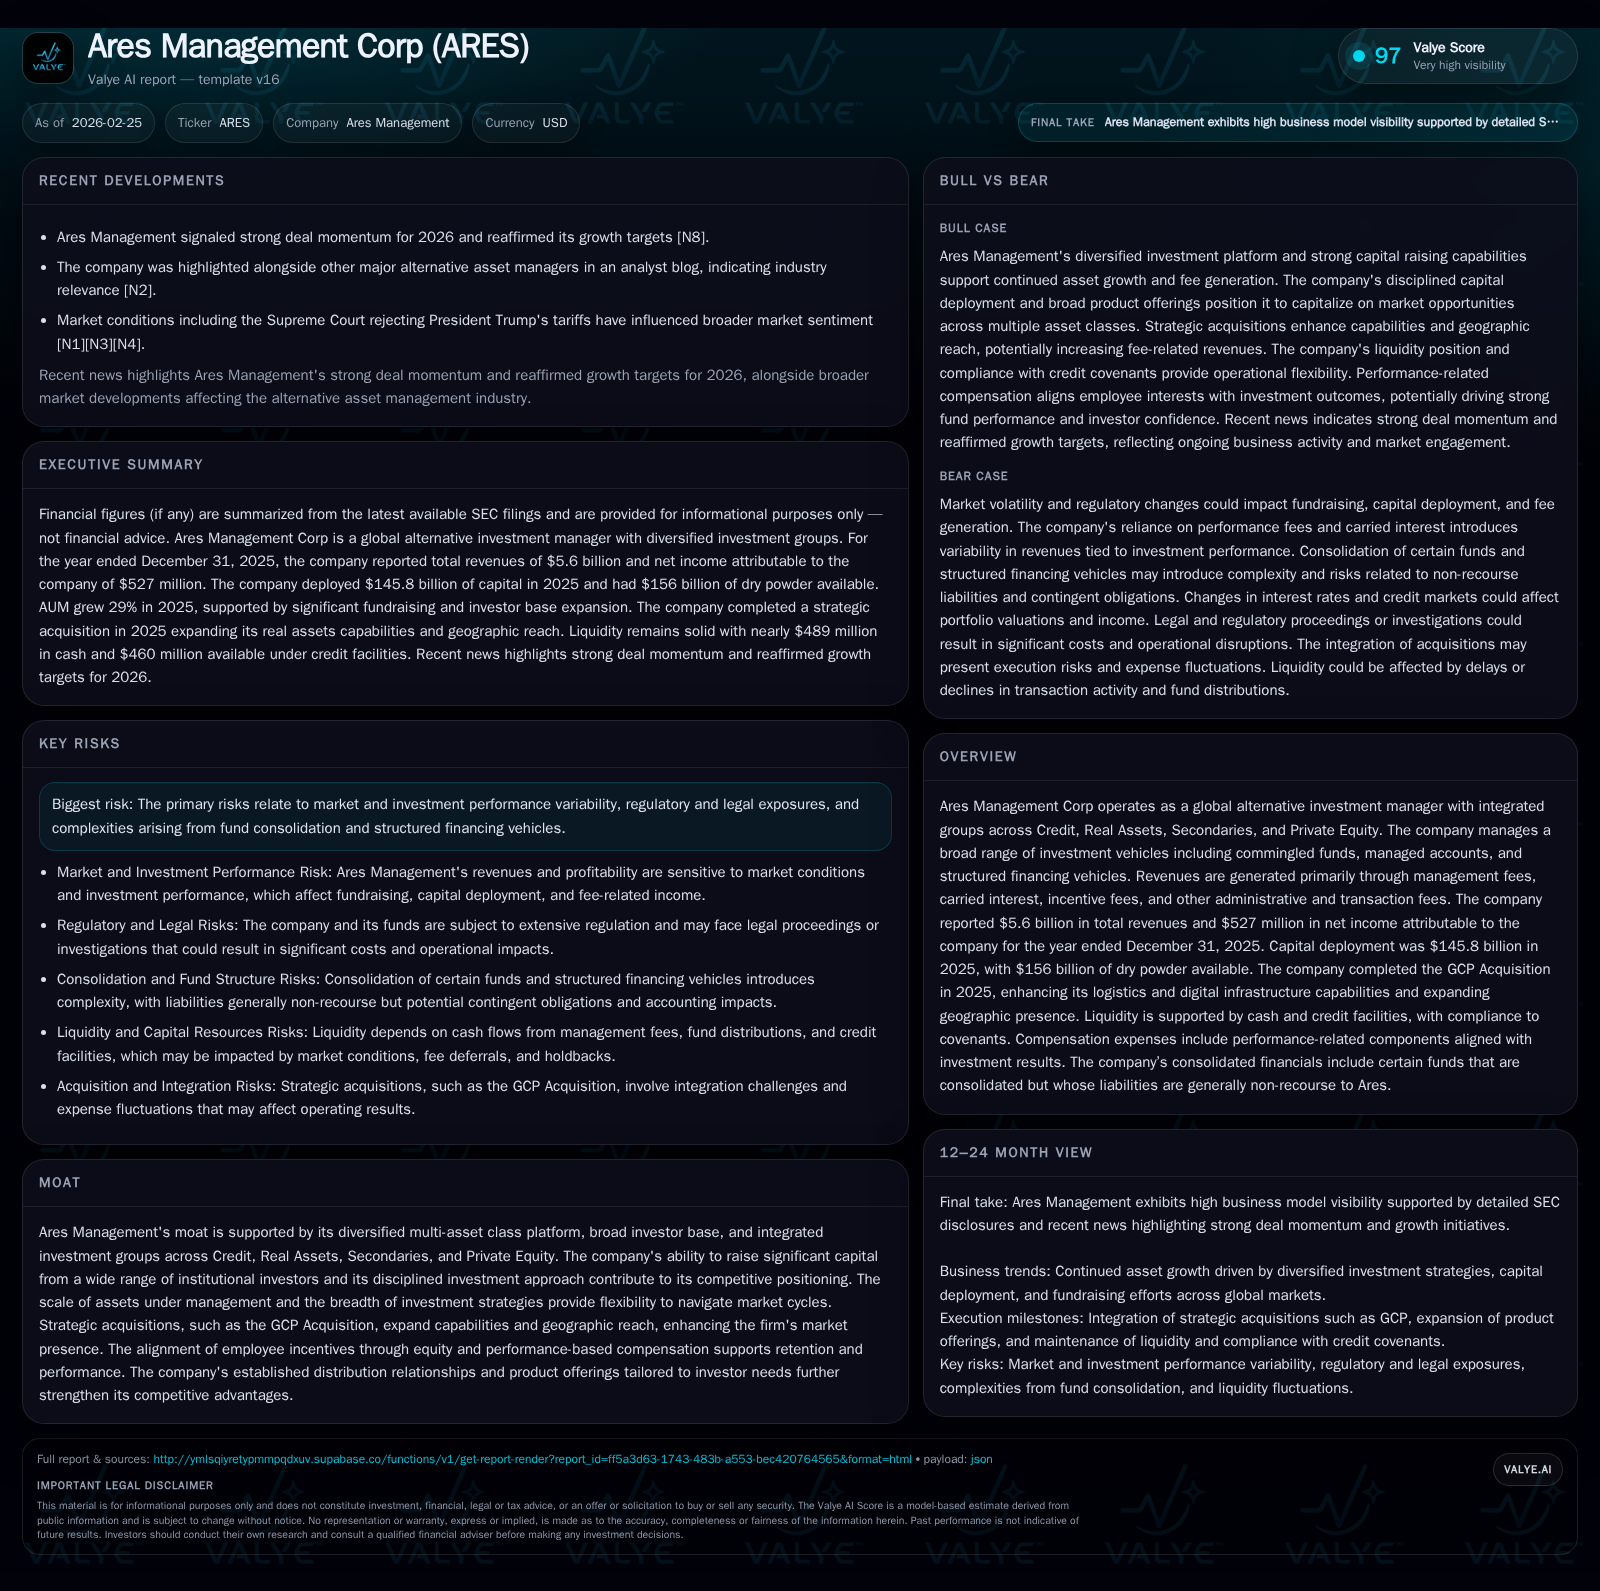
Ares Management Corp demonstrated robust growth in 2025 with revenues reaching $4.76 billion, up nearly 29%, supported by a substantial increase in capital deployment to $145.8 billion and an expanded dry powder reserve of $156 billion. The firm enhanced its multi-asset investment platform with the acquisition of GCP, boosting real assets capabilities and geographic reach. Capital allocation initiatives include disciplined dividend policies aligned with fee-related earnings and a focus on retaining performance income to fund future expansions. Risks remain tied to market variability, fund complexities, and regulatory challenges.
Historical Performance Overview
Ares Management has cultivated a resilient revenue base characterized by significant year-over-year expansion across recent years. Its reported revenues were as follows (all figures in USD billions) [F1]:
Historical performance (annual)
| FY | Rev ($bn) | Net ($mm) | CFO ($bn) | Rev YoY | Net YoY |
|---|---|---|---|---|---|
| 2025 | 4.8 | 527 | 3.3 | +28.9% | +13.7% |
| 2024 | 3.7 | 464 | 2.8 | +14.0% | -2.2% |
| 2023 | 3.2 | 474 | -0.2 | +12.4% | +183.1% |
| 2022 | 2.9 | 168 | -0.7 |
Note: Omitted columns lack sufficient annual XBRL coverage in the provided tags (need ≥2 annual points): OpInc, Capex, Buybacks, FCF. Source: SEC companyfacts cache [F1].
Capital returns and efficiency (annual)
| FY | Div ($mm) | ROE% |
|---|---|---|
| 2025 | 21 | 12.3 |
| 2024 | 16 | 13.1 |
| 2023 | 25.1 | |
| 2022 | 10.5 |
Source: SEC companyfacts cache [F1].
*Operating cash flow was negative in prior years but turned sharply positive as of fiscal year-end 2024.
Revenues grew by approximately 29% from fiscal year (FY) 2024 to FY2025, largely driven by increased assets under management (AUM) and successful capital deployment across its integrated credit, private equity, real assets, and secondaries groups.
Net income expanded more moderately at nearly +14% YoY in FY25—in line with the associated rise in operational scale while managing incremental expenses related to acquisitions and platform expansion [F1][S7]. Operating cash flow turned highly positive at over $3 billion FY25 after prior negative years indicating improved working capital management and fee collection intensity.
Equity grew substantially as well reflecting accrued retained earnings post-dividend payments which themselves increased steadily aligned with profitability gains.
Multi-Asset Platform Growth Drivers and Strategic Initiatives
In the year ended December 31, 2025, Ares deployed gross capital of $145.8 billion compared to $106.7 billion deployed in the prior fiscal year—a nearly +37% increase—indicative of both strong fundraising success and attractive market opportunities fueling investment activity [S14]. Concurrently, the company increased dry powder reserves to approximately $156 billion from about $133 billion a year earlier setting up a sizable runway for deal-making.
One significant catalyst was the completed acquisition of Global Corporate Partners (GCP), announced for Q1 2025 completion [S1]. This transaction allowed Ares to substantially expand its holdings in logistics and digital infrastructure sectors—two areas experiencing secular growth due to e-commerce penetration and digitization trends—while also extending its geographic reach internationally.
The acquisition synergizes well with Ares’ existing multi-asset strategy by augmenting real assets capabilities especially within industrial real estate logistics platforms where integrated asset management intersects with capital markets transaction expertise.
The firm's ability to raise capital from over 540 institutional investors—including more than two hundred new direct institutional investors—and across more than one hundred ninety different investment vehicles underscores its broad distribution capabilities that support diversification of fee streams across geographies and asset classes [S14].
Portfolio risk management benefits from a predominance of floating-rate debt exposure (~85%), insulating cash flow against rising interest rates while maintaining flexibility amidst fluctuating credit environments [S14].
Fee Structure & Revenue Composition
Ares generates revenue primarily through several streams: management fees tied to NAV or invested capital; carried interest and incentive fees contingent on fund performance; administrative, transactional fees from loan originations; property-related fees linked primarily to real estate operations including leasing and acquisitions; and sales/distribution fees associated with perpetual wealth vehicles and exchange programs relying on real property transactions [S1].
This diversified revenue model reduces reliance on any singular fee type or asset class while aligning incentives with long-term performance outcomes.
Forecasts & Growth Expectations
While explicit forward guidance remains limited beyond reaffirming growth targets announced post-earnings call in early February 2026 [N1], key growth indicators include:
- Continued fundraising momentum expected across existing strategies as well as new product development aimed at wealth management channels globally,
- Incremental contributions anticipated from newly acquired GCP assets,
- Monetization of unfeedered AUM totaling approximately $83 billion not currently generating fees but poised to produce roughly $730 million in annual incremental fees upon full deployment/stabilization,
- Realized net performance income reinvested or retained for future capital deployment accelerating fee-related earnings growth per share,
- Ongoing geographic expansion efforts targeted at Asia-Pacific alongside Americas and Europe markets.
Market conditions featuring greater demand for absolute return strategies amid volatile macroeconomic factors may further enhance investor appetite for Ares’ multi-pronged offerings that blend credit-oriented mandates with equity upside potential [S14][N1].
Returns & Capital Allocation Framework
A rough estimate of return on equity (ROE) calculated from reported net income ($527 million) versus fiscal year-end equity ($4.28 billion) approximates to ~12%. This implies healthy profit generation relative to invested shareholder capital given the firm's business model constraints around deferred compensation expenses, carried interest timing lags, and other non-cash expenses.
The company exhibits robust free cash flow generation (operating cash flow less capex) netting around $3.2 billion as capex remains modest relative to operating scale due largely to asset-light organizational design even as it supports operational expansion costs tied to technology upgrades & office footprint increases incurred alongside growth initiatives [F1][S7].
Capital allocation prioritizes regular quarterly dividends targeted at fixed payout ($1.35/share per quarter declared for calendar year 2026) aligned closely with core fee related earnings (FRE)—management fees plus certain performance revenues less compensation—and adjusted for current tax allocations enhancing dividend stability versus variable carried interest income fluctuations [S10][S25].
The retention of realized performance income supports organic growth funding without excessive dilution or leverage creep while providing flexibility for opportunistic share repurchases when market conditions permit—a balance suited for long-term shareholder value creation without sacrificing liquidity or capital structure integrity.
Balance Sheet & Liquidity Profile
Liquidity is bolstered by cash & equivalents approximating half a billion USD (~$488M) alongside $460 million available on revolving credit facilities compliant with all leverage covenants as of December 31, 2025 [S4][S6], sufficient to meet working capital demands, strategic investments including acquisitions like GCP, distributions obligations, debt servicing needs, tax liabilities including TRA payments, fixed operating costs such as payroll & occupancy expenses.
Consolidated lease obligations extend significantly into future periods (majority expiring through mid-2040s), alongside corporate debt balances amounting to several billions inclusive of senior notes issued periodically over recent years at favorable rates reflective of the company’s solid credit profile within alternative asset manager space [S5][S6][S15][S16].
Off-balance sheet commitments primarily cover guarantees and ongoing fund capital calls requiring careful monitoring but remain manageable given fortunately ample liquidity buffers combined with proactive capital management practices outlined in governance disclosures.
Market Position & Competitive Moat Considerations
Ares Management’s competitive edge resides in its diversified platform spanning credit, private equity, real assets including real estate/digital infrastructure/logistics plus secondary market investments—a rare integration permitting cross-selling synergies while mitigating concentration risk inherent in single asset specialization ..
Strong institutional distribution channels granting access to hundreds of global investors underpin resilient fundraising capacity essential for increasing AUM thereby lifting recurring fee streams commensurate with scale benefits shared across investment groups deploying disciplined sourcing frameworks focusing on valuation discipline aligned with client interests..
Employee alignment via equity-centric compensation packages enhances talent retention critical for sustaining deal origination momentum plus effective portfolio company value-add initiatives crucial under volatile economic cycles..
Their ability to structure financing vehicles complements traditional fund models permitting flexible risk-return profiles broadened investor appeal amid shifting regulatory landscapes evolving macro trends..
Risks Summary & Outlook Considerations
Key risks highlighted include the inherent variability of investment returns impacting carried interest realization timing/amounts potentially compressing profitability; regulatory scrutiny intensifying requiring robust compliance infrastructures; complexities due to consolidation/fund structuring arrangements that can obscure underlying risk vectors; liquidity stresses arising if fundraising or exit markets weaken unexpectedly..
Given these factors along with global economic uncertainties—such as macro inflation persistence or geopolitical tensions influencing cross-border transactions—stakeholders should monitor:
- Fundraising trends by asset class/region,
- Capital deployment pace versus available dry powder balance,
- Regulatory developments affecting product structures or investor eligibility,
- Performance metrics especially IRR versus peers capturing realized versus unrealized gains,
- Credit quality shifts within floating-rate debt instruments subject to rate volatility.
Summary Table: Financial Snapshot FY2022–FY2025 (USD millions)
| Year | Rev | Net Inc | CFO | Equity | Dividends |
|---|---|---|---|---|---|
| FY25 | 4756 | 527 | 3267 | 4275 | 21 |
| FY24 | 3691 | 464 | 2791 | 3544 | 16 |
| FY23 | 3236 | 474 | -233 | 1893 | N/A |
| FY22 | 2880 | 168 | -734 | 1589 | N/A |
Note: Operating income data unavailable; Buybacks data insufficient; Capex only disclosed for earlier years not shown here due to lack at later periods.
This analysis is based strictly on reported data up to December 31, 2025 and publicly available disclosures; it does not constitute investment advice or forecasts beyond provided facts.
Disclaimer: This is research-only, informational analysis and not investment advice. It may include AI-generated interpretation and general industry context. Always verify important details using primary sources.
Comments