
Academy Sports & Outdoors Scales Omnichannel Growth Amid Seasonal and Competitive Pressures
The latest quarter reveals growth in Academy’s footprint and omnichannel sales, highlighting both opportunities and operational challenges in its regional sporting goods retail strategy.
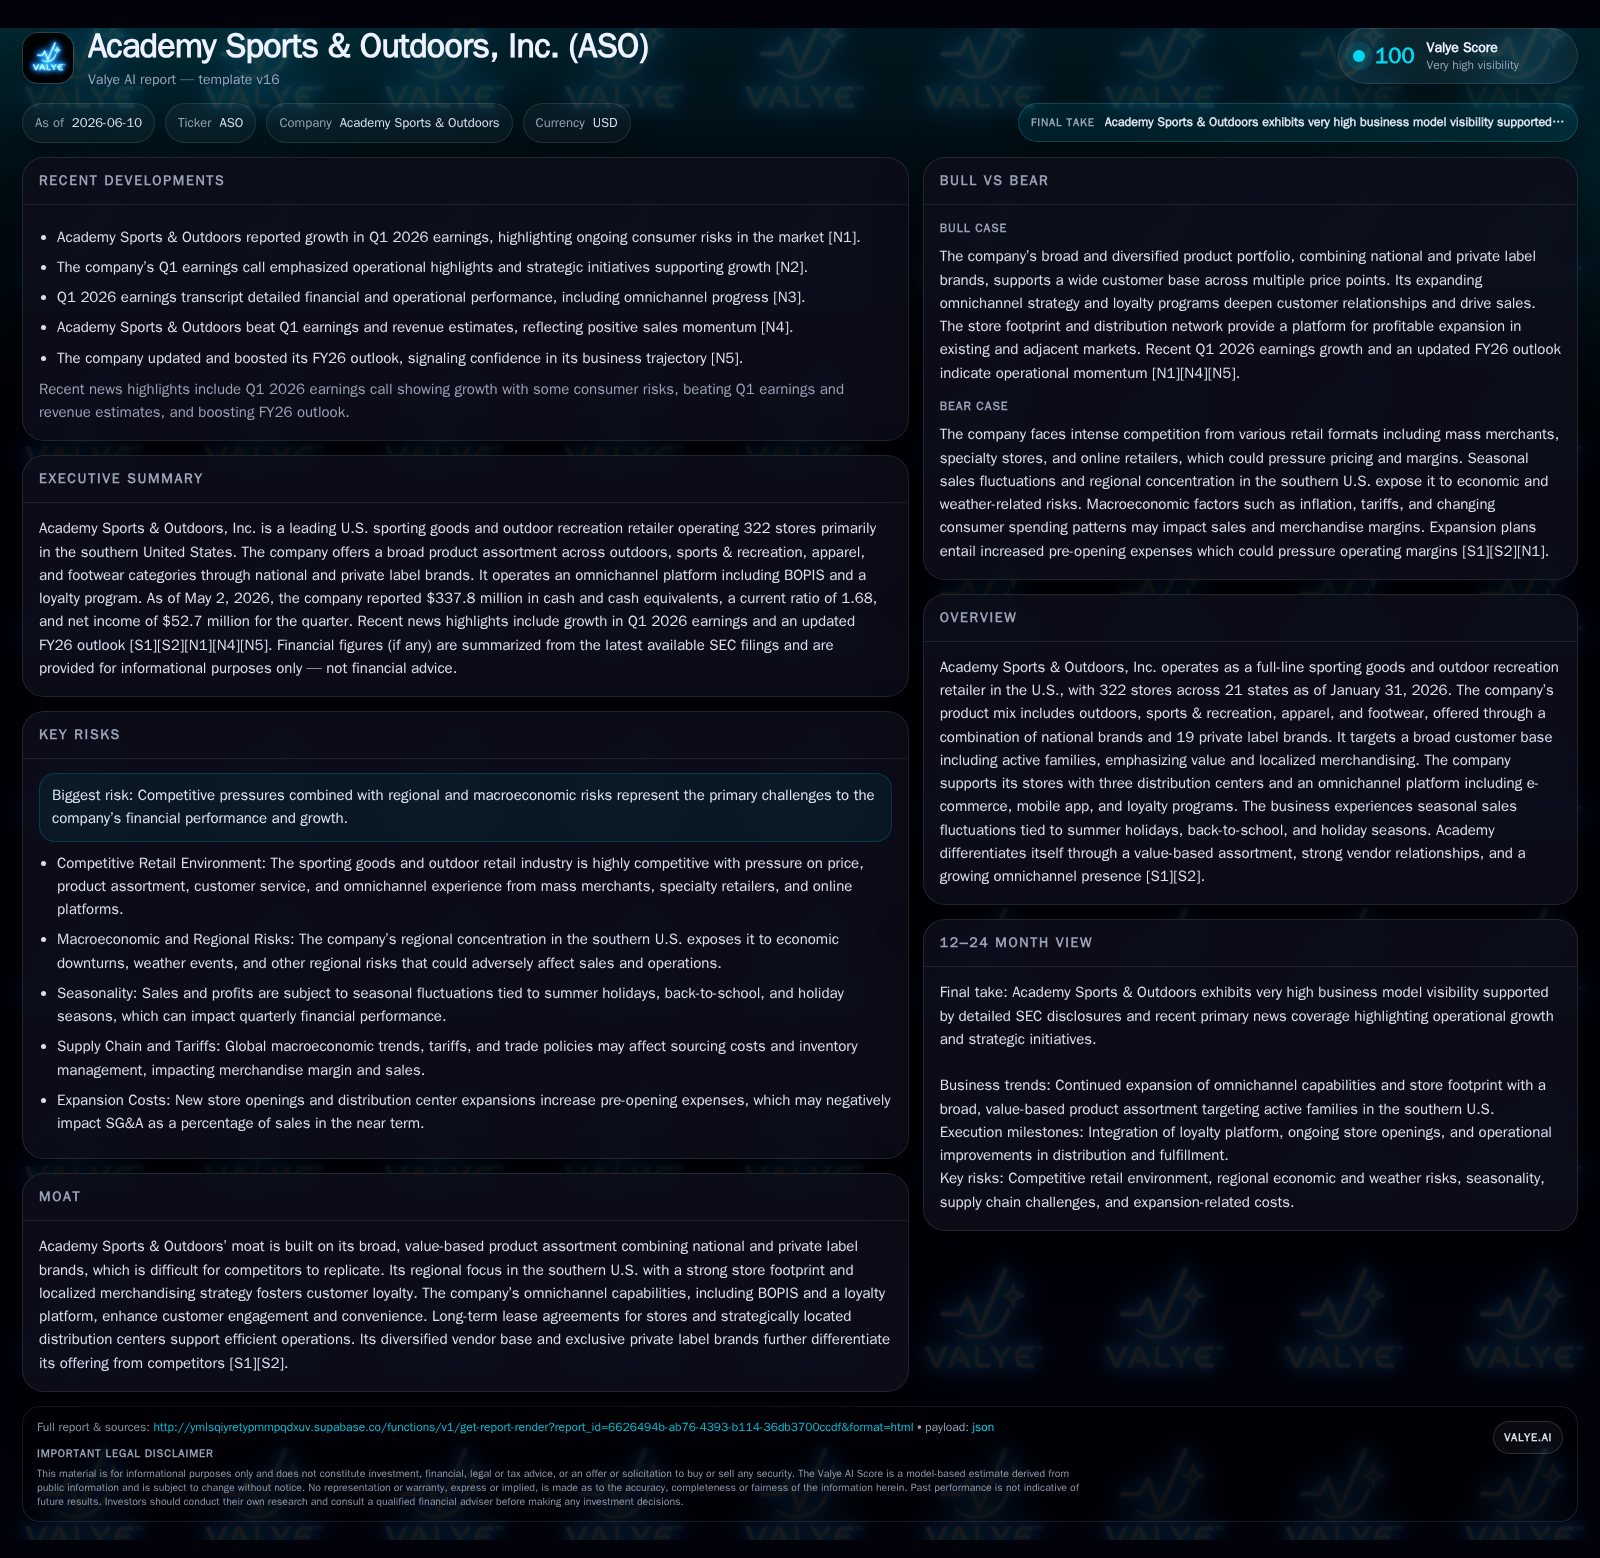
In its recent 10-Q filing for Q1 2026, Academy Sports & Outdoors reported continued expansion of its store footprint to 322 locations and advancement in omnichannel capabilities including BOPIS. The company leverages a value-based product assortment with a unique mix of national and private label brands tailored chiefly to active families in the southern U.S. However, seasonal demand fluctuations along with competitive intensity and macroeconomic uncertainties remain key operational considerations. Going forward, growth will hinge on expanding e-commerce penetration, deepening loyalty program engagement, optimizing inventory management, and selectively adding profitable store units while managing cost pressures.
Recent Operating Update
Academy Sports & Outdoors’ Q1 2026 Form 10-Q filing reports continuation of strategic store expansion with the total store count rising to 322 across 21 contiguous states as of early May 2026 [S2]. This represents gradual additions continuing from prior years, supporting the company's thesis of whitespace opportunity within its primarily southern U.S. footprint [S1]. The quarter emphasized investments in its omnichannel platform — notably enhancements to their buy-online-pickup-in-store (BOPIS) program and mobile app integration aimed at streamlining customer experience between digital and physical channels [S2][S3]. These efforts underpin recent positive comparable sales trends despite challenging macroeconomic conditions.
Seasonal demand remained a notable factor influencing quarterly performance. The company highlighted stronger sales linked to summer holidays such as Memorial Day along with preparations for back-to-school periods spanning late Q2 into Q3 [S2]. While these cycles introduce volatility to reporting periods, Academy leverages localized merchandising alongside promotional campaigns to capture family-oriented participation in outdoor recreation.
Business Model Overview
Academy’s business operates at the retail end of the sporting goods value chain, generating revenue predominantly through diversified merchandise categories: outdoors (31%), apparel (27%), sports & recreation (22%), and footwear (20%) based on recent annual report composition [S1]. This product mix is supported by a blend of leading national brands complemented by a growing stable of 19 proprietary private label brands [S1]. This dual-brand approach allows Academy to address multiple price points effectively — offering value-conscious consumers affordable options while maintaining attractive margin profiles on private labels. The vast physical footprint averaging roughly 70,000 gross square feet per location enables broad assortments tuned through localized merchandising strategies adapted to specific market preferences.
Integrated supply chain infrastructure underpins operations through three distribution centers strategically located to service stores efficiently in their regional catchment areas [S1]. Inventory turn rates are carefully managed around seasonal spikes with sophisticated replenishment systems adjusted for promotional intensity. Sales transactions occur via both physical stores and digital channels accessed through their website or mobile app; digital commerce incorporates BOPIS functionality that helps balance inventory flows between fulfillment centers and stores.
Revenue-driving levers include:
- In-store volume boosted by foot traffic during peak seasons
- E-commerce sales growth supported by omnichannel convenience features
- Pricing strategies balancing value propositions while protecting merchandise margins
- Mix improvements via increased share of private label products
- Loyalty program engagement driving repeat visits and higher basket sizes
Industry Structure & Competitive Positioning
Academy occupies a distinctive position within the highly fragmented sporting goods retail landscape. Its geographic concentration in the southern United States allows for focused marketing efforts and deep local market insights but also exposes it somewhat to regional economic shifts.
Competitors range from large specialty chains like Dick's Sporting Goods to outdoor lifestyle-focused stores like Bass Pro Shops / Cabela's. Mass merchants including Walmart and Target further encroach via broad assortments that appeal to similar customer segments but often lack the specialized outdoor or sports category depth beyond commodity items.
Academy differentiates itself via:
- A curated broad-value product assortment blending national name brands with exclusive private labels unique to its stores.
- Deep vendor relationships enabling competitive pricing and better access to emerging products.
- Strong omnichannel capabilities that complement a robust physical presence rather than replace it.
- A pronounced focus on active families seeking one-stop-shop convenience for diverse recreational needs.
This positioning supports sustained customer loyalty fostered by localized merchandising which drives repeat purchases amidst evolving consumer preferences toward casual participation over professional-level sporting gear.
Growth Drivers
Several key vectors underpin Academy's growth potential:
Store Footprint Expansion: The company continues targeted new store openings in existing markets while eyeing adjacent geographies where demographic trends favor increased outdoor recreation participation [S1]. Existing strong real estate relationships facilitate profitable openings averaging around five stores per quarter recently [S1][S2].
E-commerce & Omnichannel Sales: Digital penetration grows steadily bolstered by enhanced mobile app functionalities, improved website UX/UI, and BOPIS fulfillment options that attract customers preferring seamless shopping pathways [S2][N2]. This channel provides resilience against physical traffic fluctuations driven by seasonality or external disruptions.
Private Label Brand Development: Expanding private label assortment not only equips Academy with differentiation but also delivers higher gross margin potential relative to national brands—thus positively contributing to overall profitability even amid pricing pressures [S1]
Customer Loyalty Enhancement: Loyalty programs deepen engagement metrics fueling customer retention, incremental basket sizes, and increased visit frequency. Personalized marketing campaigns leveraging CRM data further amplify this effect.
Promotional Timing & Seasonal Campaigns: Leveraging key holiday periods—Memorial Day, Independence Day, back-to-school season—through calibrated promotional events maximizes top-line growth during peak demand intervals while managing markdown risk post-seasonally.
Risks & Watchpoints
Competitive intensity remains acute as peers aggressively pursue market share through scale advantages or niche differentiation. Mass merchandisers offer significant pricing challenges requiring Academy to carefully balance promotional intensity against margin dilution risks.
The company’s regional concentration introduces macroeconomic exposure risks tied to Southern U.S. economic cycles or adverse weather affecting outdoor activity participation levels. Moreover, evolving tariff structures impose supply chain cost uncertainties which require ongoing vendor negotiations and sourcing diversification efforts [S1].
Inventory management is critical; overstocking risks increase ahead of seasonal peaks whereas understocking threatens lost sales opportunities at demand peaks. Efficient inventory turns alongside sell-through rates must be maintained while avoiding elevated markdowns that compress margins.
Executing omnichannel integration at scale continues presenting operational challenges including fulfillment capacity constraints during peak periods. Maintaining seamless IT infrastructure supporting order management across channels is vital for preserving customer satisfaction.
Finally, leasing commitments for physical stores represent long-term fixed costs necessitating prudent location selection aligned with evolving consumer shopping habits.
What to Watch Next
Upcoming milestones influencing near-term outlook include:
- Quarterly comparable sales metrics revealing underlying volume growth versus price/mix effects;
- Continued cadence of new store openings validating expansion strategy efficiency;
- Trajectory of e-commerce penetration rates confirming omnichannel adoption success;
- Margin trends driven by product mix shifts especially private label contribution;
- Loyalty program KPIs such as member acquisition/retention rates informing repeat business sustainability;
- Inventory turnover ratios signaling supply chain responsiveness amidst seasonality;
- Management commentary on navigated headwinds related to tariffs or inflation impacting cost structures;
- Capital expenditure updates relating to strategic store remodels or distribution center enhancements.
These indicators collectively illuminate execution quality against the backdrop of persistent competitive headwinds and macro uncertainties.
Financial Profile Snapshot
Academy maintains solid liquidity positioning with cash & equivalents totaling approximately $338 million as of May 2026 balanced against total debt near $485 million resulting in net debt around $147 million reflecting manageable leverage levels [F1]. Current assets exceed liabilities by a healthy current ratio of approximately 1.68 lending confidence in short-term liquidity sufficiency [F1].
Operating income stood robustly at $512 million per the latest available period suggesting effective cost control complemented by strategic investments into store network expansion and technology enhancements [F1]
Disclaimer: This analysis uses publicly filed regulatory disclosures through June 2026 combined with industry framing derived from sector knowledge. It does not constitute investment advice or research views but aims to provide an informed operational perspective based strictly on cited evidence without speculative forecasts or unsupported claims.
Financial position in context
As of 2026-05-02, companyfacts shows $338mm in cash and equivalents and $485mm of total debt [F1]. The same snapshot implies net debt of roughly $147mm, keeping balance-sheet context relevant but secondary to the operating story [F1]. Current assets of $2.1bn and current liabilities of $1256mm imply a current ratio near 1.68x for 2026-05-02 [F1].
Disclaimer: This is research-only, informational analysis and not investment advice. It may include AI-generated interpretation and general industry context. Always verify important details using primary sources.
Comments