
ATN International’s Operational Resilience Tested by Spectrum Litigation and Market Dynamics
ATN International’s Q2 2026 results reflect ongoing legal disputes over spectrum fees alongside steady liquidity and strategic capital allocation.
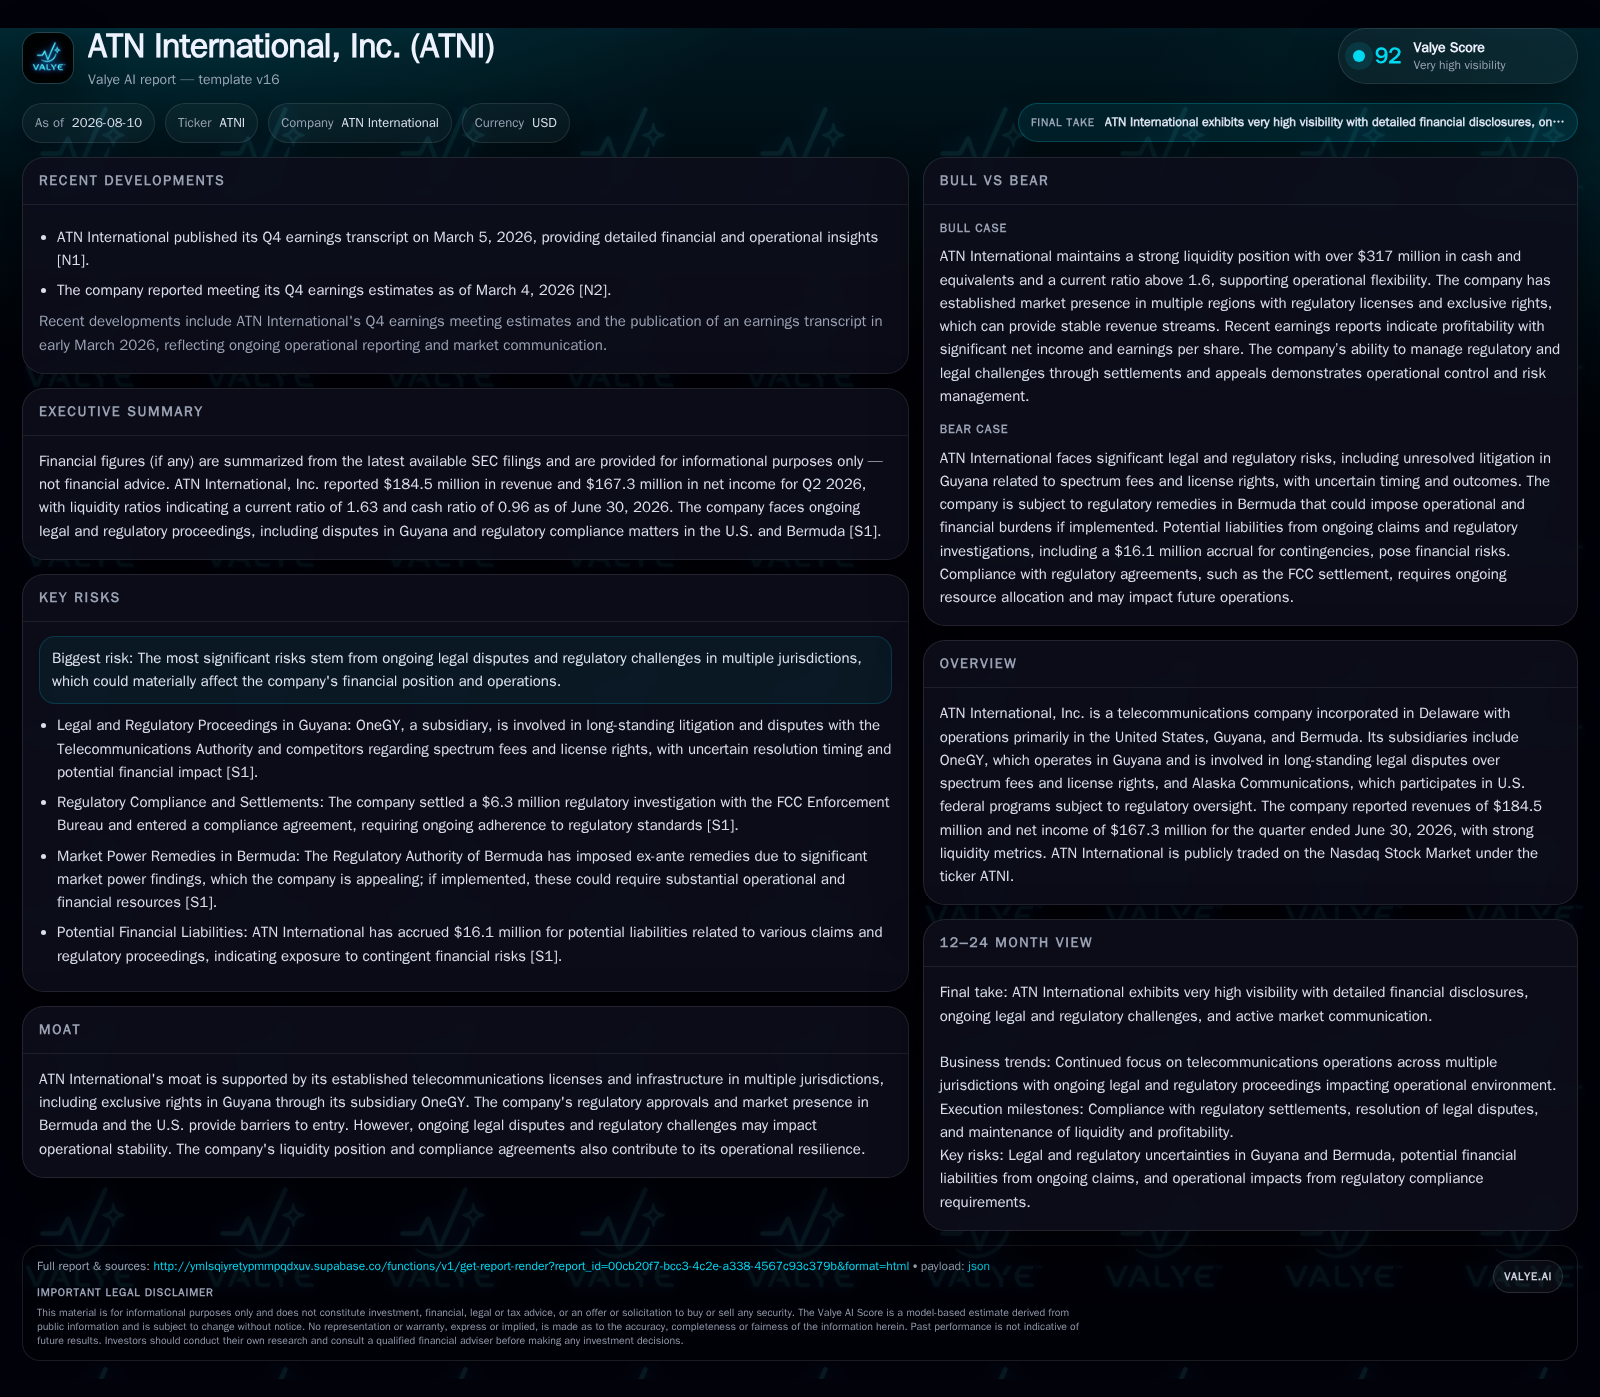
ATN International reported $184.5 million in revenue and $167.3 million in net income for Q2 2026, underscoring operational strength amid protracted spectrum litigation centered around its Guyana subsidiary, OneGY. The company’s multi-jurisdictional telecom operations expose it to regulatory complexity at varying degrees of intensity, affecting cost structure and revenue certainty. Recent expansion of share repurchase authorization signals management confidence in liquidity, while ongoing legal uncertainty continues to cloud near-term operational clarity.
Legal Disputes Over Spectrum Fees: Implications for Operational Continuity
ATN International's latest quarterly filing as of August 10, 2026 highlights the ongoing ramifications of decades-long regulatory disputes involving its Guyanese subsidiary OneGY [S1][S14][S18]. Since 2006, OneGY has contested the calculation methodology applied by the Guyana Telecommunications Authority (TA) to determine spectrum fees payable by the company. These contested fees have prompted litigation against regional competitor Digicel alleging breaches related to international bypass violations impacting OneGY's exclusive license rights. While OneGY has fulfilled undisputed fee payments as invoiced, the fundamental uncertainty around fee assessment methodologies leads to accruals for disputed amounts that complicate cash flow visibility and operating expense management
The unresolved nature of these legal proceedings means that ATN faces a persistent structural risk over licensing costs that directly influence average revenue per user (ARPU) calculations and profitability trends. Longer resolution timelines keep operating leverage constrained since predictable spectrum cost inputs cannot be assured. Effectively, this legal impasse creates a material drag on forecasting future margins, given the sector’s reliance on licensed spectrum access as a foundational asset.
Business Model Nuances: Regional Telecom Operations Across Diverse Regulatory Regimes
ATN’s telecommunications portfolio spans operations principally in the United States through Alaska Communications, Bermuda under an established licensed framework subject to significant market power findings by local regulators, and Guyana through OneGY [S1][S2][F1]. This geographical diversity entails navigating varying regulatory regimes—from heavily regulated US federal programs impacting Alaska Communications to controversial spectrum fee practices in Guyana.
Revenue stems primarily from providing voice, data, and broadband internet services under exclusive or near-exclusive spectrum licenses. Monetization mechanisms rely critically on subscriber usage metrics (volume-based billing), negotiated interconnection agreements for long-distance bypass traffic handling, and government program subsidies where applicable [S1]. Ownership of wireless infrastructure versus leasing arrangements among subsidiaries influences costs; for example, certain fixed assets optimization following recent tower portfolio sales impacts capital expenditure intensity and operating expense profiles [S2][S26].
This mix of licenses enables ATN to sustain a protected subscriber base in smaller markets underserved by national carriers but imposes higher compliance overheads due to fragmented regulatory jurisdictions—each with distinct service-level agreement requirements and reporting obligations that influence operating margins.
Competitive Environment: Regional Challenges Versus National Scale Peers
When juxtaposed against large-scale U.S. operators such as AT&T or Verizon—both of which possess extensive spectrum portfolios backed by substantial financial resources—ATN operates with significantly more regulatory complexity relative to size. For instance, national carriers benefit from economies of scale in technology deployment, broader capital markets access for network modernization including 5G rollouts, and diversified ARPU streams across premium customer segments.
Conversely, ATN aligns more closely with regional players like Digicel operating in Caribbean markets faced with analogous legal disputes over spectrum usage rights [S1]. These disputes disrupt traditional licensing value extraction models and create uneven competitive groundings. Moreover, ATN differs substantially from pure infrastructure leasing entities such as Crown Castle or American Tower; owning operational networks necessitates ongoing capital expenditure commitments rather than simply collecting stable lease rents.
Service-level agreements quality relative to network uptime is another subtle point shaping churn rates within ATN's markets where reliability can be affected by aging infrastructure or capacity constraints absent continuous investment [N1]
Growth Drivers: Infrastructure Investments and Service Expansion Amid Regulatory Complexity
ATN’s growth trajectory depends heavily on targeted capital expenditures aimed at extending network coverage in underserved areas within its incumbent territories—especially Guyana and Bermuda—and selectively upgrading broadband capabilities to address rising consumer data demands [S2][F1].
Increasing mobile data consumption globally reinforces structural demand for enhanced wireless capacity; however, effective utilization requires securing clear regulatory approvals for spectrum acquisitions or renewals—a process complicated by ongoing disputes [S14]. Liquidity remains sufficient to fund incremental CapEx given $317.6 million cash balances against manageable debt levels [F1], fostering measured upgrades without excessive leverage strain.
Additionally, government programs supporting rural connectivity provide ancillary revenue mechanisms but also impose regulatory scrutiny affecting margin sustainability [S18]. Together these factors frame a growth outlook dependent not only on operational execution but timely resolution of licensing uncertainties enabling strategic capital deployment.
Risks to Watch: Legal Outcomes, Regulatory Shifts, and Capital Allocation Constraints
Key risks continue stemming from protracted judicial timelines regarding consolidated suits on interconnection agreement violations in Guyana [S1], as well as appeals around disputed tax assessments linked to decades-long filings with the Guyana Revenue Authority [S18]. Delays or unforeseen adverse rulings could materially increase operating expenses or require unexpected accrual adjustments impacting profitability.
Regulatory shifts toward price caps or ex-ante wholesale obligations in Bermuda amplify compliance burdens requiring resource reallocation potentially detracting from growth investments [S19]. Furthermore, while recent board approval raised share repurchase authorization to $30 million as of July 31, 2026 [S3], heavy buyback activity risks diverting capital from critical infrastructure upgrades essential for longer-term competitive positioning.
Balancing these constraints amid a capital-intensive industry characterized by fixed costs tied to network maintenance underscores the importance of disciplined capital allocation strategies aligned with evolving risk profiles.
What to Watch Next: Milestones in Dispute Resolution and Financial Guidance Updates
Investors should monitor outputs from the Court of Appeals in Guyana regarding consolidated lawsuits involving Digicel claims as timing remains indeterminate but pivotal for spectrum fee clarity [S1]. Similarly critical will be Telecommunications Authority announcements governing revised spectrum fee methodology or policy shifts influencing cost structures.
Quarterly earnings releases following Q2 will serve as barometers for ARPU stability amidst potential pricing pressures linked to litigation outcomes or heightened compliance expenses [N1][S2]. Additionally, further disclosures related to share repurchase execution pace could illuminate management’s confidence balance between shareholder returns versus reinvestment needs.
Financial Profile Discussion: Liquidity Cushion Amid Industry Capital Demands
As of June 30, 2026, ATN International reported robust cash and equivalents totaling approximately $317.6 million against current liabilities near $332.8 million resulting in a comfortable current ratio of 1.63 indicative of sufficient short-term liquidity [F1]. Total debt stood at roughly $268.2 million yielding an approximate net debt figure near negative $49.4 million after accounting for available cash balances—suggesting a net cash position conducive to funding ongoing capital expenditures without undue refinancing pressure.
Operating income context remains positive though below large peers given smaller scale: ATN reported net income near $167.3 million for Q2 2026 but this figure is influenced by non-operational items including litigation-related accrual adjustments reported previously [F1][S2]. The increased share repurchase authorization announced August 5 reflects confidence yet prompts vigilance around maintaining CapEx needed amid inherently high fixed-cost telecom infrastructure investments [S3].
In sum, ATN maintains a financially resilient profile supportive of executing modest network upgrades while navigating complex regulatory headwinds.
Disclaimer: This analysis is based solely on publicly available information as of August 10, 2026. It does not constitute investment advice or research views regarding securities issued by ATN International Inc. Readers should perform their own due diligence before making investment decisions.
Disclaimer: This is research-only, informational analysis and not investment advice. It may include AI-generated interpretation and general industry context. Always verify important details using primary sources.

Comments