
Banc of California Navigates Portfolio Adjustments and Liquidity Expansion Post-PacWest Merger
Q2 2026 results reflect significant securities repositioning losses but demonstrate strategic liquidity growth and continued relationship banking focus.
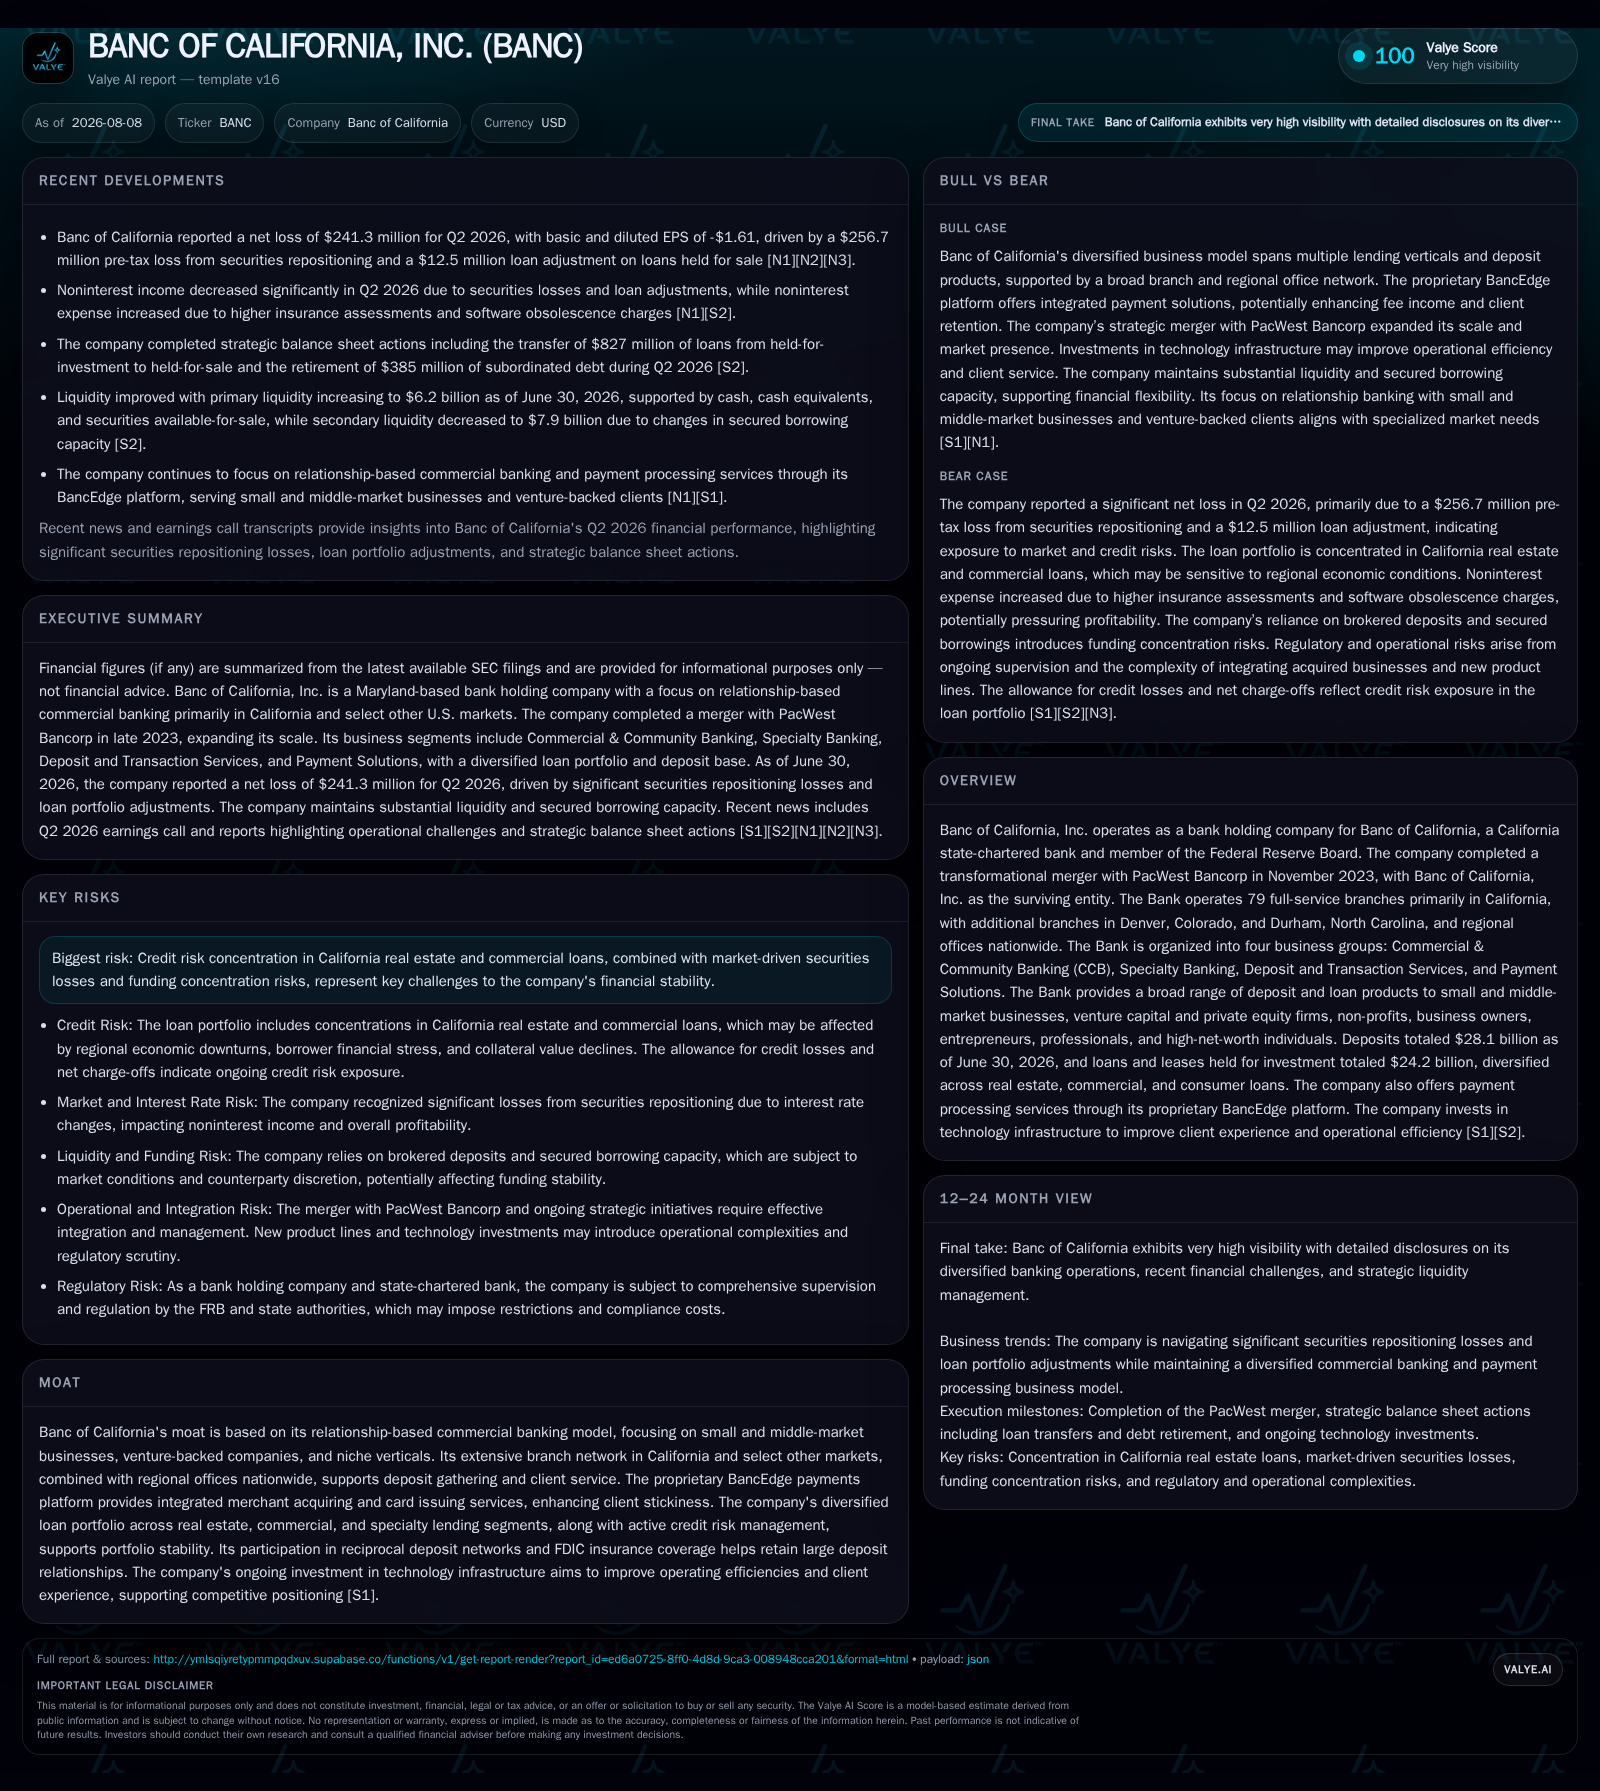
Banc of California, Inc. reported a net decrease in loans held for investment in the first half of 2026 driven by elevated payoffs and portfolio sales, alongside a steep noninterest income loss primarily due to securities repositioning. Despite earnings pressure from these adjustments, the bank expanded its primary liquidity pool significantly, supported by an increased securities portfolio. The company operates a relationship-driven commercial banking model focused on small to mid-market businesses and venture-backed clients across a California-centric footprint enhanced by regional offices elsewhere. Key risks include credit concentration, particularly in real estate and commercial sectors within California, as well as exposure to market-driven securities losses. Going forward, monitoring loan portfolio dynamics, deposit stability, and the impact of technology investments in payment solutions will be critical.
Recent Operating Update
Banc of California's Q2 2026 filing reveals meaningful shifts in its loan portfolio and funding profile that underscore an active balance sheet management stance following the transformative PacWest merger in late 2023 [S1][S2]. Total loans and leases held for investment decreased by approximately $822 million in the first half of 2026 as payoffs ($1.6 billion) and paydowns ($3.05 billion) outpaced new production and disbursements totaling $4.9 billion [S2]. Notably, there were also $74 million of sales and transfers to foreclosed assets or held-for-sale loans that reflect strategic run-off activities within certain segments [S2]. This dynamic suggests Banc of California is prioritizing credit quality discipline despite an environment of moderate loan demand.
However, this active repositioning adversely impacted noninterest income which swung from $35.3 million in Q1 to a hefty pre-tax loss of $234.1 million in Q2 2026 [S2]. The main driver was a $256.7 million writedown tied to securities portfolio repositioning — likely reflecting rising interest rates or credit spread pressures on fixed income holdings — alongside an additional $12.5 million loss related to lower-of-cost-or-market adjustments on held-for-sale loans “(LOCOM adjustment)” [S2]. While these are largely one-time mark-to-market losses impacting reported earnings volatility, their scale highlights material sensitivity within the investment book amid current market conditions.
On the expense side, noninterest expense slightly increased sequentially by $8.5 million mainly due to higher FDIC insurance assessments linked to strategic balance sheet changes and software obsolescence charges—indicative of ongoing tech platform evolution—offset partially by decline in compensation costs [S2]
Liquidity-wise, Banc of California demonstrated robust enhancement with primary liquidity rising nearly 40% from $4.4 billion at December 31, 2025, to $6.2 billion as of June 30, 2026. This jump largely stemmed from a $2 billion addition to available-for-sale securities on the balance sheet alongside higher cash equivalents excluding restricted cash [S18]. The combined liquidity available comfortably exceeds uninsured deposits and underpins financial flexibility amid market uncertainties.
Business Model
Operating as a state-chartered bank holding company headquartered in Maryland with key operations centered on California plus presence in Colorado and North Carolina, Banc of California employs a relationship-based commercial banking strategy aimed at servicing small- and middle-market businesses alongside venture-backed startups and high-net-worth individuals [S1]. It operates through four principal business groups: Commercial & Community Banking (CCB), Specialty Banking targeting vertical niches (such as HOA management via its SmartStreet™ platform), Deposit & Transaction Services focused on client cash needs, and Payment Solutions leveraging its proprietary BancEdge payments platform [S1].
Revenue generation primarily derives from net interest income — the spread earned between lending rates on diversified portfolios encompassing commercial real estate loans, construction loans, equipment leasing, SBA lending, and specialty products — plus fee-based income sourced from merchant acquiring services embedded in BancEdge as well as treasury management fees linked to deposit accounts [S1][S2]. The inclusion of venture capital financing aligns with niche industry trends supporting innovation ecosystems but requires specialized credit underwriting capabilities.
Crucial operational vectors include deposit gathering emphasizing granular noninterest-bearing deposits that provide stable low-cost funding; the company maintains approximately 79 full-service branches mainly throughout California augmented by regional offices nationally which facilitate local customer engagement vital for relationship banking models that rely heavily on trust-driven client retention [S1][S2]. This footprint complements digital enhancements anchored by fintech partnerships aimed at discrete service augmentation rather than wholesale disruption.
Industry Structure and Competitive Position
Banc of California sits within the mid-tier regional commercial bank segment combining community bank agility with broader institutional services scaled through recent mergers such as PacWest Bancorp completed late 2023 [S1]. Its peers range from regional banks like Regions Financial Corporation or BancFirst Corporation with similarly diversified loan portfolios targeting middle-market customers but often lack comparable venture banking specialization or integrated payment platforms.
The company benefits competitively from its integration of commercial lending expertise with fintech-enabled payment processing — especially BancEdge’s card-issuing capabilities which foster client stickiness amidst rising demand for seamless merchant services — yet faces headwinds from concentrated geographic exposure predominantly within California’s cyclical real estate market where macroeconomic shifts can rapidly affect asset quality.
Regulatory oversight is significant given its bank charter status requiring ongoing capital adequacy compliance per Federal Reserve Board guidelines; it faces additional scrutiny from state-level regulators such as the Department of Financial Protection & Innovation (DFPI) inherent to its California base [S1][S2]. Balancing growth ambitions while maintaining stringent credit risk controls against concentrated sector exposures entails consistent vigilance.
Growth Drivers
Growth catalysts hinge on several factors aligned with evolving client needs across core markets:
- Economic expansion elevating demand for working capital loans among small/mid-sized businesses.
- Leveraging mergers to expand branch network density especially in adjacent states like Colorado/North Carolina offers incremental product cross-selling opportunities.
- Venture capital activity driving specialty lending growth supporting startups needing flexible financing structures.
- Enhanced fee income opportunities via technology platforms like BancEdge promoting integrated payment solutions addressing SME pain-points.
- Cross-selling treasury management products into existing client relationships strengthens overall wallet share.
- Fintech partnerships broadening technological capability without near-term large-scale capital outlays.
- Regulatory adaptations potentially enabling new product lines aligned with evolving banking norms.
Evidence of these drivers manifests in steady loan production above $2 billion annually albeit offset partially by paydowns reflecting some portfolio rotation or client repayments; digital payment fees continue contributing though masked recently by portfolio repositioning losses affecting headline noninterest income metrics [S2][N1]
Risks / Watchpoints / Growth Constraints
Major risks derive chiefly from:
- Credit concentration with a notable share tied to California real estate exposures which historically exhibits volatility influenced by economic cycles or regulatory shifts impacting collateral valuations or borrower solvency.
- Mark-to-market losses stemming from securities portfolio exposure accentuated by rate cycle fluctuations under current interest rate normalization environments directly impair trading and unrealized gains/losses reported within noninterest income [S2].
- Funding stability threats emanating from reliance on brokered deposits subject to withdrawal behaviors during periods of financial market stress or competitive pricing pressures reducing low-cost stable base deposit balances.
- Execution risk linked to strategic initiatives including fintech integrations demanding specialized technical resources where failure may disrupt revenue streams or inflate operational expenses disproportionally.
- Regulatory compliance challenges intensified when partnering with third-party fintech firms which regulators scrutinize closely under anti-money laundering frameworks tightening oversight burdens.
- Economic downturn scenarios that could impede new loan bookings while simultaneously increasing charge-offs putting strain on provision buffers maintained conservatively presently but sensitive nonetheless.
- Cybersecurity vulnerabilities inherent to modern digital platforms compounded recently by AI-assisted fraud techniques escalating detection complexities without commensurate defense technology upgrades.
- Market competition from both traditional regional banks expanding specialty niches plus emerging fintech lenders eroding some segments' margins or market shares due to agility advantages.
Monitoring developments around these dimensions will be paramount for sustained healthy performance trajectories given their potential magnitude if unmitigated effectively.[S1][S2]
What To Watch Next
Key upcoming milestones encompass:
- Quarterly loan portfolio roll-forward updates signaling whether payoffs subside allowing net portfolio growth resumption.
- Net interest margin trajectory reflecting ability to manage asset/liability repricing amid fluctuating interest rate regimes affecting core spreads.
- Trends in deposit balances distinguishing between core granular deposits versus more volatile brokered categories influencing funding cost stability.
- Recovery patterns for noninterest income once securities repositioning cycle completes indicating normalization potential for fee revenue streams tied to payment processing functions.
- Progress reports or disclosures about deployment efficacy regarding BancEdge platform adoption rates impacting recurring revenues over time.
- Capital adequacy ratios maintaining buffers above regulatory minimums especially considering deferred tax asset deductions limiting usable capital reserves.[N1][N2][S2]
- Execution updates on branch productivity improvements or geographic expansion initiatives yielding tangible client acquisition successes versus mere footprint enlargement costs.
Financial Profile Discussion
Banc of California sustains a leveraged yet liquid balance sheet appropriate for its scale post-merger status with total debt approximating $2.46 billion at June 30, 2026 compared to cash plus equivalents near $311 million based on latest reported data—yielding net debt around $2.15 billion requiring vigilant liquidity monitoring [F1][S2]. Capital adequacy remains compliant against risk-weighted asset thresholds despite disallowed deferred tax assets amounting over $360 million which constrain tier-one capital applicability albeit not impairing overall regulatory compliance presently [S2].
Liquidity management emerges as a strength highlighted by primary liquidity growth surpassing two-thirds quarter-over-quarter increase driven principally by augmentations in available-for-sale securities inventory backed by convertible collateral pledges ensuring access to secured borrowings via FHLB lines totaling billions—a critical shield against any depositor withdrawal scenarios common within regional banks facing market stress periods.
Expense control appears disciplined though minor sequential upticks occur due largely to external factors like FDIC assessment increases triggered by portfolio strategy changes implying pass-through cost structure effects rather than discretionary spending expansions suggesting prudent operational cost stewardship amid volatile revenue backdrop [S2]
Collectively these financial features portray Banc of California managing transitional challenges post-merger while leveraging strong liquidity buffers complemented by solid capital positions permitting sustained support for lending activities aligned with strategic client-segment targeting [F1][S2]
This analysis is based solely on publicly available SEC filings dated through August 7, 2026 ([S1],[S2],[S3]) supplemented by supporting news transcripts ([N1],[N2],[N3]). It aims solely at providing industry-informed contextual examination without offering any investment advice or research views.
Disclaimer: This is research-only, informational analysis and not investment advice. It may include AI-generated interpretation and general industry context. Always verify important details using primary sources.

Comments