
Bar Harbor Bankshares: Margin Expansion, Deposit Growth, and the Regional Banking Tradeoff
Bar Harbor Bankshares posts higher net interest margins and deposit growth as it leans into commercial lending and fee income, but faces ongoing pressures from rate sensitivity and regional credit risk.
Bar Harbor Bankshares’ Q3 2026 results show rising net interest margins, deposit inflows, and increased non-interest income, underpinned by a conservative liquidity policy and modest loan growth. Its challenge is to sustain asset quality and margin gains amid rate volatility, sector competition, and the inherent risks of a concentrated regional footprint. Monitoring credit trends, deposit mix, and the impact of ongoing branch investments will be key to judging whether recent improvements are durable or cyclical.
Bar Harbor Bankshares’ latest quarter reflects the strengths and tradeoffs of a disciplined regional lender. The company is capitalizing on higher net interest margins and deposit growth, fueled by a shift toward commercial lending and a diversified fee base. Yet, as it invests in branch infrastructure and manages credit exposures, Bar Harbor must navigate the persistent risks of interest rate volatility and regional economic shifts. The next phase will test whether its conservative liquidity stance and operational investments can drive sustainable growth, or if sector headwinds and competitive pressures will cap upside.
Recent Margin Expansion and Deposit Growth: A Snapshot of Q3 2026
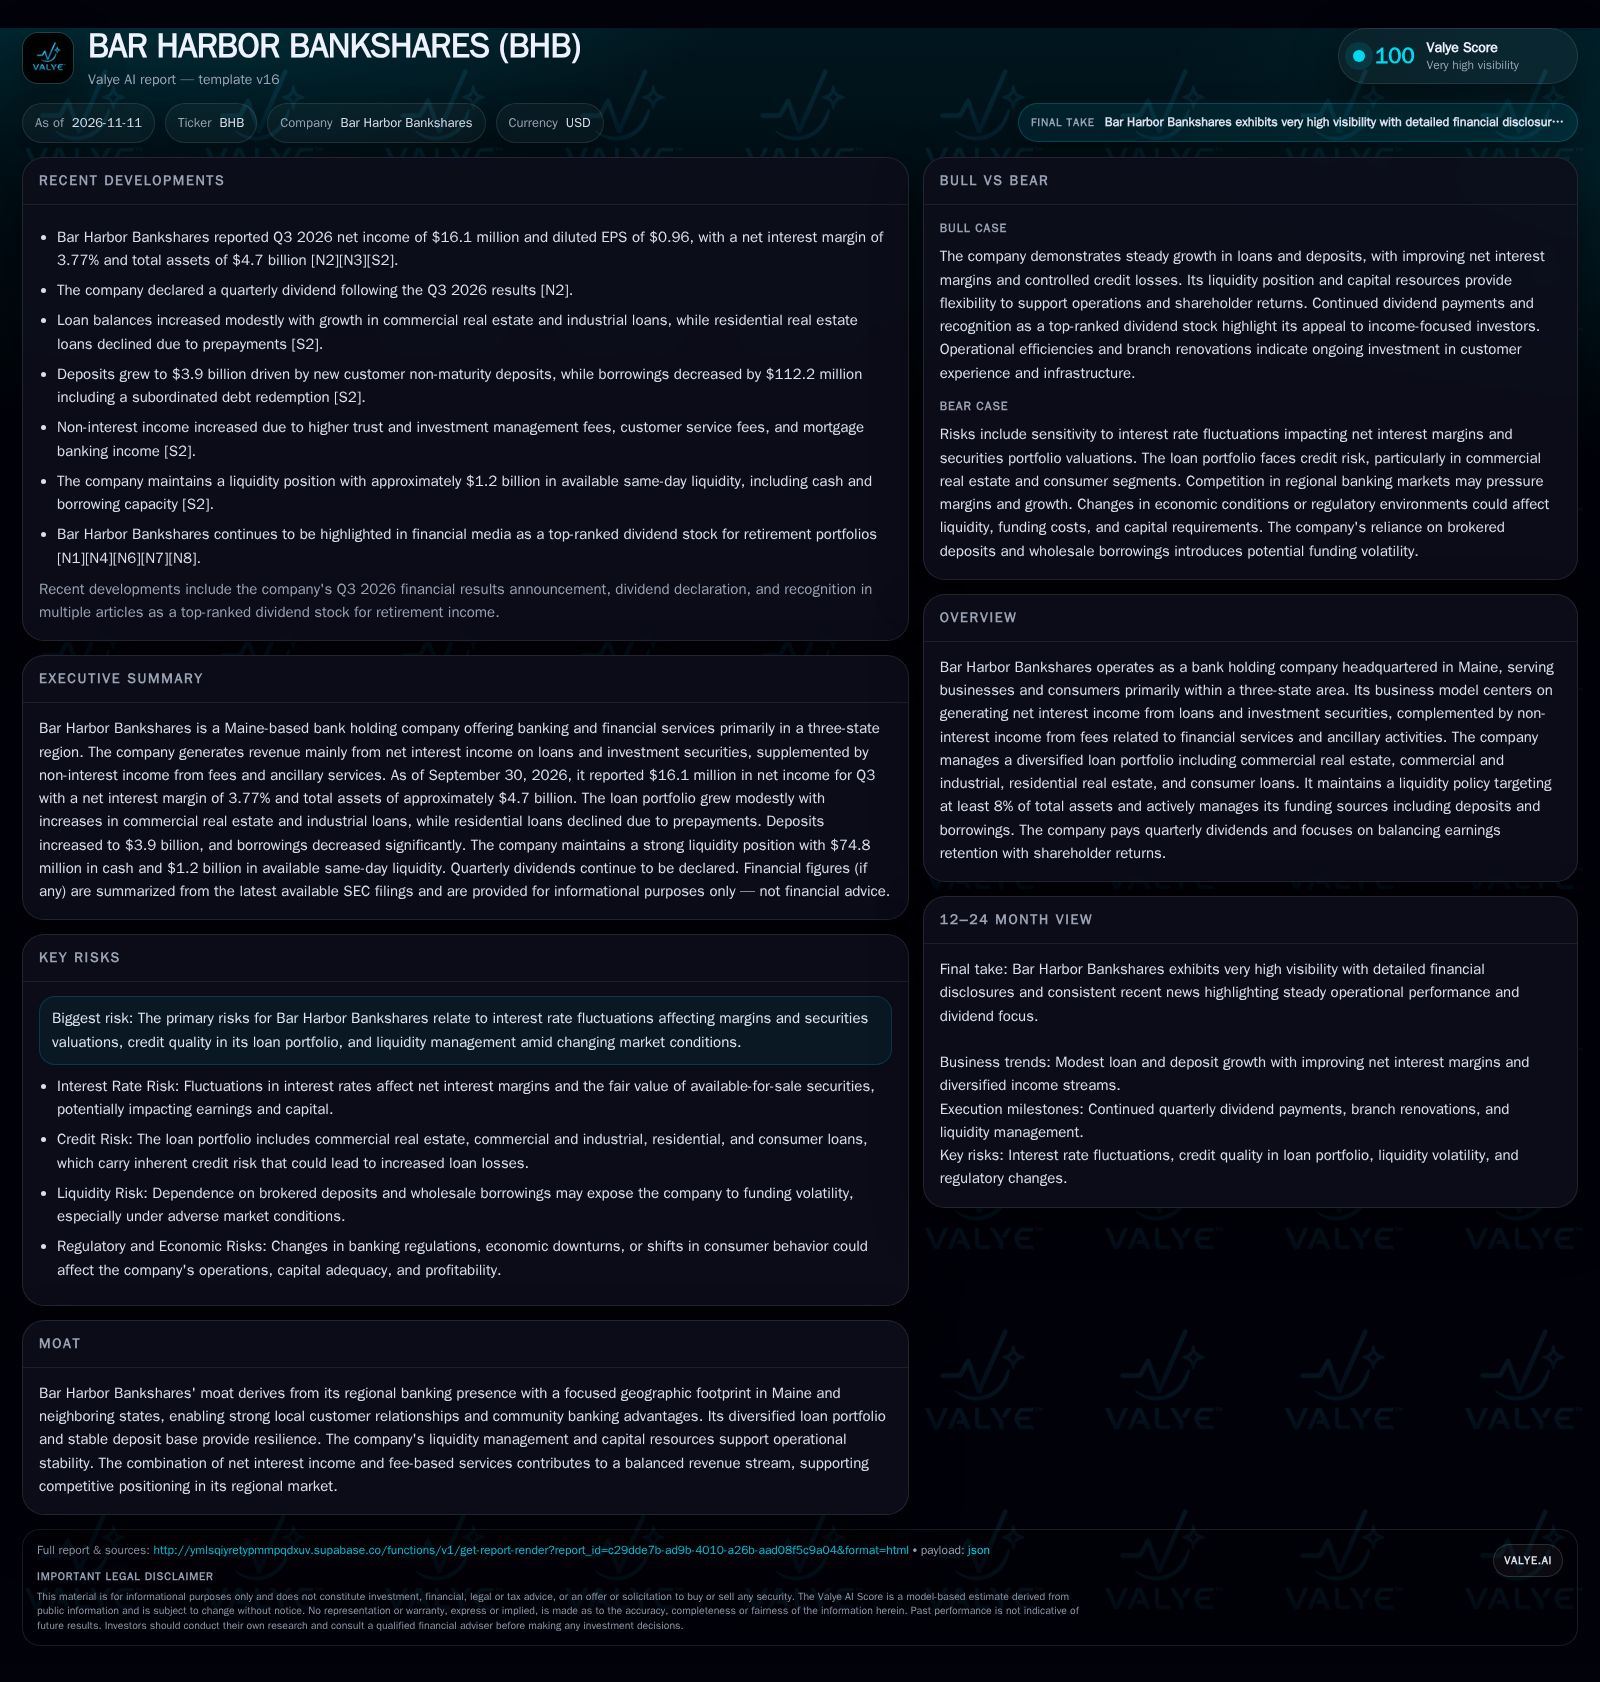
Bar Harbor Bankshares reported net income of $16.1 million for Q3 2026, with diluted EPS of $0.96 and a net interest margin of 3.77%—a notable improvement from 3.56% in Q3 2025 [S2]. This margin expansion comes alongside a modest increase in total loans to $3.6 billion, with growth concentrated in commercial real estate and commercial & industrial lending, partially offset by prepayments in residential real estate [S2]. Deposits increased to $3.9 billion, driven by new customer non-maturity deposits, while borrowings fell by $112.2 million, reflecting a $20 million subordinated debt redemption [S2]. Non-interest income rose to $10.8 million, underpinned by higher trust, investment management, and mortgage banking fees [S2]. The bank ended the quarter with $1.2 billion in available same-day liquidity and continued its policy of quarterly cash dividends [N2] [S2].
How Bar Harbor Earns: Interest Margin, Fee Diversification, and Leverage Dynamics
Bar Harbor Bankshares generates the majority of its revenue from net interest income—spreads between interest earned on loans and investment securities versus interest paid on deposits and borrowings [S2]. Net interest margin (NIM) is a key profitability driver, and the recent increase to 3.77% suggests favorable asset-liability repricing or improved loan mix. Commercial loans, which tend to carry higher yields and reprice more quickly than fixed-rate residential mortgages, have grown, potentially supporting further margin resilience if credit quality holds.
Non-interest income is an important diversifier, with Q3 2026 growth in trust, investment management, and mortgage banking fees [S2]. Such fee-based revenue is typically less sensitive to short-term rate movements, providing some buffer against NIM compression. Operating leverage is influenced by both salary/branch investment and efficiency in fee generation. While non-interest expenses decreased year-over-year in Q3, branch renovation costs and higher salaries drove a nine-month expense increase, highlighting the ongoing need for scalable growth to offset cost inflation [S2].
The company’s funding structure relies primarily on core deposits, supplemented by brokered deposits and wholesale borrowings. The company reported cash and liquidity metrics for the period; these figures do not by themselves establish operating runway, investment capacity, financial flexibility, or financing capacity. [S2]
Regional Banking Advantage: Local Relationships vs. Structural Sector Pressures
Bar Harbor’s competitive position is rooted in its focused three-state footprint, which enables strong community ties and local market knowledge. Such positioning can support customer loyalty, especially among small businesses and local commercial clients, reducing the risk of rapid deposit flight in stress periods. However, this regional focus also means Bar Harbor is more exposed to localized economic downturns and industry concentrations, with commercial real estate and commercial & industrial loans comprising a growing share of the portfolio [S2].
The bank competes with other regional and community banks, as well as larger national institutions offering digital products and more expansive service menus. Fee-based services like trust and investment management help differentiate Bar Harbor from pure-play lenders, but the scale and technology investments of larger banks remain a challenge. Digital adoption, branch network optimization, and customer service levels are likely to be critical in defending share against both fintech entrants and consolidating incumbents.
Switching costs in retail and small business banking are moderate—relationship depth and service quality matter, but depositors can and do move for better rates or digital convenience. Bar Harbor’s ability to maintain a stable, low-cost deposit base and to cross-sell fee-generating services will be central to its long-term moat.
Margin Expansion and Fee Growth Drive Sustainable Outperformance
If Bar Harbor continues to expand its net interest margin while keeping credit costs in check, the bank could deliver above-peer profitability. Sustained growth in commercial lending, combined with disciplined underwriting and stable regional economies, would support loan growth without undue credit risk. Further increases in non-interest income—especially from high-margin trust and investment management services—could provide incremental upside and reduce earnings volatility.
Operational leverage may improve if recent branch renovations lead to higher customer acquisition and cross-sell rates without a commensurate increase in overhead. Confirmation of this scenario would include continued NIM expansion, rising fee income, stable or improving credit quality metrics, and positive operating leverage (revenue growth outpacing expense growth) over the next several quarters.
Steady-State Banking: Modest Growth Amid Sector Headwinds
The most plausible path is for Bar Harbor to maintain modest loan and deposit growth, with NIM stabilizing near current levels as competitive and rate pressures offset incremental gains. Credit quality remains generally stable, but incremental provisioning may be required if commercial real estate or consumer portfolios show signs of stress. Non-interest income continues to grow gradually but is unlikely to offset any sharp NIM compression.
Expense growth is managed but pressured by wage inflation and branch investments. Evidence supporting this scenario would be quarterly results showing stable margins, low-to-moderate credit losses, steady fee income, and expenses tracking in line with inflation-adjusted expectations.
Margin Compression and Credit Deterioration Trigger Profitability Headwinds
Adverse outcomes could materialize if interest rates fall sharply or if deposit competition intensifies, compressing net interest margins. At the same time, a deterioration in commercial real estate credit quality—given its increased portfolio share—could force higher loan loss provisions, eroding profitability. If regional economic conditions weaken or if depositors shift to higher-yield alternatives, Bar Harbor may need to increase funding costs or tap more expensive wholesale sources.
A negative scenario would be confirmed by declining NIM, rising nonperforming assets, higher charge-offs, an uptick in deposit outflows, and increasing non-interest expenses outpacing revenue growth. Any sign of regulatory scrutiny or material downgrades in the loan book would further validate downside risks.
What Will Determine Whether Bar Harbor Sustains Its Margin and Growth Momentum?
Quarterly net interest margin trends, especially as loan repricing and deposit cost dynamics shift in a changing rate environment [S2].
Loan growth by segment—particularly commercial real estate and commercial & industrial balances versus residential runoff [S2].
Allowance for credit losses coverage ratio and any signs of nonperforming loan increases, especially in commercial portfolios [S2].
Deposit mix evolution: growth in core, non-maturity deposits versus reliance on brokered or higher-cost funding sources [S2].
Non-interest income composition and growth, with a focus on trust, investment management, and mortgage banking fees [S2].
Expense trajectory: branch renovation costs, salary trends, and overall operating leverage (if disclosed).
Dividend continuity and payout ratio, as a signal of management’s earnings outlook and capital allocation discipline (if disclosed) [N2] [S2].
Disclaimer: This is research-only, informational analysis and not investment advice. It may include AI-generated interpretation and general industry context. Always verify important details using primary sources.

Comments