
RideNow Group: Inventory Sourcing Innovation, Margin Pressure, and the Challenge of Scaling Powersports Retail
RideNow Group, Inc. is navigating a volatile post-pandemic retail landscape by leveraging its proprietary Cash Offer tool and a 46-dealership network across the Sunbelt. While its transparent pricing model and acquisition-driven growth strategy create competitive differentiation, Q3 2026 losses and macroeconomic headwinds highlight the operational and integration risks that could define its next phase.
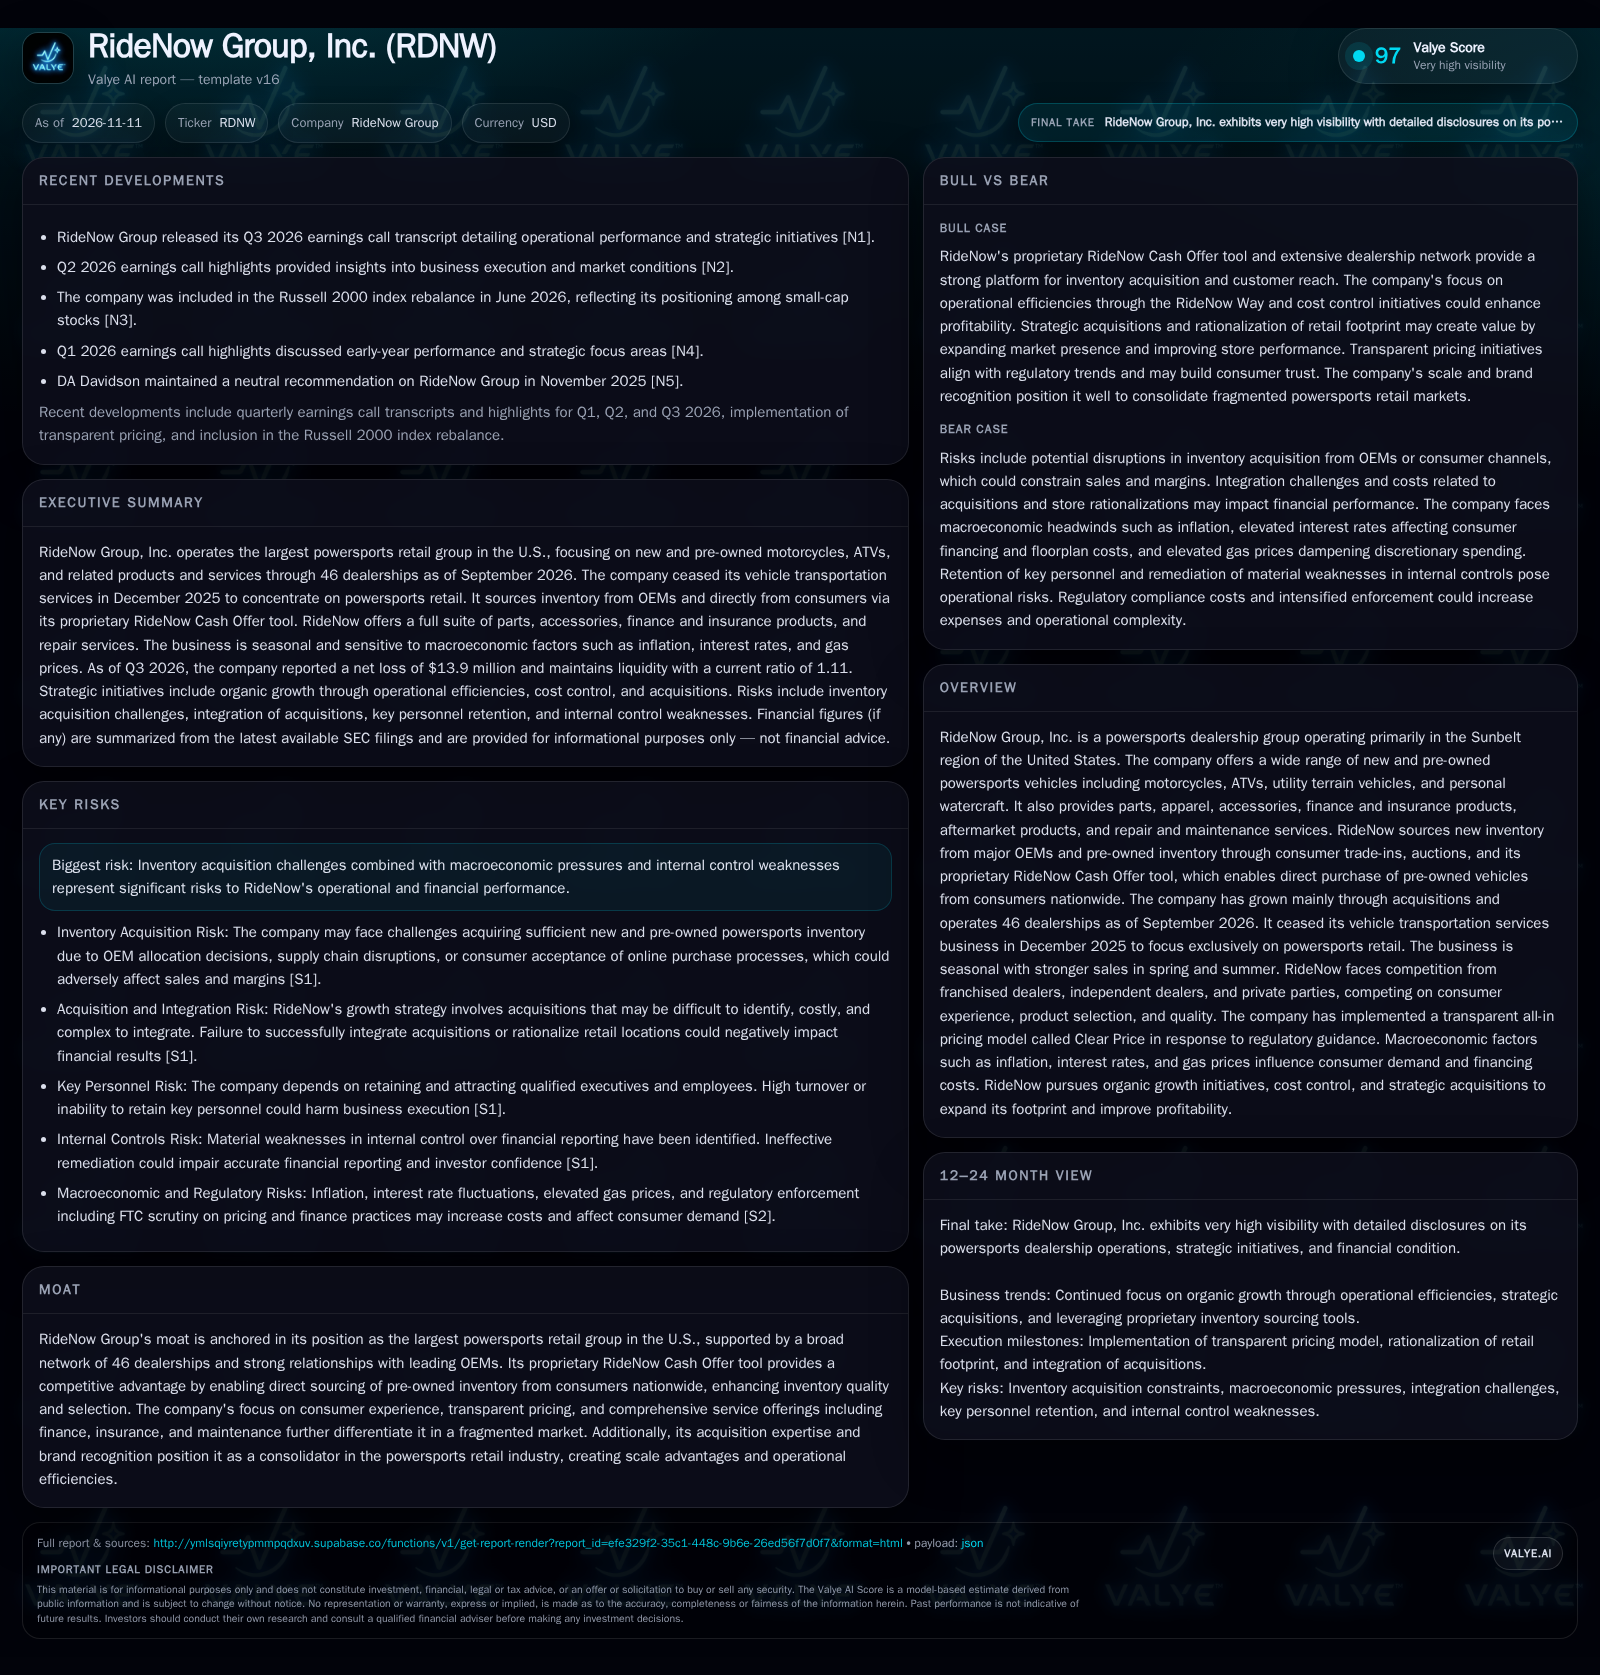
RideNow Group is the largest powersports dealership group in the U.S., operating 46 locations with a focus on motorcycles, ATVs, and related services. The company’s proprietary RideNow Cash Offer tool enhances pre-owned inventory sourcing, supporting its consolidation strategy. However, a Q3 2026 net loss and macroeconomic pressures—including rising interest rates and inflation—underscore challenges in margin management and acquisition integration. RideNow’s move to transparent pricing and centralized support aims to improve consumer trust and operational efficiency, but execution risks and inventory acquisition constraints remain material.
RideNow Group, Inc. stands at a crossroads in the U.S. powersports retail sector. As the largest dealership group of its kind, RideNow is betting on technology-enabled inventory sourcing and acquisition-driven expansion to outpace a fragmented field of independent and franchised rivals. Yet, recent financial results reveal the mounting challenge of translating scale into sustainable profitability. Margin compression, macroeconomic volatility, and the operational complexity of integrating dozens of dealerships could define whether RideNow’s consolidation thesis delivers durable value or stalls amid industry headwinds.
Recent Results Highlight Margin Compression and Strategic Retrenchment
As of September 30, 2026, RideNow operated 46 dealerships concentrated in the Sunbelt, having exited its vehicle transportation services business in December 2025 to focus exclusively on powersports retail [S1] [S2]. This strategic retrenchment clarifies the company’s core direction but removes a diversification hedge. [S2] These results underscore the challenge of maintaining profitability and balance-sheet flexibility amid variable demand and acquisition integration costs. The rollout of the Clear Price transparent pricing model across all dealerships as of Q3 2026 is a notable operational milestone, aimed at building consumer trust and aligning with regulatory enforcement priorities [S2] [N1].
How RideNow Makes—and Could Lose—Money: Powersports Retail Economics
RideNow’s revenue streams include the sale of new and pre-owned vehicles, parts, accessories, finance and insurance (F&I) products, aftermarket offerings, and service/maintenance. New inventory is sourced under standard OEM dealer agreements, while pre-owned inventory is acquired through consumer trade-ins, auctions, and the proprietary RideNow Cash Offer tool—potentially providing a cost and selection advantage versus peers [S1] [S2].
Gross margins in powersports retail are typically higher on pre-owned vehicles and F&I products compared to new units, but are highly sensitive to inventory acquisition costs and consumer demand elasticity. The all-in Clear Price model could reduce negotiation friction and build volume, but may limit the ability to capture price premiums in tight supply environments or pass on higher costs during inflationary periods.
Variable costs dominate the business model—inventory, floorplan interest, and commission-based compensation—but fixed overhead is substantial due to dealership staffing, real estate, and centralized support functions. The company’s focus on operational efficiency, cost control, and digital lead conversion is designed to boost throughput and F&I penetration, which historically drive operating leverage in dealership models if volume recovers. However, rising floorplan interest expense (sensitive to rate hikes) and inflationary pressures on wages, utilities, and parts could erode margins unless offset by efficiency gains or higher-ticket sales [S2].
Acquisitions have been central to RideNow’s growth, but integrating new stores and rationalizing the retail footprint introduces significant one-time and ongoing costs. Effective integration is required to achieve expected synergies and avoid duplicative overhead.
Inventory Sourcing Tools and Brand Scale: A Double-Edged Sword in a Fragmented Market
RideNow is positioned as the largest U.S. powersports dealership group, conferring potential advantages in terms of brand recognition, OEM relationships, and purchasing scale [S1]. Its proprietary RideNow Cash Offer tool may provide a unique edge in directly sourcing pre-owned inventory, enabling better selection and potentially lower procurement costs compared to competitors reliant on auctions or in-store trade-ins.
However, the market remains highly fragmented, with competition from franchised OEM dealers, independent retailers, and private-party sellers. Product selection, consumer experience, and pricing transparency are key competitive battlegrounds. The implementation of the Clear Price model addresses growing regulatory scrutiny and could enhance consumer trust, but also removes some pricing flexibility that smaller rivals may retain.
Substitution risk is moderate: while powersports vehicles are discretionary purchases, RideNow’s breadth of product and service offerings creates some switching friction, particularly for customers seeking bundled F&I, maintenance, and aftermarket solutions. Yet, the rise of online marketplaces and digital-first competitors could compress margins or bypass traditional dealership economics if consumer preferences shift materially.
OEM allocation risk remains a structural vulnerability—major brands control new vehicle supply, and any tightening of allocations or changes in dealer agreements could disadvantage even the largest consolidators.
If Inventory Acquisition and Integration Succeed, RideNow Could Deliver Operating Leverage
A favorable scenario for RideNow hinges on the successful scaling of its Cash Offer tool, enabling a steady and cost-effective flow of high-quality pre-owned inventory. If digital lead conversion, F&I penetration, and service retention initiatives drive higher per-store productivity, the company could realize improved gross and operating margins as fixed costs are leveraged across a larger revenue base.
Effective integration of acquired dealerships and the rationalization of overlapping or underperforming locations would be essential to unlocking synergy targets and reducing overhead. The Clear Price model, if embraced by consumers, could accelerate sales cycle times and support volume growth, especially if RideNow’s regulatory alignment attracts risk-averse buyers.
Evidence confirming this scenario would include a sequential improvement in gross margin percentage, higher F&I attachment rates, increased pre-owned sales mix, and positive operating income in subsequent quarters. Additionally, stable or improving inventory turns and reduced days-in-inventory would signal effective execution.
Sustained Margin Pressure and Mixed Execution Define the Most Likely Outcome
The most plausible near-term scenario is continued operational volatility. While the RideNow Cash Offer tool may help keep pre-owned inventory flowing, macroeconomic pressures—especially on consumer discretionary spending and financing costs—are likely to dampen overall demand for powersports vehicles. Interest rate risk will continue to affect floorplan expenses, and price-sensitive consumers may gravitate toward used inventory, compressing new unit margins.
Acquisition integration will remain a drag on profitability, with synergy capture slower than modeled. The Clear Price initiative is likely to deliver regulatory and reputational benefits but may take time to drive material volume or margin improvements. RideNow’s digital and operational initiatives could yield incremental gains but are unlikely to fully offset external headwinds in the short term.
This scenario would be confirmed by persistent net losses or only marginal improvement in operating income, continued pressure on gross margins, and volatility in inventory turns. Modest sequential growth in ancillary revenue streams (F&I, service, accessories) would suggest partial success, but without a clear inflection point.
Inventory Shortfalls or Integration Failures Could Trigger a Prolonged Earnings Slump
A more adverse scenario would materialize if RideNow faces sustained difficulty acquiring sufficient new or used inventory—whether due to OEM allocation changes, consumer reluctance to transact online, or supply chain disruptions. This could drive down sales volume and force margin-eroding price competition for available stock.
If acquisition integration falters—due to cultural clashes, IT system failures, or retention issues among key personnel—the company could face elevated overhead without the expected revenue or cost synergies. Regulatory missteps or non-compliance with pricing and finance practices could also result in fines or operational constraints.
Deterioration in inventory turns, rising days-in-inventory, or a spike in customer complaints would also signal execution breakdowns.
Milestones and Metrics That Will Determine If RideNow’s Retail Consolidation Pays Off
Quarterly gross margin trends, especially pre-owned versus new vehicle margins, would help test the impact of inventory sourcing and pricing initiatives.
F&I penetration rates and average revenue per vehicle sold (if disclosed) would provide insight into RideNow’s ability to drive high-margin ancillary sales.
Sequential changes in inventory turns and days-in-inventory will indicate whether inventory management and sourcing advantages are materializing.
Operating income progression and cash flow from operations are critical to gauging whether scale and efficiency gains are offsetting cost pressures.
Store-level productivity metrics (such as sales per dealership or per employee, if disclosed) would clarify the effectiveness of integration and organic growth initiatives.
Attrition rates among key personnel and successful remediation of material weaknesses in internal controls should be monitored, given their impact on execution and investor confidence.
Any major changes in OEM allocation policies or supply chain disruptions could rapidly alter the company’s sales outlook and margin profile.
Consumer adoption rates of the Clear Price model and customer satisfaction scores (if disclosed) would help test whether transparent pricing is building trust or eroding pricing power.
Disclaimer: This is research-only, informational analysis and not investment advice. It may include AI-generated interpretation and general industry context. Always verify important details using primary sources.

Comments