
CEVA’s Wireless IP Dominance Meets Profitability Hurdles: Can Market Leadership Translate Into Sustainable Growth?
Despite holding a prominent position in wireless interface IP and reported liquidity position, CEVA Inc.
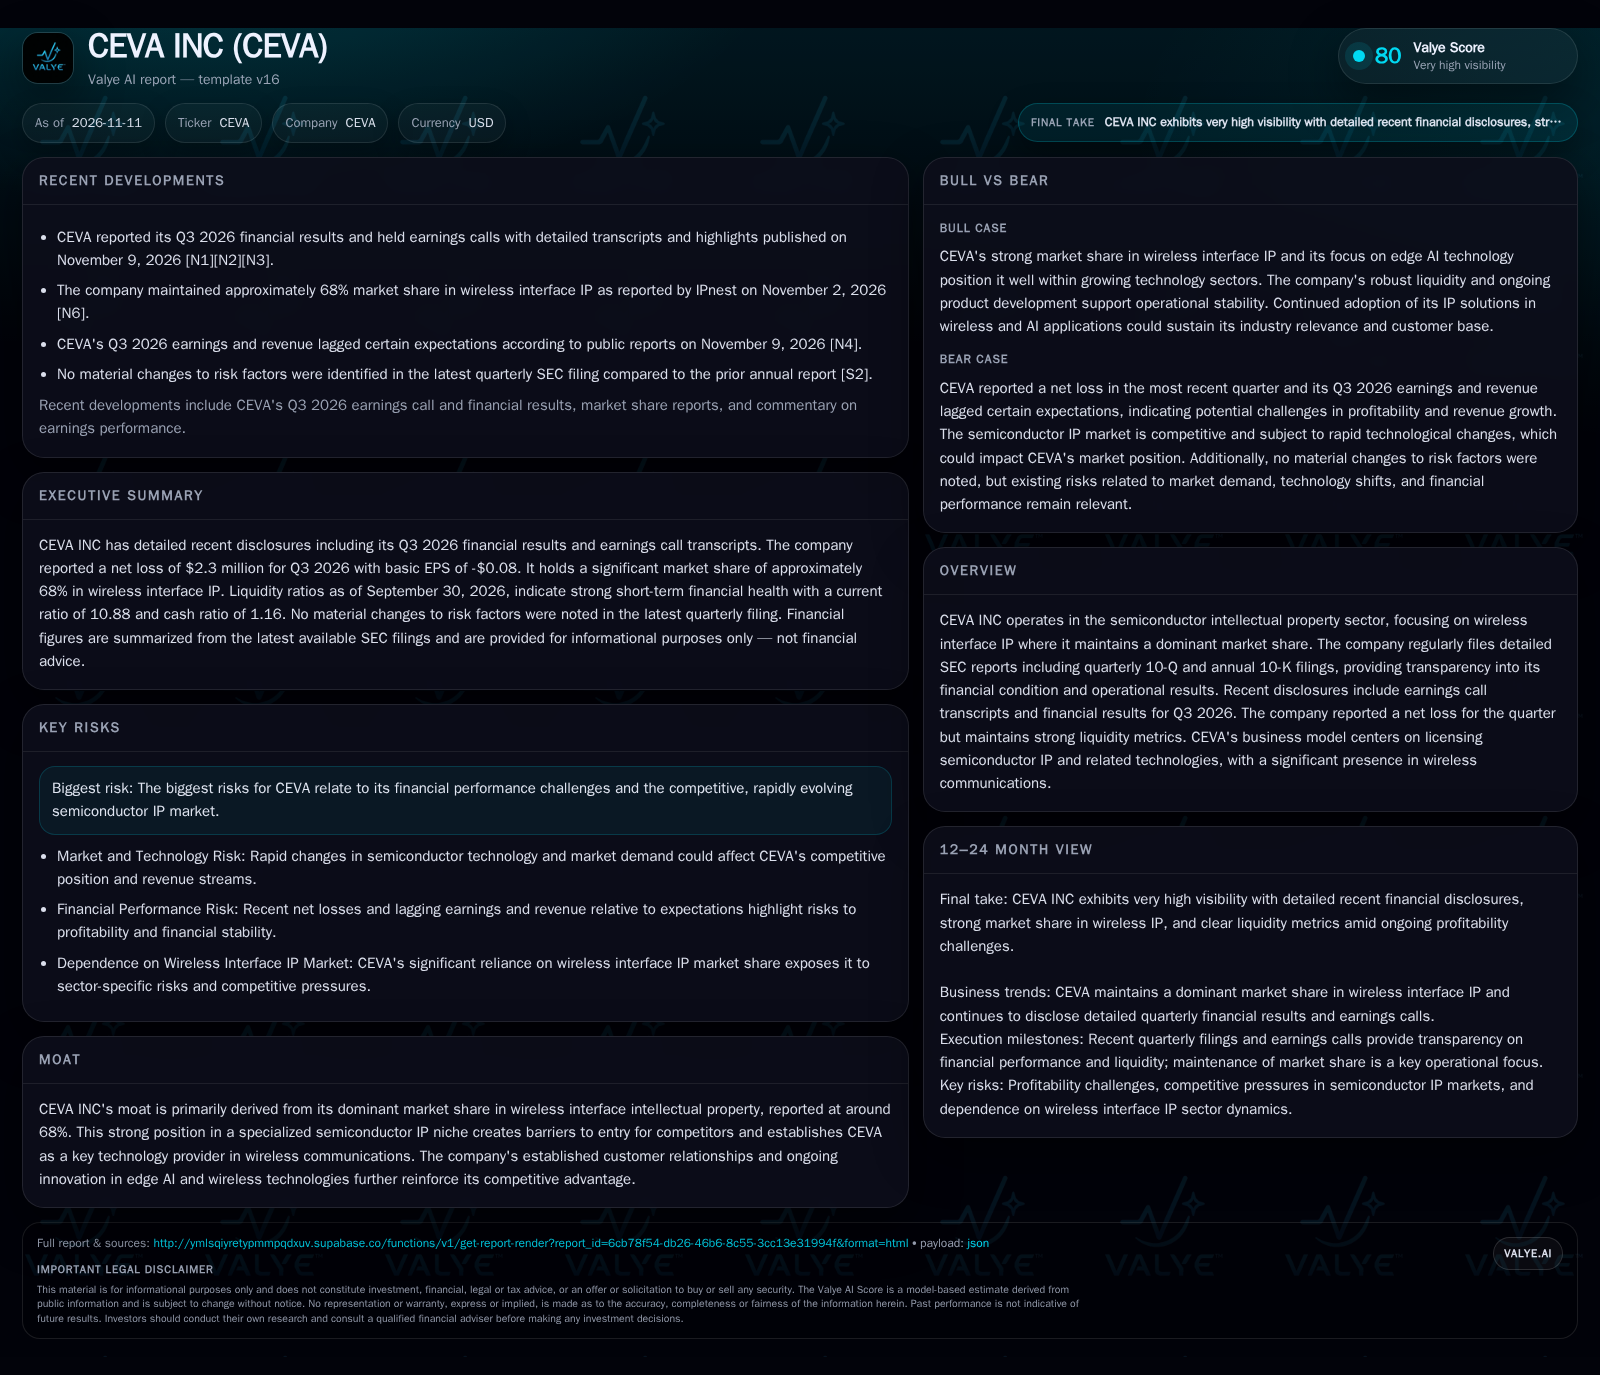
Despite holding a prominent position in wireless interface IP and reported liquidity position, CEVA Inc. posted a net loss for Q3 2026 and missed earnings expectations. The company’s ability to leverage its market share and innovation into sustained profitability remains the central question.
CEVA Inc. continues to command the wireless interface IP landscape, boasting a 68% market share and maintaining a reported liquidity position as of Q3 2026. Yet, the company’s recent net loss and underwhelming revenue performance highlight the persistent challenge of translating technological leadership into reliable financial returns. As the semiconductor IP sector faces rapid innovation cycles and intense competition, CEVA’s future depends on its ability to sustain customer adoption, extract value from its portfolio, and manage evolving industry risks.
Recent Financial Results and Market Standing: What’s Changed for CEVA?
CEVA Inc. reported a net loss of $2.3 million for the quarter ended September 30, 2026, translating to a basic earnings per share of -$0.08. This result fell short of certain earnings and revenue expectations, suggesting ongoing profitability challenges [S2] [N4]. Despite these headwinds, CEVA continues to hold a prominent position in the wireless interface IP market, maintaining an estimated 68% market share as of November 2026 [N6]. On the balance sheet, the company reported cash and cash equivalents of $29.6 million and a current ratio of 10.88 on September 30, 2026, reflecting a reported liquidity position as measured by standard ratios [S2]. No material changes to risk factors were disclosed in the latest 10-Q filing compared to the prior year, indicating a stable risk profile but persistent sectoral and operational challenges [S2]. These facts center the current thesis: CEVA’s industry leadership is clear, but financial performance remains a question.
Licensing, Royalties, and the Leverage Dilemma in Semiconductor IP
CEVA’s core business model relies on licensing its semiconductor intellectual property—primarily in wireless interface technologies—to chipmakers and device manufacturers. Revenue streams typically include upfront license fees and ongoing royalties, with the latter tied to the volume of end-user devices shipped using CEVA IP. This model is attractive for its potential operating leverage: once IP blocks are developed, incremental royalty revenue comes with low marginal costs. However, the flip side is exposure to cyclical demand in end markets (e.g., smartphones, IoT, automotive), and lags between design wins and royalty realization can create revenue volatility.
The company reported cash and liquidity metrics for the period; these figures do not by themselves establish operating runway, investment capacity, financial flexibility, or financing capacity. As competition in wireless IP intensifies and customers seek more integrated or custom solutions, pricing power may be limited unless CEVA can differentiate through technology or ecosystem value. Operating leverage potential remains, but only if design win momentum translates into high-volume royalty streams.
Barriers to Entry Versus Evolving Threats: CEVA’s Moat Under the Microscope
CEVA’s primary competitive advantage is its scale and reputation in wireless interface IP, where a 68% market share signals entrenched relationships with major chipmakers and device OEMs [N6]. Barriers to entry stem from the complexity of wireless standards, the cost and risk of switching IP vendors, and the value of proven, widely licensed technology. However, the competitive landscape remains dynamic. Large semiconductor companies may develop in-house IP, especially for high-volume or differentiated products, while emerging open-source initiatives and alternative IP vendors threaten price and margin compression.
A further risk is technological substitution: as wireless standards evolve (e.g., from 5G to 6G), new entrants or disruptive architectures could reset the competitive field. CEVA’s efforts in edge AI and continued innovation are critical, but customer stickiness will depend on the company’s ability to stay ahead of technology curves and regulatory standards. The question is whether CEVA’s current dominance can persist as the industry pivots to new wireless and AI paradigms.
From Design Wins to Royalty Upside: The Levers for Outperformance
A favorable scenario for CEVA would see accelerated adoption of its IP in high-growth sectors such as IoT, automotive, and edge AI, driving a step-change in royalty revenue as customers ramp production. This could be enabled by new design wins with leading semiconductor and device OEMs, successful migration of existing customers to next-generation wireless standards, and expansion into adjacent verticals. If CEVA’s R&D investments yield differentiated IP that is perceived as essential for compliance with emerging standards or for enabling premium device features, the company could regain pricing power and improve its margin profile.
Confirmation of this scenario would come from disclosed growth in royalty-bearing chip shipments, a visible uptick in design win announcements, and improved quarterly profitability metrics. Conversely, if royalty and licensing revenue remain flat or if customer concentration rises, the thesis for sustainable upside would be weakened.
Stability in Market Share, but Profitability Remains Elusive
The most plausible outcome is that CEVA sustains its leadership in wireless interface IP, maintaining its customer base and defending market share, but continues to face margin pressure and earnings volatility. In this scenario, revenue growth may be modest, pacing overall sector trends, with new design wins offsetting legacy product declines. R&D and customer support costs remain elevated as CEVA invests to keep pace with evolving standards and customer requirements.
Evidence supporting this scenario would include continued high market share, stable or slowly growing revenue, and a gradual narrowing of quarterly losses. Falsification would come from either a material drop in market share (indicating competitive erosion) or a sudden inflection in profitability (suggesting the company has overcome its leverage dilemma).
When Dominance Isn’t Enough: Triggers for Value Erosion
The adverse scenario would materialize if CEVA’s royalty and licensing revenue deteriorates due to macroeconomic softness, competitive displacement, or a shift toward in-house or open-source IP among key customers. Loss of design wins in next-generation standards or major customer defections could accelerate revenue declines. If the company is forced to cut R&D or sales investment to conserve cash, its technology edge and customer relationships may erode, further compounding the risk.
This scenario would be confirmed by declining market share, shrinking cash balances (absent external capital raises), and widening net losses. Early warning signs would include a drop-off in design win announcements, negative customer commentary, or evidence of major OEMs internalizing wireless IP functions.
Testing the Thesis: What Will Determine Whether CEVA Converts Leadership Into Profitability?
Royalty-bearing chip shipment trends, if disclosed, to gauge whether design wins are translating to high-volume production.
The cadence and scale of new design win announcements in emerging sectors (e.g., automotive, IoT, edge AI).
Gross margin trends and operating leverage, particularly as new IP generations are commercialized.
Customer concentration metrics—would help assess risk exposure if disclosed.
Evidence of pricing power, such as higher average royalty rates or improved licensing terms.
Sustained R&D investment levels and the pace of new product introductions.
Any change in market share reported by third-party sources or the company itself.
Cash flow from operations, to test whether the business is self-funding or reliant on the balance sheet over time.
Disclaimer: This is research-only, informational analysis and not investment advice. It may include AI-generated interpretation and general industry context. Always verify important details using primary sources.

Comments